Using Active Technologies
|
Topics: |
This topic provides an overview of Active Technologies and discusses security and active cache processing. It includes additional information about the features of the product that will help you use it. It is intended for administrators and developers who are responsible for creating active reports, charts, and dashboards.
This topic also describes the features of an Active Technologies report, which is a report that is enabled to use the full capabilities of Active Technologies. An Active Technologies report is also called an active report.
Active Technologies Report Overview
|
Topics: |
An active report is a report that is designed for offline analysis. When using an active report, you can:
- Interact with the data, using analysis options similar to those found in an Excel® workbook, without any connection to a server. Analysis options include filtering, sorting, charting, and much more.
- Work offline without any additional plug-ins or programs. An active report is a self-contained report, meaning that it contains all the data and JavaScript® within the HTML output file. Packaging the data and the interactive functions in the HTML file also makes the output highly compressible for email and transparent to security systems.
- Save the report on
a local machine with active report functionality. Since no connection
to a server is required to view the data or use the analysis options,
you can save and use the report anywhere.
Performance may vary across browsers due to browser-specific memory limitations. For very large reports, Internet Explorer® may produce an error. For more information, refer to the Microsoft® website.
When working with an active report, you can:
- Filter or highlight data.
- Sort data within any column in ascending or descending order.
- Apply calculations to columns and choose the location at which to display results.
- Control the display of data by hiding columns, freezing columns, limiting the number of rows per page, and using graphic visualization to compare column values.
- Create a variety of simple or advanced charts (pie, line, bar, or scatter) and Rollup Tables.
- Apply a global filter to multiple reports within the same HTML page.
- Export report data and chart data.
- Restore original report settings.
- Run active reports on your mobile device with the Opera browser (Version 8.60 U2 or higher) installed. See the Opera website for a list of supported devices.
- Run active reports on your iPhone® mobile device. For the best performance results, it is recommended that you set a maximum
of 500 records for a mobile report.
Some active report functionality is drag and drop based, and thus not supported with iPhone.
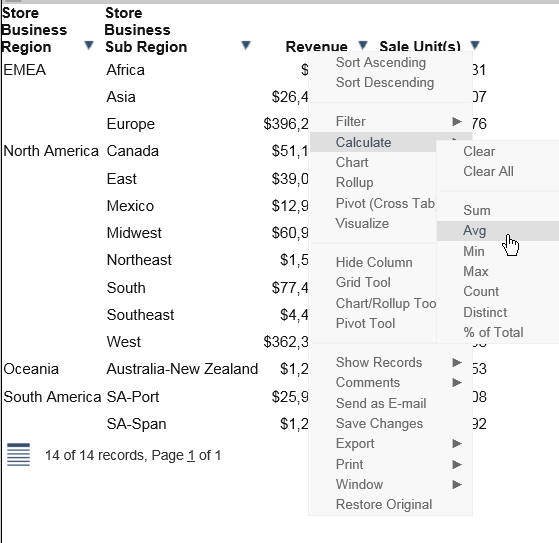
The following image shows an HTML active report. The shortcut menu is open for the Sale Unit(s) column, with the Calculate Avg operator selected.
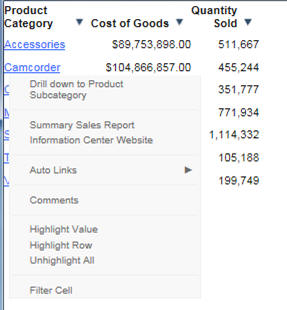
The following image shows the options that are available at the cell level for a report in active report format. Included are the options that reflect Auto Drill, Multi Drill, and Auto Linking functionality. For more information, see Customizing Content.
Security Features
You can password protect an active report. This feature restricts users from viewing the report by requiring them to enter a password before opening the report. The data is encrypted using the 256-bit Advanced Encryption Standard (AES) specification. The password is used as the key for decrypting and encrypting the data. Therefore, the password is not stored in the report, and you do not need a connection to go back to the server for password verification.
The HTML page that you receive contains both the JavaScript and the data for the report so that you can interact with the data in a disconnected mode. Internet Explorer detects the JavaScript and issues a warning. If you look at the Internet Explorer warning, it mentions explicitly the detection of active content, which is the JavaScript. The same warning appears when pop-ups are blocked in the browser.
Handling a Large Amount of Data
Because all post-retrieval processing is performed in the memory of the web browser, an active report has a processing limit of approximately 5,000 records or 100 pages of output.
Distribution and Viewing Considerations
Active Technologies stores an active report as an HTML file. The HTML file created by Active Technologies contains both the report data and the JavaScript code that enables you to interact with the data in disconnected mode.
An active report is designed for distribution to users who need to perform offline analysis and interactive functions without connection to a server.
You can save an active report from your web browser to another location. You can also send an active report to another person by email, as an HTML attachment. However, when you distribute an active report, you must keep in mind how it will be viewed.
For example, when you send an active report as an HTML attachment to email, many client email programs on a mobile device can block the JavaScript in the attachment. A third-party tool, such as the Mobile Faves App for a mobile device, may be used to correctly view the attachment.
If you try to view an active report in a web browser, and JavaScript is blocked or disabled on your web browser, you will receive a message reminding you that JavaScript must be enabled on the browser. If you are using a mobile device, the message directs you to use the Mobile Faves App. If the Mobile Faves App is not installed, you can download it from the App Store® for iOS devices or from the Google Play™ store for Android™ devices. In the message, App Store and Google Play store are hyperlinks to the Mobile Faves App.
The message is displayed on the Desktop or on a supported mobile device when JavaScript is disabled in a web browser used to open an online or offline active report. It is also displayed on the Preview pane or window of an application used to preview the content of an offline active report.
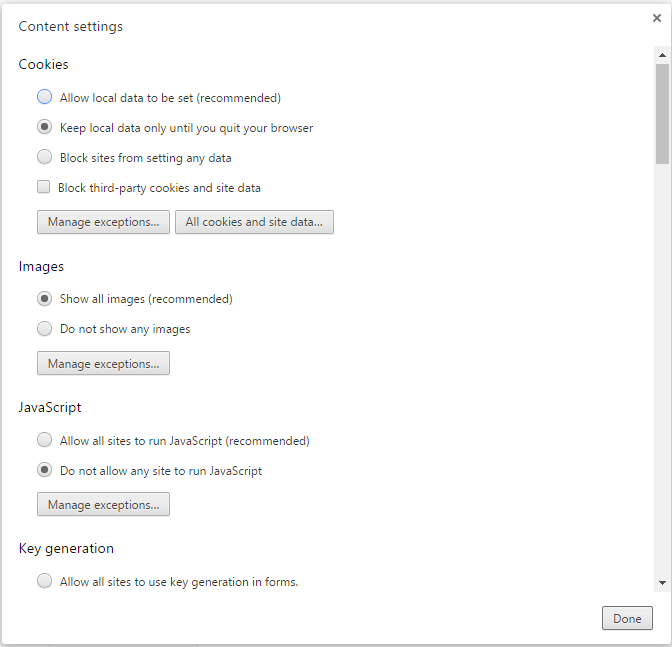
The following image shows JavaScript disabled in Google Chrome™.
Usage Notes for Active Technologies
The following apply to browser support.
- ActiveX, a technology from Microsoft, is not supported in Microsoft Edge. Therefore, any Active Technologies feature that
requires the use of ActiveX controls is not available in Microsoft Edge. These features include the following, which are accessible
in other browsers at run time, using the column drop-down menu on an active report:
- Send as E-mail (supported only in Internet Explorer)
- Save Changes (supported only in Internet Explorer)
- Export to XML (Excel) when active cache is disabled
- If you are using a Firefox browser and you export an AHTML report to Excel, the file extension that displays is incorrect (for example, .xls.xls). You can override this default value using the browser settings. Specifically, if you click the Always ask me where to save files radio button, located under Options, you will be prompted, upon download, to either open or save the file. You can then provide a name and extension for the file.
The following apply to Active Technologies reports.
- If multiple report components with different security passwords are included in an AHTML document, the password for the last report component is used.
- Active reports employ left and right cell padding, by default. This enables you to view the active report consistently, without the concatenation of any values or spacing issues related to the cell padding. In cases where these settings are not defined in the StyleSheet, the default settings for the left and right cell padding are used.
- By default, Active Technologies displays the name specified in the Master File to identify a column in an ACROSS group on
a tabular active report. With the following WebFOCUS SET command, you can display the title specified in the Master File,
instead of the name, to identify the column:
SET ACRSVRBTITL = ON
Active Technologies derives the title from the TITLE attribute in the Master File (for example, TITLE = 'Product ID'). It derives the name from the FIELDNAME or FIELD attribute (for example, FIELD = PCD).
InfoAssist+ does not allow you to create or modify your active report procedures with a text editor. In Business User Edition, you must issue the SET ACRSVRBTITL = ON command in a server profile (for example, edasprof.prf). When issued in edasprof.prf, the setting is applied globally. It affects all users and all procedures run in Business User Edition.
For more information on customizing the server profile in WebFOCUS Business User Edition, see Managing the Server or Global Profile.
- The Sort Ascending, Sort Descending, and Restore Original options are accessible on a column drop-down menu on an active report. When active cache is enabled on the active report, the Restore Original option does not return the report output to its original state after sorting the data. Instead, you receive the following message: Warning: Original sort could not be determined.
The following applies to filtering Active Technologies content.
-
When using active content in Cache Mode, filtering may not work properly if the content contains a text field (for example, TX50). As a workaround, consider using an alphanumeric field (for example, A50).
The following apply to Active Technologies charts:
- When working with filters in an AHTML chart, certain filtering options do not display if you have only one column on which to filter and it has a decimal format which includes a decimal point. In this case, the Filter Chart and Exclude from Chart filtering options are not available in the chart tooltip at run time.
-
As of Release 8.2 Version 02, the chart attribute syntax has been applied to the following chart types: Dual Bar and Line, Tag Cloud, Streamgraph, Mekko, Funnel, and Pyramid. This process adds additional relevant field containers for these chart types, which can be used to specify fields in a specific area of the chart. For example, Horizontal Axis, Color, and Tooltip are field containers that are part of the chart attribute syntax.
In InfoAssist+, specific field containers appear for each chart type.
- When you run an active chart, the output displays a chart toolbar with a number of options that you can select. These options
are represented by icons. The active chart toolbar provides an Aggregation icon that allows you to select the aggregation
method (that is, the type of calculation, such as Sum or Avg) that will be used on the selected data in the chart.
If you run an active chart that does not have a measure field to which an aggregation method can be applied, the Aggregation icon:
- Appears on the chart toolbar, but cannot be selected.
- Displays None as the aggregation method. None is dimmed on the label. It indicates that there will be no aggregation performed on, or applied to, the selected data in the chart.
The following applies to Active Technologies tools.
- The comma inclusion edit option is not implemented in Rollup tables and Pivot tables when active cache is enabled.
The following apply when using the Export to Excel functionality.
- When using the Export to Excel option while creating and generating an active report with active cache enabled, the request
will be generated in XLSX format, rather than EXL2K. This applies to the following browsers: Microsoft Edge, Internet Explorer,
Firefox, and Chrome.
The export behavior is controlled by the WebFOCUS Reporting Server, and an ActiveX plugin is not required for Internet Explorer. When the export is performed, an Office Open XML document is produced, which you can download and save in the required format (default is .xlsx).
- When using the Export to XML (Excel) option with active cache disabled, the export behavior is controlled by the active JavaScript
layer.
An ActiveX plugin is required for Internet Explorer. This is used to export the output directly into Microsoft Excel, enabling you to save the document in the required format (.xlsx or .xls depending on the Microsoft Excel version installed).
In Firefox and Chrome, when the export is performed, an MS Office XML document is produced, which you can download and save in the required format (the default is .xls).
In Microsoft Edge, the Export to XML (Excel) option is not supported. The option is available with active cache disabled, but when the export is performed, the output is displayed as text inside the browser window.
The following apply when using mobile devices.
- The Chrome browser Force enable zoom Accessibility setting on Android mobile devices overrides a website request to prevent zooming. If this setting is enabled when executing an AHTML report on an Android mobile device using Chrome, it interferes with active report functionality, such as FREEZE and manual resizing. The Accessibility setting needs to be disabled for active reports to be fully functional.
Creating an Active Technologies Report
|
Topics: |
|
How to: |
An active report is a self-contained report that is designed for offline analysis.
Procedure: How to Create an Active Technologies Report
With InfoAssist+ in Report mode, you can perform this procedure in Query Design view or Live Preview.
- On the Home tab, from the Format group, click Output File format and click active report.
- Populate the report with your data in one of the following ways:
- Drag the dimension fields and measure fields onto canvas.
- Drag the dimension fields and measure fields into the appropriate field containers in the Query pane.
Active Technologies Report Menu Options
Menu options for an active report are described in the following table.
Note: The following options described in the table require the use of ActiveX controls. Since Microsoft Edge does not support ActiveX technology, these options are not available in that browser:
- Send as E-mail
- Save Changes
- Export to XML (Excel) when active cache is disabled
|
Option |
Definition |
|---|---|
|
Sort Ascending |
Sorts the column in ascending order. |
|
Sort Descending |
Sorts the column in descending order. |
|
Filter |
Filters the data. Options are:
|
|
Calculate |
Calculation types that you can apply to the column:
For numeric fields, you can also apply:
|
|
Chart |
Creates an active chart from the report. Options are Pie, Line, Column, and Scatter. |
|
Rollup |
Lists the fields available to create a table. |
|
Pivot (Cross Tab) |
Lists the fields available to create a Pivot table. |
|
Visualize |
Adds visualization bars to, or removes them from, the selected column. The Visualize option is available for numeric data columns. |
|
Hide Column |
Suppresses the display of the selected column in the report. |
|
Show Columns |
Lists the names of the columns that are hidden in the report, allowing you to individually restore a column. Select the name of a specific column in the hidden columns list to restore that column to the report. |
|
Freeze Column |
Freezes the report at a particular point so that columns to the left of the freeze point remain in view while the user scrolls through the other report columns. Note: If the report can be fully viewed in the browser window, freeze is not applied. The Freeze column option is not available for expandable report (Accordion) views. |
|
Unfreeze All |
Unfreezes the columns. |
|
Grid Tool |
Opens the Grid Tool, which you can use to change the column order, select multiple columns to sort ascending or descending, hide and show columns, add a calculation result to a column, and add subtotals to the active report. |
|
Chart/Rollup Tool |
Opens the Chart/Rollup Tool, which you can use to select multiple group fields to generate the chart or rollup table. The Chart/Rollup Tool contains a list of columns available in the active report to add to Group By and Measure fields. Drag the columns into the field that you want. |
|
Pivot Tool |
Opens the Pivot Tool, which you can use to select multiple group fields to generate the chart or pivot table. The Pivot Tool contains a list of columns available in the active report to add to Group By, Across, and Measure fields. Drag the columns into the field that you want. |
|
Show Records |
Opens the Show Records menu option to list the number of records available for display per page in the report. Select a number (for example, 10) to display, per page. Default displays the number of records (lines) per page that is specified in the WebFOCUS report procedure. |
|
Comments |
Options to display comments under cells or hide indicators for comments in the active report output. |
|
Send as E-mail |
Enables you to save the current state of the active report and send the report as email. Note: To use this feature, you must have ActiveX enabled in your browser security settings. This feature is only supported in Internet Explorer. |
|
Save Changes |
Saves the current state of the active report. When you save an active report using the browser Save as option, the report is saved in its original default state. In the browser Save as dialog box, it is recommended that you select the Webpage, HTML Only save option to ensure that the page is saved properly. Note: To use this feature, you must have ActiveX enabled in your browser security settings. This feature is only supported in Internet Explorer. |
|
Export |
When active cache is enabled, exports all records or filtered only records to HTML, CSV, Excel, or PDF. Note: active cache is enabled on an active report when you click Pages On Demand on the Format tab, in the Navigation group. When active cache is disabled, exports all records or filtered only records to HTML, CSV, or XML (Excel). To use this feature, you must enable ActiveX in your browser security settings. |
|
|
Prints all records or filtered only records. |
|
Window |
Displays reports in a cascade or separate tabs. |
|
Restore Original |
Restores the active report to the default state specified in the report procedure. |
Active Technologies Cell Menu Options
|
Option |
Definition |
|---|---|
|
Drill down |
Enables you to drill down one level in the hierarchy of your data source. This option displays for reports that have Auto Drill enabled. |
|
Drill up |
Enables you to drill up one level in the hierarchy of your data source. This option displays for reports that have Auto Drill enabled. |
|
Restore Original |
Restores the active report to the default state specified in the report procedure. |
|
Auto Links |
Displays a list of target reports that are linked to the Auto Link enabled report. This option displays for reports that have Auto Linking enabled. |
|
Comments |
Enables you to add comments about data in your report. The result is an annotation that displays when you hover over it at run time. |
|
Highlight Value |
Enables you to highlight a particular value in your report. |
|
Highlight Row |
Applies highlighting to the selected row in your report. |
|
Unhighlight All |
Removes any applied highlighting from values or rows in your report. |
|
Filter Cell |
Enables you to filter the output, showing only a selected row of data. |
|
Remove Cell Filter |
Removes any applied cell filters. |
Configuring Active Technologies Report Options
|
Topics: |
You can configure active report options, including menu options, based on user role, through the active report options dialog box.
You can access the dialog box on the Format tab, in the Features group, by clicking the active report options button. The button is available when active report is selected as the output type.
The active report options dialog box contains the following tabs:
- General
- Menu Options
- Colors
- Advanced
General Tab
Use the General tab to set common properties specific to active reports.
The General tab contains the following options:
- Display. This area contains options to set the window
to cascade or tabs, and options to freeze columns.
- Window. Select the window setting. The options are Cascade and Tabs.
- Freeze Columns. Select the columns you would like to freeze. You can also select None.
- Page Options. This area contains options to set the number
of records per page, enable the display of page information, edit
the alignment, and set the location of the page information.
- Records Per Page. Select or type the number of records that you would like to display per page. The default value is 57.
- Display Page Information. Select this option to display page navigation information. Clear this option to disable the display of page navigation information.
- Alignment. Click the appropriate button to set the alignment of the page navigation information. Options are Left, Center, and Right.
- Location. Select the location for the page navigation information. The options are Top Row and Bottom Row.
Menu Options Tab
Use the Menu Options tab to select a user type and which options to display in the menu.
The Menu Options tab contains the following options:
-
User Type. The
options are Power, Analyst, Basic, and Custom.
- Power. This is the default user type. It enables all functionality.
- Analyst. This user type has the following functionality: Show Records, Freeze, Hide/Unhide, Export, Sorting, Pivot, Filter, Calculations, Chart, Visualize, Restore Original, Save Changes, and Accordion.
- Basic. This user type has the following functionality: Show Records, Freeze, Hide/Unhide, Sorting, Filter, Calculations, Visualize, and Restore Original.
- Custom. If you select a combination of options that does not match one of the existing user types (Power, Analyst, Basic), the User level name that appears in the User Type field is Custom. This is not a default user type or a selectable user type. It indicates that options for this user do not match any of the existing user types.
The options available according to user type include the following:
- Show Records. Shows all records or specific numbers of records.
- Freeze. Freezes and unfreezes columns.
- Hide/Unhide. Hides and shows columns.
- Export. Exports data to HTML, CSV, Excel, or PDF if active cache is enabled, or to HTML, CSV, or XML (Excel) if active cache is disabled.
- Sorting. Sorts data in ascending or descending order.
- Pivot. Lists the fields available to create a Pivot table.
- Window Type. Shows windows as cascade or tabs.
- Send as Email. Enables you to save the current changes and send a report as email.
- Print. Prints all records or filtered-only records.
- Advanced Tools. Accesses the Chart/Rollup, Pivot, and Grid Tools.
- Filter. Opens the Filter Selection dialog box.
- Calculations. Performs the following calculations: Sum, Avg, Min, Max, Count, Distinct, % of Total.
- Chart. Converts a report to a pie, line, bar, or scatter chart.
- Visualize. Adds data visualization bars to a report.
- Rollup. Performs rollup on data.
- Comments. Adds comments.
- Restore Original. Restores the active report to the default state specified in the report procedure.
- Save Changes. Saves the current changes.
- Accordion. Produces accordion reports.
- Grid Tool. Opens the Grid Tool dialog box.
Colors Tab
Use the Colors tab to select colors for various objects on the report.
The Colors tab contains the following options:
Page. This area contains options to set the colors for the font and background of the page text.
- Font. Opens the Color dialog box, where you can select the font color.
- Background. Opens the Color dialog box, where you can select the background color for the page text.
Row Selection. This area contains options to set the colors that appear when you point to or select a row on the report.
- Hover. Opens the Color dialog box, where you can select the color that the row becomes when you hold the mouse over the row.
- Selected. Opens the Color dialog box, where you can select the highlight color that the row becomes when you use the highlight option.
Visual. This area contains options to set the colors for the data visualization bars.
- Positive. Opens the Color dialog box, where you can select the color for a data visualization bar that represents a positive number.
- Negative. Opens the Color dialog box, where you can select the color for a data visualization bar that represents a negative number.
Calculations. This area contains options to set the colors for values in a calculation.
- Font. Opens the Color dialog box, where you can select the font color for the calculation.
- Background. Opens the Color dialog box, where you can select the background color for the calculation.
Menu. This area contains options to change the color of the menu.
-
Normal
- Font. Opens the Color dialog box, where you can select the color for the text of the options on the column menus.
- Background. Opens the Color dialog box, where you can select the background color for the column menus.
- Border. Opens the Color dialog box, where you can select the color for the border of the column menus.
-
Hover
- Font. Opens the Color dialog box, where you can select the color for the text of the options on the column menus when you point to them.
- Background. Opens the Color dialog box, where you can select the background color that appears behind options on the column menus when you point to them.
Advanced Tab
Use the Advanced tab to control the number of rows retrieved from active cache and to add security settings.
Note: Active cache is enabled when you select active report as the output type, and click Pages On Demand on the Format tab, in the Navigation group.
The Advanced tab contains the following options:
active cache. Enables a report to cache the data in a binary file and return the data to the output window in pre-set increments.
- Rows Retrieved. Select the number of rows retrieved in the output. The default value is 100.
Security. This area allows you to set a password to access the report and enable expiration by date or by days.
Note: When setting security options for active reports, be aware that security options can be set for each individual component on the canvas, but only one password can be set for the entire document.
Creating an Active Technologies Chart
|
Topics: |
|
How to: |
An active chart is a chart that is designed for offline analysis. For more information, see Active Technologies Report Overview.
Procedure: How to Create an Active Technologies Chart
With InfoAssist+ in Chart mode, you can perform this procedure in Query Design view or Live Preview.
- On the Home tab, from the Format group, click Output File format and click active report.
- On the Format tab, in the Chart Types group, click the button of the chart that you want to create. Bar chart is the default.
The chart appears on the canvas.
- Populate the chart with your data in one of the following ways:
- Drag the dimension fields and measure fields onto the chart.
- Drag the dimension fields and measure fields into the appropriate field containers in the Query pane.
Active Technologies Options for Charts
Menu options for an active chart are described in the following table.
Note: For charts that employ the new attribute syntax, only the following four icons display: More Options, Advanced Chart, Original Chart, and Aggregation. If you have applied a filter, the Remove Filter icon displays.
|
Option |
Definition |
|---|---|
|
More Options  |
New. Creates a new instance of the chart. This option is available only when the chart is created from a column menu on a tabular report. |
|
Group By (X). Changes groups by the horizontal sort field. |
|
|
Add (Y). Adds a vertical sort field. |
|
|
X-Axis. Specifies a measure or dimension sort field. Applies to scatter charts. |
|
|
Y-Axis. Specifies a measure. Applies to scatter charts. |
|
|
Arrange By. Specifies the marker color. The marker color depends on the field assigned to the color attribute. If no field is assigned to this category, then all of the markers will be the same color. Applies to scatter charts. |
|
|
Export to. Exports to Excel, Word, or PowerPoint. |
|
|
Stacked. Stacks the risers on top of each other, with the length of each riser representing the data value. Applies to column charts. |
|
|
Top. Displays the top values. Options are Top 3, Top 5, Top 10, and Clear Top. Applies to pie charts. |
|
|
Trend. Draws a trendline and equation label for an individual series. Applies to scatter charts. |
|
|
Chart/Rollup Tool. Opens the Chart/Rollup Tool, which you can use to select multiple group fields in the chart or rollup table generated. The Chart/Rollup Tool contains a list of columns available in the active report and Group By and Measure sort fields. Drag the columns into the desired sort field. Note: When working with the Chart/Rollup Tool for active charts (specifically those with the new chart attribute syntax), the Series tab is not supported. It is available with charts that are created with tabular reports or stand-alone charts that do not use the new chart attribute syntax. |
|
|
Restore Original. Restores the active report to the default state specified in the report procedure. |
|
|
Column  |
Displays data as a column chart. |
|
Pie  |
Displays data as a pie chart. |
|
Line  |
Displays data as a line chart. |
|
Scatter  |
Displays data as a scatter chart. |
|
Rollup  |
Displays the chart as a rollup table. |
|
Advanced Chart  |
Opens the Chart/Rollup Tool. |
|
Original Chart  |
Restores the active chart to the chart type specified in the report procedure. |
|
Lock/Unlock  |
Freezes the chart or rollup table. You can link or unlink a chart or rollup table to the filters that you have applied in your report using the Freeze Chart or Freeze Rollup icon. The icon indicates whether the report is linked to the filter (Freeze Chart or Freeze Rollup) or not (Unfreeze Chart or Unfreeze Rollup). This option is available only when the chart is created from a column menu on a tabular report. |
|
Aggregation  |
Applies the following options to a Measure field: Sum, Avg, Min, Max, Count, and Distinct. The default value is Sum. |
|
Remove Filter  |
Removes a filter from a chart. You can apply a filter by pointing to or lassoing an area of the chart and then clicking the Filter Chart or Exclude from Chart option from the chart tooltip. |
Creating an Active Technologies Dashboard
|
Topics: |
|
How to: |
You can create an active dashboard by inserting multiple content types, such as reports, charts, images, and text, into a document. An active dashboard will run any report or chart using the active output format, even if the report or chart itself is not in active output format.
You can also insert active dashboard prompts into a document to act as filters for the reports and charts on the dashboard. You can cascade (chain) prompts to populate them based on the selections from the previous prompts.
The output format of the active dashboard must be active report in order to add active dashboard prompts.
Active Technologies Dashboard Prompts
The Active Dashboard Prompts group contains buttons that insert active dashboard prompts into your dashboard. This group is only visible when the output format of the dashboard is set to active report. You can access the active dashboard prompts on the Insert tab, in the active dashboard prompts group.
The following are the types of active dashboard prompts that you can use to apply filters to an active dashboard:
- Drop Down. Inserts a drop down prompt placeholder in the upper-left corner of the canvas.
- List. Inserts a list prompt placeholder in the upper-left corner of the canvas.
- Checkbox. Inserts a check box prompt placeholder in the upper-left corner of the canvas.
- Radio Button. Inserts a radio button prompt placeholder in the upper-left corner of the canvas.
- Text. Inserts a text area prompt placeholder in the upper-left corner of the canvas.
WF_RETAIL1
WF_RETAIL2
WF_RETAIL3
Target Reports
When you bind a field to an active dashboard prompt, the default target report is the report from which you dragged the field. You can add or remove target reports from an active dashboard prompt through the active dashboard properties dialog box. For more information on using the active dashboard properties dialog box, see Using Multiple Reports as Targets and Sources.
A report must meet one of the following requirements to be a target report:
- The report must contain a field with the same name as the source field (actual field name or AS name).
- The Master File of the report must contain a field with the same name as the source field.
If a report is eligible to be a target report because the field has the same user-supplied title and the title is changed, the report is automatically removed as a target.
Procedure: How to Add an Active Technologies Dashboard Prompt to a Dashboard
This procedure describes how to begin to create a dashboard by creating one report and binding a single prompt to one of the fields of the report.
With InfoAssist+ in Document mode:
- On the Home tab, from the Format group, click Output File format and click active report.
- On the Insert
tab, in the Reports group, click Report.
A placeholder appears on the canvas.
- Drag fields onto the canvas, or into the Query pane, to create the report and start building the dashboard.
- On the Insert
tab, in the active dashboard prompts group, select a dashboard prompt
to insert into the document.
An active dashboard prompt appears in the upper-left corner of the canvas. If the report is located in the upper-left corner of the canvas, you will have to drag the prompt off of the report.
- Select the report and bind one of its
data source fields to the prompt in one of the following ways:
- Query pane: Select the report. From the Query pane, drag the field that you want to bind onto the prompt.
- Report on the canvas: Click the report on the canvas. You can now edit it. Highlight the column that contains the data that you want and drag it onto the prompt.
Once you have bound the field to the prompt, the values of the field appear in the prompt.
Note: Once an active dashboard prompt is added to the canvas, the document is locked in an active output format. You cannot change the active report format if there are prompts present on the canvas. To switch to a non-active output format, you must remove all prompts.
Using Multiple Reports as Targets and Sources
|
How to: |
You can add multiple reports and charts to an active dashboard. Each report can have multiple prompts associated with it.
Procedure: How to Build a Dashboard With Multiple Reports as Targets and Sources
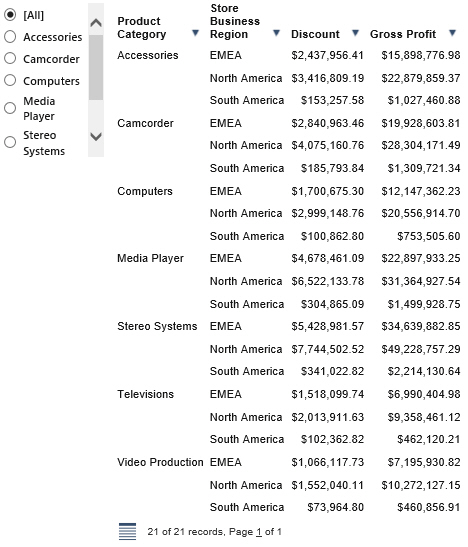
The following procedure describes how to set up active dashboard prompts for two reports on a dashboard. In the example that is used, the first report contains information about the categories of electronics products sold in various regions. The Product,Category field will be bound to a group of radio buttons. Each radio button will represent a particular product category of electronics. When you select a radio button for a product category, for example, Accessories, the report will be filtered by your selection.
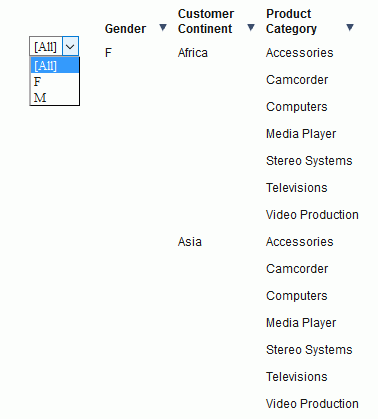
The second report contains information about the gender and geographic location of electronics consumers. The Gender field will be bound to a drop-down list. The list will display the values, F (female) and M (male). When you select a gender from the drop-down list, the report will be filtered by your selection.
- Open InfoAssist+ in Document mode using the wf_retail_lite Master File.
- Create an active dashboard by adding two reports with the following components, respectively:
Report 1:
- Product,Category
- Store,Business,Region
- Discount
- Gross Profit
Report 2:
- Gender
- Customer, Continent
- Product, Category
- On the Insert tab, in the Active Dashboard Prompts group, add the following active dashboard prompts to the dashboard, positioning
them relative to each respective report.
- Radio Button: This prompt will be used for Report1.
- Drop Down: This prompt will be used for Report2.
For more information on working with active dashboard prompts, see How to Add an Active Technologies Dashboard Prompt to a Dashboard.
- Right-click
the radio button active dashboard prompt for which you want to bind a field to and click Properties.
The active dashboard properties dialog box opens.
The Prompts list displays the two prompts (for example, radiobutton_1 and radiobutton_2) that were added to the dashboard in step 3.
- From the
Report drop-down menu, select the report that contains the field
to which you want to bind an active dashboard prompt.
In this example, the radio button list (radiobutton_1) has been selected as the prompt for the region report (Report1), as shown in the following image.
The next step describes how to bind the Product,Category field from the region report to the radio button list to filter that report.
- From the
Field drop-down menu, select the field to which you want to bind
the active dashboard prompt.
In this example, the Product,Category field has been selected for the radio buttons list (radiobutton_1), as shown in the following image.
Note: You can optionally specify an ascending or descending sort order for the current scenario.
- Click OK.
The prompt is now bound to the field on the dashboard.
In the following image, the radio buttons list is bound to the Product,Category field. It displays all product categories by which a user can filter the report.
The following steps describe how to bind the Gender field in the gender report (Report2) to the drop-down list prompt.
- Right-click
the Drop Down active dashboard prompt for which you want to bind a field
and click Properties.
The active dashboard properties dialog box opens again.
Notice that combobox_2, the prompt selected on the dashboard, is selected in the Prompts list.
- From the
Report drop-down menu, select the report (Report2) that contains the field
to which you want to bind an active dashboard prompt.
The next step describes how to bind the Gender field from the gender report to the drop-down list to filter that report.
- From the
Field drop-down menu, select the field (Gender) to which you want to bind
the active dashboard prompt.
Once the Gender field has been selected, Report2 (gender report) appears in the Targets list and Report1 (region report) appears in the Candidate Reports list.
Note: To move a report from the Candidate Reports list box to the Targets list box, select it and click the Add to List arrow. To remove a report from the Targets list box, select it and click the Remove from List arrow. You can select multiple reports by holding down the Ctrl key and clicking each one.
- Click OK.
The prompt is now bound to the field on the dashboard. You can now filter the gender report by female or male, as shown in the following image.
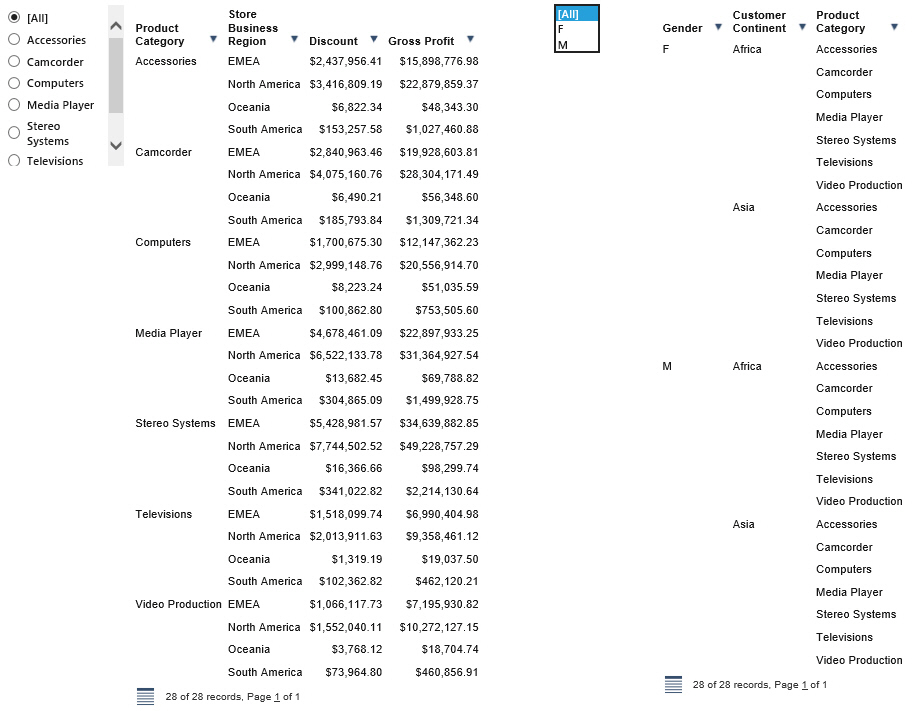
The final active dashboard displays, as shown in the following image.
Procedure: How to Change the Field
You can change the field to which the active prompt is bound.
- Create an active dashboard in Document mode, or open an existing dashboard, and bind an active prompt to a field.
- Right-click
the active dashboard prompt that you want to configure, and click Properties.
The active dashboard properties dialog box opens.
- From the
Field menu, select a different field.
A warning message alerts you that changing the source field for the prompt will remove the existing prompt and any dependent (child) prompts from the cascades.
- Click OK to close the warning.
- Click OK to
close the active dashboard properties dialog box.
The active dashboard prompt is updated with the new source field.
Procedure: How to Change the Filter Condition
- Create an active dashboard in Document mode, or open an existing dashboard, and bind an active dashboard prompt to a field, as described in How to Add an Active Technologies Dashboard Prompt to a Dashboard.
- Right-click
the active dashboard prompt that you want to work with, and from
the shortcut menu, select Properties.
The active dashboard properties dialog box opens.
- From the Condition drop-down menu, select the filter condition for the active dashboard prompt. The options are Equal to, Not equal to, Less than, Less than or equal to, Greater than, and Greater than or equal to.
- Click OK.
The filter condition is applied to the active dashboard prompt.
Procedure: How to Add Multiple Prompts to a Dashboard
- Create an
active dashboard in Document mode, or open an existing dashboard
containing at least one report, and add at least two active dashboard
prompts, as described in How to Add
an Active Technologies Dashboard Prompt to a Dashboard.
- Bind the
fields to prompts that you have added, as described in How to Add
an Active Technologies Dashboard Prompt to a Dashboard.
Procedure: How to Cascade Prompts
When you have more than one prompt on the canvas, you can cascade prompts to populate them based on the selections of the previous prompts. Cascading prompts have a parent-child relationship, in which the parent filters the available options of the child.
An active prompt can be the parent of more than one other prompt, but cannot be a child of more than one prompt.
- Create an
active dashboard in Document mode, or open an existing dashboard,
and bind at least two active prompts to fields.
- Right-click
the active dashboard prompt that you want to configure, and click Properties.
The active dashboard properties dialog box opens.
- Click Cascades.
By default, a cascade named Cascade1 appears in the Cascades section of the active dashboard properties dialog box.
- You can click the Create
a new cascade
 button
to create a new cascade.
button
to create a new cascade.
- You can click the Delete
selected cascade
 button
to delete the selected cascade.
button
to delete the selected cascade.
- You can click the Create
a new cascade
- Select the cascade to which you want to add prompts.
- From the Available Prompts list box, select the prompt that you want to add.
- Click the Add
to List arrow to move the selected prompt to the Selected
Prompts list box.
Note: You can remove prompts from the Selected Prompts list box by selecting them and clicking the Remove from List arrow.
- Add any
additional prompts you want to be part of the cascade by repeating
steps 5 and 6.
By default, the hierarchy of the prompts is determined by the order in which they are added to the Selected Prompts list. The cascade of the prompts is from top to bottom. The prompts that come first in the Selected Prompts list are the parents of the lower prompts.
- You can change the hierarchy of the prompts by selecting a prompt in the Selected Prompt list box and clicking the Move Up and Move Down arrows.
- Click OK.
The cascade is created.
- Run the
report.
Note: If you set up more than one cascade, the cascade that you interact with last is the one that filters the report.
| WebFOCUS | |
|
Feedback |