Creating Customized Report Outputs
|
How to: |
You can create customized report outputs in . The standard output formats, which are found in the Format group on the Home tab, include: HTML, active report, PDF, active PDF, Excel, and PowerPoint. For charts, HTML5 is the default output format. For reports, you can also create the following custom report output formats from the Navigation group on the Format tab, including: Table, Table of Contents, Freeze, Pages on Demand, and OLAP.
- Table. Generates standard browser output. This is the default.
- Table of Contents. Generates
output by displaying a table of contents icon in the upper-left
corner where report output typically appears. Clicking Table
of Contents opens a menu that enables you to select (view)
individual values of the first Sort By (By) field, one value at
a time.
You can also select options to view the entire report or remove the table of contents. For more information, see How to Create Table of Contents Reports.
Note:- The Table of Contents option is activated only when HTML, active report, Excel, or PowerPoint output format is selected.
- You cannot use the Table of Contents option with the Accordion feature. For more information, see How to Create Accordion Reports.
- Freeze. This HTML feature has been upgraded to work well in the new responsive portal and other web components. The Freeze option allows you to define a scroll area within the data of your report. It locks the headings and footings in place, enabling you to scroll through the data within the container. For more information, see How to Freeze Column Titles in a Report.
- Pages On Demand. Provides
access to two distinct features depending upon the output type that
you have selected.
- HTML. If you
select this output type, and click Pages On Demand,
then the report opens in the WebFOCUS Viewer.
The WebFOCUS Viewer saves the bulk of your report to your web server and delivers one page of report output at a time, decreasing the amount of time that you wait for the report to process.
The bulk of your report remains on the web server until you request it or close the WebFOCUS Viewer.
The WebFOCUS Viewer menu bar, at the bottom of the Viewer, contains options for navigating through the pages. For more information on these options, see How to Create Pages on Demand Reports.
- active reports. If you select this output type, and click Pages On Demand, then active cache is enabled. For more information on active cache, see Active Cache Option.
- HTML. If you
select this output type, and click Pages On Demand,
then the report opens in the WebFOCUS Viewer.
- OLAP. To
view output with OLAP functionality. For more information, see How to Create
OLAP Reports.
Note: This functionality is disabled by default. It can be enabled in the Administration Console. Contact your administrator for assistance.
Procedure: How to Create Table of Contents Reports
Note: You cannot use the Table of Contents with the Accordion feature.
- Create a report.
- On the Format tab, in the Navigation group, click
Table of Contents.
When you run the report, a table of contents button appears in the top-left corner of the report output, as shown in the following image.
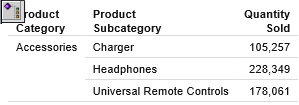
- Double-click the button to display the Table of Contents menu.
The Table of Contents menu enables you to select and view individual
values of the first sort (By) field, one value at a time.
Drag the Table of Contents menu in any direction to view the report output, which appears behind the menu by default.
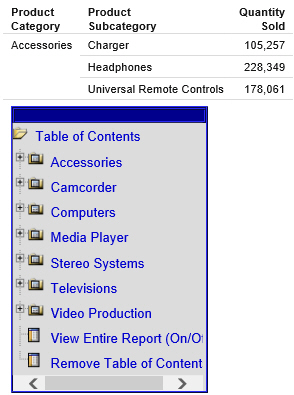
Select a sort field to view values for that field.
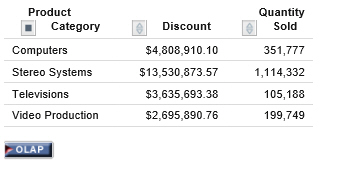
In the following example, clicking Stereo Systems displays the corresponding report output.
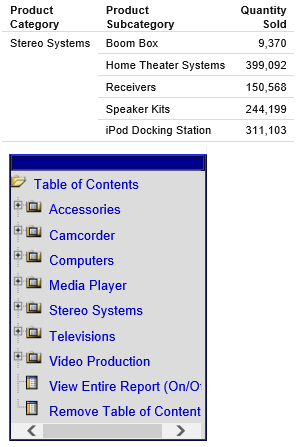
You can also select options to view the entire report or remove the table of contents.
Procedure: How to Freeze Column Titles in Reports
On the Format tab, in the Navigation group, click Freeze.
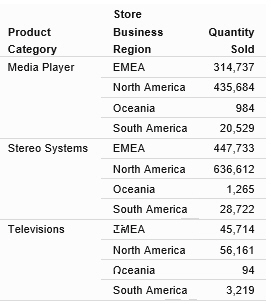
Column titles freeze (remain in view) when you scroll through pages of the report output.
Note: You must run the report in order to see the frozen column titles.
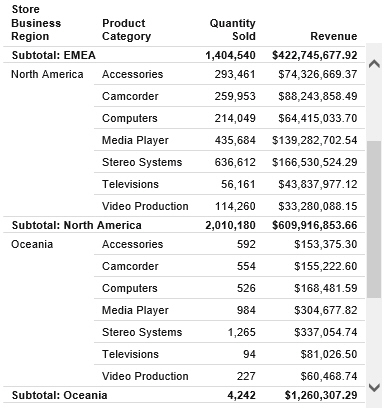
The following image shows the scroll bar that appears when you freeze column titles.
Procedure: How to Create Pages On Demand Reports
This procedure describes using the Pages On Demand feature to create an HTML report.
- Create a
report.
The default output is HTML.
- On the Format tab, in the Navigation group, click Pages On Demand.
- Run the
report.
The report opens in the WebFOCUS Viewer.
- Navigate through the report using the navigation options available on the WebFOCUS Viewer menu bar. For example, Go to the first page.
Procedure: How to Create OLAP Reports
- On the Format tab, in the Navigation group, click the OLAP Analysis button, which enables the OLAP Analysis functionality.
- On the OLAP Analysis button, click the down arrow.
The OLAP Analysis menu displays. It contains the following options:
- OLAP panel accessible. Select this option to access the OLAP panel in the output of the report at run-time. You can access the OLAP panel by clicking on one of the categories that displays at the top of the report.
- OLAP panel not accessible. Select this option to only display sorting options in the column titles. The OCP (OLAP ribbon) cannot be accessed from the title options.
- Dimension filtering enabled. Select this option to display dimension filters at the top of the report. You customize the filter placement within the Navigation dialog box. You access the dialog box by clicking More options.
- Dimensions grouped in tabs. Select this option to group dimension filters in tabs based on hierarchy within statements in the metadata.
- More options. Select this option to open the OLAP Analysis
dialog box.
In addition to the options discussed previously, the OLAP Analysis dialog box allows the following additional configuration and customization options for OLAP output:
- No OLAP. Select this option to disable OLAP Analysis.
- OLAP panel is accessible. Select this option to make the OLAP panel accessible. This option is selected by default.
- OLAP panel is not accessible. Select this option to make the OLAP panel inaccessible.
- Hide access to the OLAP Panel. Select this option to hide access to the OLAP panel.
- Dimension filtering enabled. This option provides a secondary positioning
option allowing placement of the filters on the Top (default) or
Bottom of the report.
Note: If the Dimension filtering enabled option is cleared at any time, the position option resets to Top.
- Auto drill options. The auto drill options are:
- Dimensions. Select this option to automatically drill down on dimensions in both reports and graphs.
- Dimensions and Measures. (Default). Select this option to automatically drill down on dimensions in both reports and graphs and on measure fields in reports.
- None. Select this option to disable automatic drill downs.
- Select an option.
Selecting an option from the OLAP options group, such as OLAP panel accessible, generates output that invokes OLAP processing. The OLAP button displays below the report. When clicked, the OLAP Control Panel is launched.
Procedure: How to Create Accordion Reports
Note: You cannot use the Table of Contents in conjunction with the Accordion feature.
- Create a
report.
The following image shows a report before the accordion option is applied.
- On the Format tab, in the Features group, click Accordion and
then click Run.
Plus signs indicate that there are expandable views of data for each vertical sort field.
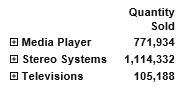
You can manually expand your view to expose the data.
Procedure: How to Implement Stack Measures
- Create a report with at least two measure fields.
- On the Format tab, in the Features group,
click Stack Measures.
All measure fields in the report are stacked. For more information on Stacked Measures, see the Stacking Columns topic in the Creating Reports With WebFOCUS Language manual.
| WebFOCUS | |
|
Feedback |