Stress Testing a Procedure
|
Topics: |
Stress testing enables you to simulate request execution in order to ensure that the server will retrieve data satisfactorily under specified conditions.
The mechanism behind stress testing is a record and playback feature in which the exact sequence of user actions applied through a browser are recorded and then reproduced (played back), simulating a single user or multiple users under the same or different conditions. You can use the generated files and the recorded sequences, known as HTI scripts, along with server traces, to test new configurations, and to diagnose problems.
From the Web Console Playback of HTI Scripts pane, you can initiate test runs under the following separate and combined conditions:
- Requests run simultaneously by a number of users (expressed as threads). You can retest using a variety of scenarios. This features enables you to determine in advance the system ability to grow (that is, its scalability).
- Requests executed at varying intervals. This feature enables you to determine in advance the ability of the system to adjust to increases in workload.
In addition to these basic tests, you can specify a number of advanced conditions to refine the diagnostic process. For example, stress testing generally provides information about the retrieval performance of the Reporting Server going against one or more data sources (also called back end processing). If, however, you are working in a client environment like WebFOCUS, you may wish to test data retrieval performance beginning at a user browser, going through a Web server (front end processing), to the Reporting Server to the data source. You can request that the test be redirected to the Web server to track retrieval over the longer path. Then, by comparing back end test results with front end test results, you can more accurately diagnose the origin of a performance problem based on any other conditions you specify.
For a full list of the basic and advanced stress test conditions you can apply, see Parameters for Playback of HTI Script Files.
Recording User Actions Into a Script Using Run Stress
|
How to: |
The server recording feature can record the exact sequence of user actions applied through a browser into a script. The script can then reproduce that sequence (play it back), simulating single or multiple users under varying conditions to produce execution statistics.
The Run Stress feature uses an existing procedure to produce the script. It also changes the browser session to the Diagnostics Scalability Playback Start/Stop page for the script.
The files used by playback and the recorded sequences are known as HTI scripts and are saved in the scalability directory. The scripts can be used along with server traces for problem diagnostics, analysis, and testing.
You can go back to the Diagnostics Scalability Playback page at any time off the main menu and create a new script by recording a session activity (top menu bar) or an edit session (top menu bar) plus edit or re-run an existing script.
Procedure: How to Run a Stress Test
You can run a stress test on a procedure from the Web Console.
- From the Web Console
sidebar, click Applications, or from the
Data Management Console, expand the Server node folder.
On the Web Console, the Applications page opens.
- Expand an application folder.
- Right-click a procedure,
point to Run Advanced, and click Run
Stress.
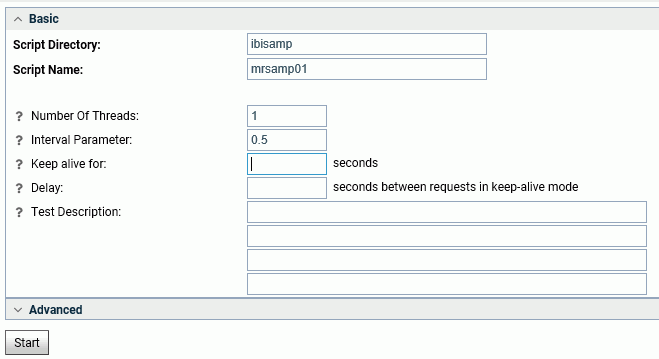
The Playback of HTI Script Files dialog box opens, as shown in the following image.

- Enter basic test conditions: Number of Threads, Interval Parameter, and a Test Description. Click Advanced if you wish to specify additional conditions.
- Click Start.
Results are displayed in a separate window. For an illustration,
see Sample Stress Test Log.
The script is listed under the tested procedure in the directory C:\ibi\scale.
- Open the Performance
Reports folder on the Playback navigation pane and choose:
- Basic Report
- Extended Report
-
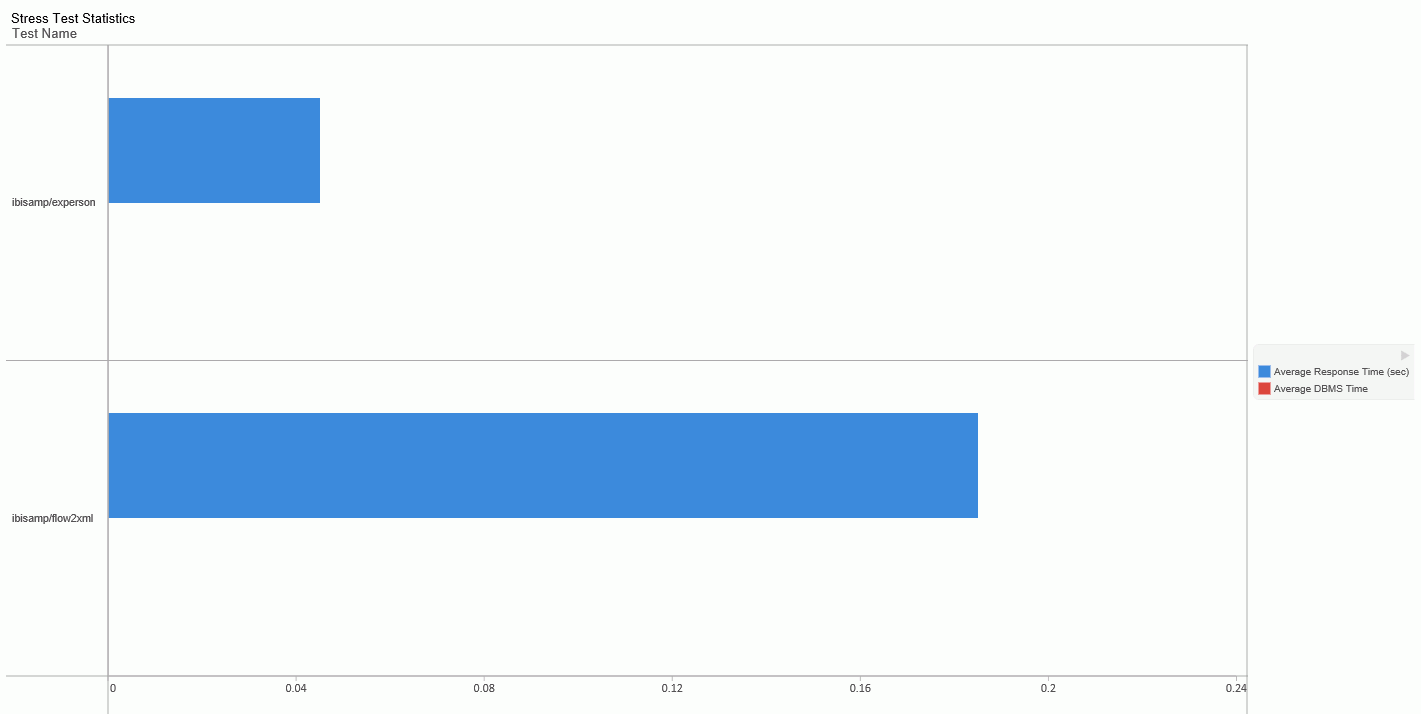
Graph Report
Select View to view the report or Open to see the report or the Metadata, Query, and Output panes for the report.
Example: Sample Stress Test Log
---- Started at 13:39:09 ----

Received: thread=01 request=0001; timing: resp=0.052 sec, transf=0.000 sec, start=03/27/2018 13:39:09.795; dbmstime=0.000 sec, servertime=0.052 sec

---- Finished at 13:39:09 ----

Total Execution Time:                    0.115 sec
Total Number of Threads:                 1
Interval Parameters:                     500,-1,-1,-1
Minimum Execution Time of Thread:        0.109 sec
Maximum Execution Time of Thread:        0.109 sec
Average Execution Time of Thread:        0.109 sec

Total Number of Requests:                1
Average Server Response:                 0.052 sec of total 1 requests
Average Data Transfer Time:              0.000 sec of total 0 requests
Average Processing Time:                 0.052 sec of total 1 requests
Standard Processing Deviation:           0.000 sec
Minimum Processing Time:                 0.052 sec
Maximum Processing Time:                 0.052 sec
Average DBMS Time:                       0.000 sec of total 1 requests
Minimum DBMS Time:                       0.000 sec
Maximum DBMS Time:                       0.000 sec
Average Server Time:                     0.052 sec of total 1 requests
Minimum Server Time:                     0.052 sec
Maximum Server Time:                     0.052 sec

terminating main thread
Sample Performance Reports
Basic Report

Extended Report

Graph Report

| WebFOCUS | |
|
Feedback |