Customizing Reports
|
Topics: |
You can customize reports using the various options on the Layout tab and Field tab.
- Cell Padding. Opens the Cell Padding dialog box, where you can set specific values to control the amount of space inserted between rows and columns in a report. For more information, see How to Use Cell Padding in a Report.
- AutoFit. Limits the width of columns in a report to be no wider than the largest value in each column. When additional fields are added, the report automatically grows at design time. AutoFit Column is selected, by default.
- Page Break. Starts a new page when the primary sort field changes. Clicking the drop-down icon enables you to select Reset Page Numbers, which allows you to reset page numbers on a page break to start at 1.
- Line Break. Inserts a line in the report output when the primary sort field changes.
- Sub Header. Opens a dialog box where you can type text to add a subheading just below the column titles in the report output when the primary sort field changes.
- Sub Footer. Opens a dialog box where you can type text to add a subfooting at the end of the data on each page of the report output when the primary sort field changes.
- Subtotal. Inserts a line, total text (TOTAL FIELD Value), and subtotals for all numeric fields when the primary sort field changes.
The drop-down menu on the Field tab, in the Format group provides three field-type options for the selected column, which are Alphanumeric, Integer, and Decimal. Selecting the fourth option, More options, opens the Field Format Options dialog box, which provides further formatting options for the selected field. For more information, see Changing a Field Format.
You can also apply floating and non-floating currency symbols, percent signs, and commas. You can increase and decrease decimal places by clicking the appropriate buttons under the drop-down menu.
The Currency button is a split button that turns the currency symbol on or off. Click the Currency button to turn on the default floating currency option. Click the Currency button a second time to turn off the floating currency option.
To turn on the non-floating currency option, open the drop-down menu and select Non floating currency. To turn off the non-floating currency option, click the Currency button.
The following options on the Field tab, in the Display group:
- Hide Field. Allows you to hide a selected field.
- Hide Missing. Allows you to hide fields that have no value.
-
Aggregation. Opens a drop-down menu of the
following options:
- None (default)
- Sum
- Average
- Count
- Count Distinct
- Percent of Count
- Distinct Values
- First Value
- Last Value
- Maximum
- Minimum
- Total
- Percent
- Row Percent
- Median
- Average Square
Sum is the default aggregation type value for all numeric fields added to the Measure Query field container in the Query pane. Changing the Measure Query field container from Sum to Print, Count, or List overrides all assigned aggregation type values. For more information related to charts, see How to Display Aggregations on Measure Data.
-
Traffic
Lights. Opens the Traffic Light Condition dialog box. From this
dialog box you can do the following:
- Add new conditional styling by applying traffic light (and other) colors to a selected field in the output when the field meets specified criteria
- Modify existing conditional styling
- Enable conditional drilldowns
For more information related to reports, see Styling Reports. For more information related to charts, see Traffic Light Condition Dialog Box.
- Data Bars. (Reports only.) Adds a data visualization column to the right of a selected numeric field. The column displays values in each row using horizontal bars that extend from left to right in varying lengths, depending on the corresponding data values.
- Within. Allows you to use specific aggregation tasks at different report levels. You can use the Within phrase to manipulate display field values as they are aggregated within a sort group rather than a report column.
- Column(s). Allows you to indicate the number of columns in which you wish to display multiple graphs. The value can be between 1 and 512. The default is 1. This option is also available from the Query pane shortcut menu for a Multi-graph component.
Styling Reports
You can apply custom styling to specific areas of a report. When creating a report, you can perform the following styling customization.
- Global styling for the entire report.
- Style data and column titles.
- Style headings and footings. For more information, see How to Style Headings and Footings in a Report.
- Style the rows of data with alternating colors. For more information, see How to Style Rows of Data With Alternating Colors in a Report.
- Apply traffic light conditional styling to data. For more information, see How to Apply Traffic Light Conditional Styling to a Report (By Constant) and How to Apply Traffic Light Conditional Styling to a Report (By Field).
- Increase or decrease the amount of space inserted between rows and columns. For more information, see How to Use Cell Padding in a Report.
Procedure: How to Apply Styling to an Entire Report
- Create a report, or open an existing report.
- On the Home tab, in the Report group, click Style.
The Report Style dialog box opens.
- Select any of the following styling options that are
available in the Style group.
- Font. Opens a drop-down list, which you can use to change the font.
- Font size. Opens a drop-down list, which you can use to change the font size value.
- Bold. Applies bold font formatting to the selected text.
- Italic. Applies italic font formatting to the selected text
- Underline. Underlines the selected text.
- Justify Left. Aligns the text to the left of the canvas.
- Justify Center. Aligns the text to the center of the canvas.
- Justify Right. Aligns the text to the right of the canvas.
- Font color. Opens the Color dialog box, where you can select the font color.
-
Background color. Opens the Color dialog box, where you
can select the background color for the report.
Note: If you have chosen to specify a color, you must click OK to return to the Report Style dialog box.
- Currency Symbol. Opens a drop-down menu, from which you can choose a currency symbol. Options are US dollar, British pound, Japanese yen, euro, new Israeli shekel.
- Reset to Quick Styles from Template. Resets all settings to the default settings from the template.
Note: Reset only works while the Report Style dialog box is open. Once you click OK, all changes are committed. To undo global styling after it has been committed, you must use the Undo command on the Quick Access Toolbar.
Preview. Displays the text as you have formatted it.
- Click OK. The report is styled accordingly.
Procedure: How to Perform Field-Level Styling in a Report
You can style data, column titles, or both, in the report output for the selected data source field.
- Create a report.
- In the Query pane, select a data source field.
The Field tab appears on the ribbon.
- In the Style group, click one of the following:
- Data Style. Styles only the data for the selected data source field.
- Title Style. Styles only the column title for the selected data source field.
- Data + Title. Styles both the data and the column title for the selected data source field.
- Select any of the following styling options that are
available in the Style group.
- Font. Opens a drop-down list, which you can use to change the font.
- Font size. Opens a drop-down list, which you can use to change the font size value.
- Font color. Opens the Color dialog box, where you can select the font color.
-
Reset to Quick Styles from Template. Resets all settings
to the default settings from the template.
Note: Reset only works while the Report Style dialog box is open. Once you click OK, all changes are committed. To undo global styling after it has been committed, you must use the Undo command on the Quick Access Toolbar.
- Bold. Applies bold font formatting to the selected text.
- Italic. Applies italic font formatting to the selected text
- Underline. Underlines the selected text.
- Justify Left. Aligns the text to the left of the canvas.
- Justify Center. Aligns the text to the center of the canvas.
- Justify Right. Aligns the text to the right of the canvas.
-
Background color. Click the button to open the Color
dialog box, where you can select the background color for the report.
Note: When working with font or background colors, you must click OK on the Color dialog box to return to the Report Style dialog box.
- Click OK. The report is styled accordingly.
Procedure: How to Add Headings and Footings to a Report
You can make a report more meaningful by adding headings and footings. Headings and footings supply context and key information about a report, such as its purpose and audience. Headings and footings also provide structure, helping you navigate to the detail sought. They enhance visual appeal.
In this procedure, you will add and style a report heading and page heading. The procedure uses sample values, but you can supply values that apply to your own, reports.
Headings and Footings are available in Query Design view, Live Preview, and Document view.
- Create a report.
- On the Home tab, in the Report group,
click the Header & Footer button.
The Header & Footer dialog box opens.
- Click the tab for the heading or footing element that
you want to add.
For a report, you can add a report heading, page heading, page footing, or report footing. By default, the Report Header tab is selected. In this procedure, accept the default.
- Click inside the design area of the dialog box, and type
the text for the heading.
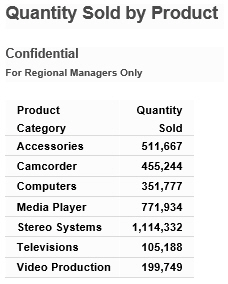
For example, the text for a sample report heading might be Quantity Sold by Product.
- Using the styling ribbon, apply styling to the report
heading text.
For example, click HELVETICA from the Font drop-down list. From the Font size drop-down list, click 12.
The sample report heading with the selected styling values is shown in the following image.
- Click Apply to save the changes you have made so far, without closing the dialog box.
- To add a page heading, click the Page Header tab.
In this procedure, you are going to add one of the supplied quick text options.
- Click the last icon
 (Insert
preformatted text content for headers/footers) on the
right of the styling ribbon, and click Confidential in
the list.
(Insert
preformatted text content for headers/footers) on the
right of the styling ribbon, and click Confidential in
the list. - Change the font and font size. For example, change the
font to HELVETICA and the size to 10.
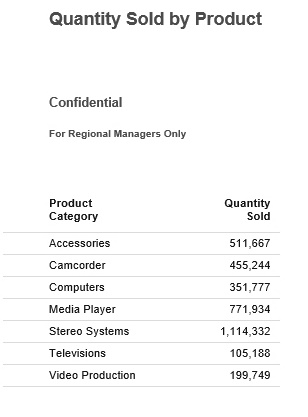
You can add your own text before or after the supplied text, for example, For Regional Managers Only.
- Click OK to save the report heading
and page heading and close the Header & Footer dialog box.
The report heading and page heading that you added and styled are shown in Live Preview in the following image.
- To make changes to either the report or page heading, right-click the heading and click Edit. You can also double-click on the header to open the Header & Footer dialog box.
Procedure: How to Style Headings and Footings in a Report
You can style headings and footings in the report output for the selected heading or footing field.
- Create a report.
- With the report opened in Live Preview, select the heading or footing text that you want to style.
- On the Home tab, in the Report group, click
Header & Footer.
The Header & Footer dialog box opens.
- Select any of the following styling options that are
available in the Style dialog box.
- Font. Opens a drop-down list, which you can use to change the font.
- Font size. Opens a drop-down list, which you can use to change the font size value.
- Bold. Applies bold font formatting to the selected text.
- Italic. Applies italic font formatting to the selected text
- Underline. Underlines the selected text.
- Justify Left. Aligns the text to the left of the canvas.
- Justify Center. Aligns the text to the center of the canvas.
- Justify Right. Aligns the text to the right of the canvas.
- Font color. Opens the Color dialog box, where you can select the font color.
- Background color. Opens the Color dialog box, where you can select the background color for the report.
-
Reset to Quick Styles from Template. Resets all settings
to the default settings from the template.
Note: Reset only works while the Report Style dialog box is open. Once you click OK, all changes are committed. To undo global styling after it has been committed, you must use the Undo command on the Quick Access Toolbar.
- Click OK. The report is styled accordingly.
Procedure: How to Style Rows of Data With Alternating Colors in a Report
You can style rows of data in a report with alternating colors.
- Create a report.
- Open the report in Live Preview.
- On the Home tab, in the Report group,
click Banded.
The Color dialog box opens.
- Select a color.
- Click OK.
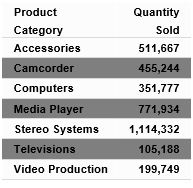
The selected color provides an alternating color scheme for the report. The report output displays alternating rows of data, using a white background for one row and a background of the selected color for the next row. This pattern continues throughout the report, as shown in the following image of banded report output.
Procedure: How to Apply Traffic Light Conditional Styling to a Report (By Constant)
You can apply traffic light conditional styling to data for a selected measure field. By default the report displays the values that satisfy the first condition in green, and the values that satisfy the second condition in red.
- Open a report in Live Preview.
- Open the Traffic Light Condition dialog box in one of
the following ways:
- Ribbon: Select a field on the report, and then on the Field tab, in the Display group, click Traffic Lights.
- Shortcut Menu: Right-click a field on the report, point to More, and then click Traffic Light Conditions.
The Traffic Light Condition dialog box opens.
- From the Relational Operators drop-down menu below the field name, click a relational operator. For example, Equal to.
- In the field to the right of the Relational Operators
drop-down menu, click the down arrow for the Type drop-down menu.
The Type menu opens.
- In the Type drop-down list, click Constant.
- Enter a value in the Value field.
or
- From the Get Values drop-down menu, select one of the following values: All, First, Last, Minimum, Maximum, or From File. The value that you select appears in the Get Values field.
- Select the value in the Get Values field. The value that you selected appears in the Value field.
- Click OK.
The value that you selected appears in the field to the right of the Relational Operators drop-down menu.
- Click the Style button.
The Style menu opens.
- From the Style menu, click the Font Color or Background
Color button.
The Color dialog box opens.
- Select a color.
- Click OK.
The color appears in the Preview box.
- Click Apply to apply the colors to the report.
- Click the Drill Down button.
The Drill Down dialog box opens.
- In the Drill Down dialog box, use the radio buttons to specify the action you wish to perform. For example, drill down to a report or webpage, create an auto link target, or refresh a BI portal.
- Click OK to close the dialog box.
- In the Traffic Light Condition window, click the New button to set traffic light conditions for additional fields.
Procedure: How to Apply Traffic Light Conditional Styling to a Report (By Field)
You can apply traffic light conditional styling to data for a selected measure field. By default, the report displays the values that satisfy the first condition in green, and the values that satisfy the second condition in red.
- Open a report in Live Preview.
- Open the Traffic Light Condition dialog box in one of
the following ways:
- Ribbon: Select a field on the report, and then on the Field tab, in the Display group, click Traffic Lights.
- Shortcut Menu: Right-click a field on the report, point to More, and then click Traffic Light Conditions.
The Traffic Light Condition dialog box opens.
- From the drop-down menu below the field name, select a relational operator. For example, Equal to.
- In the field to the right of the Relational Operators
drop-down menu, click the arrow for the Type drop-down menu.
The Type dialog box opens.
- In the Type drop-down list, select Field.The Type dialog box displays a list of the data fields that you can choose from.
- Select a data field from the list.
- Click OK.
The field that you selected appears in the field to the right of the Relational Operators drop-down menu.
- Click the Style button.
The Style menu opens.
- From the Style menu, click the Color button.
The Color dialog box opens.
- Select a color.
The color appears in the Preview box.
- Click OK.
- Click the Drill Down button.
The Drill Down dialog opens.
- In the Drill Down dialog, specify each of the following:
- Drill down to a report or a webpage
- URL of the webpage
- An alternate comment
- Target (New Window, Same Window)
- Parameters that you want to use (Name, Value)
- Click OK.
- Click the New button to set traffic light conditions for additional fields.
Procedure: How to Use Cell Padding in a Report
You can customize the amount of space inserted between rows and columns in a report.
- Open a report in Live Preview.
- On the Layout tab, in the Report group,
click Cell Padding, and then click Custom.
The Cell Padding dialog box opens.
- Type the cell padding values that you want in the Top, Bottom, Left, and Right fields.
- Click OK.
The report reflects the cell padding that you set.
The following image shows a report with custom cell padding.
Report Style Dialog Box
The Report Style dialog box provides options to style your report, as described below.
- Font. Use the drop-down menu to change the font.
- Font size. Use the drop-down menu to change the numeric value for the font size.
- Font style. Click the appropriate button (bold, italic, underline) to style the selected text.
- Text alignment. Click the appropriate button (left, center, right) to align the selected text.
- Font color. Click the button to open the Color dialog box, where you can select the font color. For more information, see Color Dialog Box.
- Background. Click the button to open the Color dialog box, where you can select the background color for the report.
-
Currency Symbol. Click the button to access the following
currency symbols US dollar, British pound, Japanese yen, euro, new
Israeli shekel.
Note: The new Israeli shekel currency symbol can be displayed with the following settings only:
- Server codepage = 1255, 65001, 424, or 65002.
- Client codepage = 1255 or 65001.
- Application server encoding = Cp1255 or UTF8.
- Font name = Lucida Sans Unicode or Arial Unicode MS.
-
Reset to Quick Styles from Template. Click the button
to reset all settings to the default settings from the template.
Note: Reset only works while the Report Style dialog box is open. Once you click OK, all changes are committed. To undo global styling after it has been committed, you must use the Undo command on the Quick Access Toolbar.
Color Dialog Box
The Color dialog box provides options for working with color in your report.
The Color dialog box options are:
- Standard Color Swatches. Provides a set of 48 predefined colors from which to choose on the left side of the dialog box. Your selection appears in the Selected Color field.
- Custom Color Palette. Provides a palette on the right side of the dialog box to define a custom color. Your selection appears in the Selected Color field.
- Luminosity bar. Drag the slider to change the luminosity (relative lightness or darkness) of a color. The corresponding numerical value appears in Lum.
- Hue. Indicates the hue value of your selected color. You can enter a value, or increase or decrease the hue value by using the up and down arrows, respectively.
- Sat. Indicates the saturation value of your selected color. You can enter a value, or increase or decrease the saturation value by using the up and down arrows, respectively.
- Lum. Indicates the luminosity (lightness or darkness) of your selected color. You can enter a value, or increase or decrease the luminosity value by using the up and down arrows, respectively.
- Red. Represents the numeric value of red (0 to 255).
- Green. Represents the numeric value of green (0 to 255).
- Blue. Represents the numeric value of blue (0 to 255).
- Selected Color. Displays the color that you selected.
- Transparent. Makes the color transparent. This is only available for background colors.
Report Group
The Report group on the Home tab contains commands to enhance a report.
-
Theme. Opens a dialog box where you can select a
theme to style your report. You can use the default StyleSheet
by clicking the Use Default Stylesheet button.
You can also select a document styling theme or an application theme to style all reports created. Use the Environment and Styling section of the Options window, which is accessible by clicking Options in the Application main menu.
Note: If you switch themes when working in Report mode, all custom styling is removed from the procedure.
- Style. Opens a Report Style dialog box for applying global styling to the entire report. For more information about the Report Style dialog box, see Report Style Dialog Box. For more information about styling reports, see Styling Reports.
- Banded. Opens a Color dialog box for choosing a color that provides an alternating color scheme for the report. The report output displays alternating rows of data, using a white background for one row and a background of the selected color for the next row. This pattern continues throughout the report. For more information about the Color dialog box, see Color Dialog Box. For more information about banded styling, see How to Style Rows of Data With Alternating Colors in a Report.
-
Header & Footer. Opens the Header &
Footer dialog box, from which you can add and style headings and
footings.
- For a report, you can add and style report headings, page headings, page footings, and report footings. In the dialog box, the tab for Report Header is active by default.
- For a chart, you can add and style page headings and page footings. Page Header is active by default.
- You can drag fields from the Data pane into the Header & Footer dialog box.
Another way to access the Header & Footer dialog box is to click the down arrow next to the Header & Footer button. It opens a drop-down menu from which you can select the heading or footing that you want to work with (Report Header, Page Header, Page Footer, Report Footer). After you make your selection, the Header & Footer dialog box opens, and the heading or footing that you selected is active.
From the Header & Footer dialog box, you can add and style the active heading or footing, or choose a different heading and footing to work with by selecting the applicable tab. You can switch among tabs, but InfoAssist does not save changes made on the tabs until you click Apply or OK. If you click Apply, the Header & Footer dialog box remains open. If you click OK, the dialog box closes.
You can style a selected heading or footing using the options on the styling toolbar. From left to right, you can customize the font type, font size, and font style (bold, italic, or underline). You can align text (left, center, or right), select the font color and background color, and restore styling settings to their default value from the template.
You can also add page footings to your reports or charts. From the Header & Footer dialog box, select Page Footer. When working with reports, you may use the Additional alignment options icon
 , to specify whether you want to
align the footer relative to the data (default) or relative to the
page. The Align Relative to Data option places the footer directly
below the data, and the Align Relative to Page option positions the
footer at the bottom of the page. When working with charts, only
the default page footer alignment option is supported.
, to specify whether you want to
align the footer relative to the data (default) or relative to the
page. The Align Relative to Data option places the footer directly
below the data, and the Align Relative to Page option positions the
footer at the bottom of the page. When working with charts, only
the default page footer alignment option is supported.
Note: The Align Relative to Page option works with reports that use positioned formats (for example, PDF, PS, DHTML, PPT, and PPTX).
You can also insert quick text into a heading or footing. Quick text is supplied for you. It includes information that is typically useful in identifying a report or chart. From the preformatted text drop-down menu, you can select:
- Draft
- Page X of Y
- Confidential
- Date (multiple formats)
- Time (multiple formats)
- Created by (followed by a name)
For charts, an icon
 on the far right of the styling
ribbon is enabled. This icon provides two options for controlling
the way in which the page heading and page footing are rendered.
The default option, Create Header and Footer as text, renders the
heading and footing as text elements that are separate from the
chart image. The option, Embed Header and Footer in the chart, renders
the heading and footing text as part of the chart image.
on the far right of the styling
ribbon is enabled. This icon provides two options for controlling
the way in which the page heading and page footing are rendered.
The default option, Create Header and Footer as text, renders the
heading and footing as text elements that are separate from the
chart image. The option, Embed Header and Footer in the chart, renders
the heading and footing text as part of the chart image.
Once you have added a heading or footing to a report or chart, you can double-click it on the canvas in design mode to reopen the Header & Footer dialog box. You can also right-click an existing heading or footing in design mode and click Edit from the menu to open the dialog box.
For more information on adding and styling headings and footings, see How to Add Headings and Footings to a Report.
- Column Totals. (Reports only) Adds a grand total row to the bottom of the report to sum numeric data in each column.
- Row Totals.(Reports only) Adds a grand total column to the right side of the report to sum numeric data in each row.
Report Features
The options on the Format tab, in the Features group, while in Report mode, allow you to add pop-up titles to columns, stack measures, and more.
- Title Popup. Displays pop-up titles when the mouse pointer hovers over a column title in the report output.
-
Accordion. Creates expandable views of data
for each vertical sort field. This option displays data values only
for the first vertical sort field when you first view the output.
You can manually expand your view to expose the data values of lower-level
sort fields.
Note: You cannot use the Table of Contents with the Accordion feature.
- Repeat Sort Value. Displays all repeated sort values instead of blanks in the output after the first instance of a new sort value, which is the default behavior.
- Stack Measures. Displays all numeric measure field names in a column of the report output with the corresponding numeric data values.
- active report options. Opens the active report options dialog box where you can configure your active report options such as menu items, graph engine, and colors.
- Accessibility. Allows a title to be added to a report, chart, or document that is Section 508-compliant.
The following table lists the output formats for which each feature is available. Yes means the output is available for the feature. No means that the output is not available for the feature.
|
HTML |
HTML5 |
active report |
|
Excel |
PowerPoint |
|
|---|---|---|---|---|---|---|
|
Title Popup |
yes |
no |
no |
no |
no |
no |
|
Accordion |
yes |
no |
yes |
no |
no |
no |
|
Repeat Sort Values |
yes |
yes |
yes |
yes |
yes |
yes |
|
Stack Measures |
yes |
no |
no |
no |
no |
no |
|
active report options |
no |
no |
yes |
no |
no |
no |
| WebFOCUS | |
|
Feedback |