Using Data Preparation Options
|
Topics: |
The Upload wizard and Connect to Data wizard offer a suite of data preparation options, which are designed to help you prepare your data for future analytics. With these data preparation tools, you can assess your data for validity and consistency, troubleshoot errors, and enhance accuracy and uniformity of your data. The following sections describe these options and explain how to use them.
Wizard Metadata Screen Reference
|
Topics: |
When you use the Upload wizard or Connect to Data wizard, your data opens in a wizard metadata screen, where you can preview and modify your synonym before you upload it to the target environment. The options available to you in this screen, in either wizard, are context sensitive. The following screen shows the metadata screen that opens when you upload a spreadsheet using the Upload wizard.
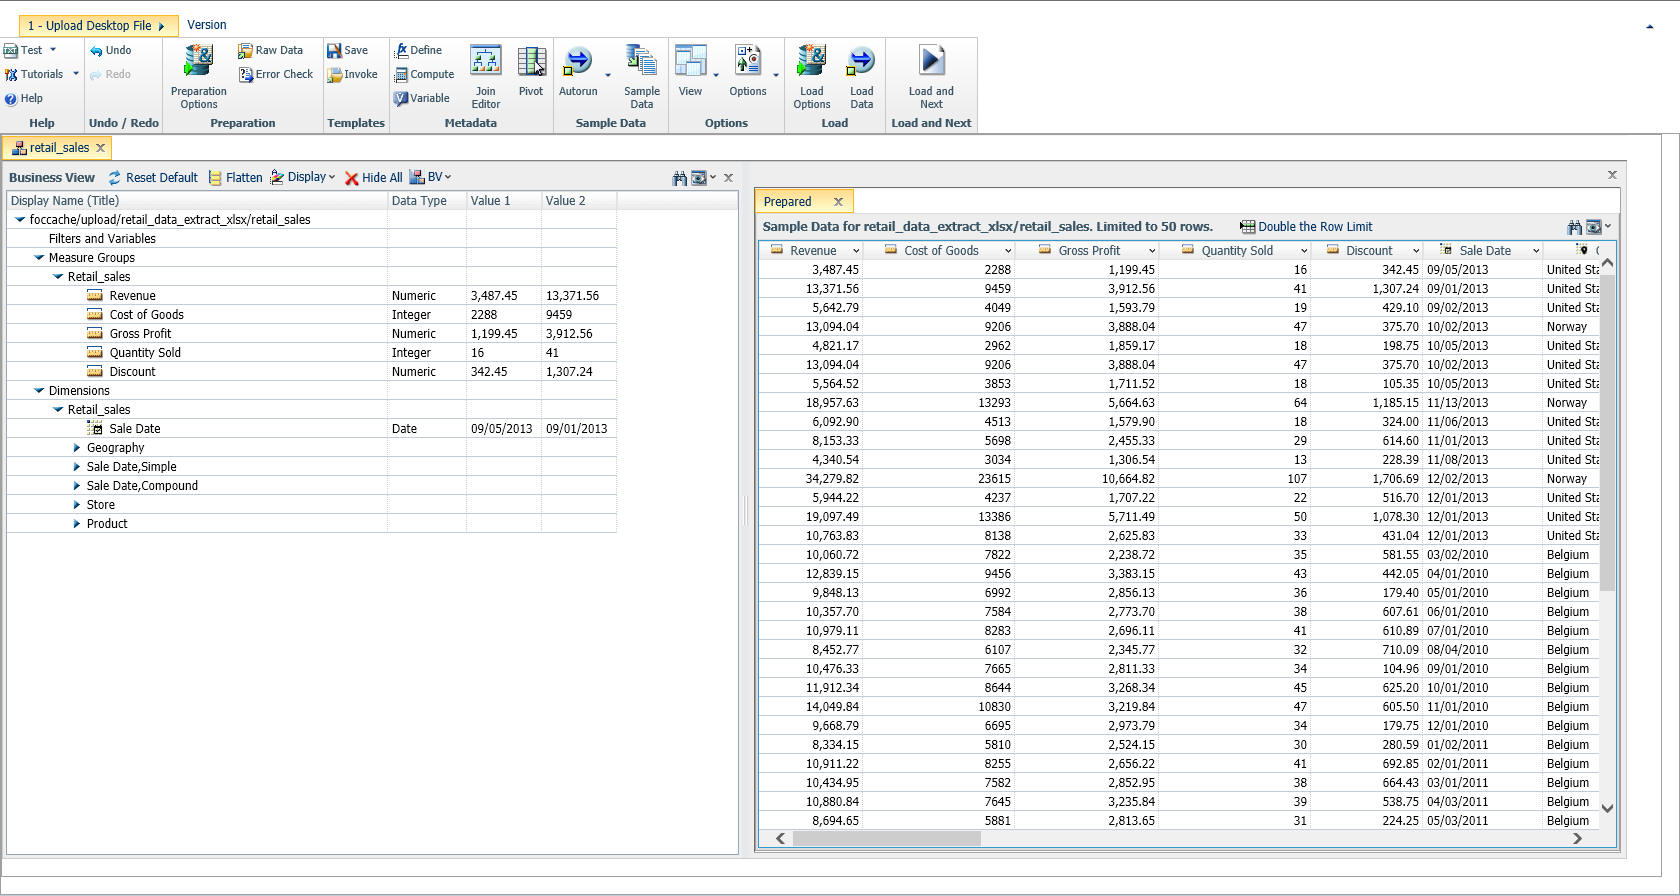
The wizard metadata screens consist of two sections:
- Ribbon. Provides access to data preparation functions that you can use to customize your synonym.
- Panes. Present areas of functionality that you can use to preview or modify the elements of the synonym.
Ribbon
|
Topics: |
The following image shows the ribbon of the wizard metadata screen that is available when you upload a spreadsheet.
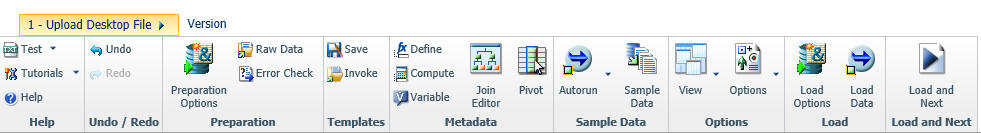
The following sections describe the groups and functions of the wizard metadata screen ribbon. Some options are specific to the Upload wizard, while others are specific to the Connect to Data wizard.
Help
The Help group contains the Test, Tutorials, and Help buttons. You can use the Test button to open the Session Log window, clear the session log, view the synonym being prepared in a text window, and view a list of prepared worksheets.
The options in the Test button include:
- Session Log
-
Opens the Session Log window. The session log contains all of the commands that have been processed for the current upload session. Using this window, you can filter the log file, clear the log file, download the log file to your machine, refresh the log, and manage your server agents.
- Clear Session Log
-
Deletes all content from the log file.
- View MFD
-
Opens the Master File being prepared in a text window. You can search for text within the Master File.
- View AFD
-
Opens the Access File being prepared in a text window. You can search for text within the Access File.
- Prepared Worksheets
-
Opens a window that lists the prepared Worksheets and the details of each, including the date on which it was prepared, the number of rows and columns, whether there is a header row, and the names of the target application, target synonym, target table, target adapter, and target connection.
The Tutorials button opens two high-level documents that outline the main functions of the Upload wizard, including the basic flow of common procedures, and the Business View + capabilities.
The Help button opens the Web Console online Help.
Undo/Redo
The Undo / Redo group contains the Undo and Redo options. You can use these options to reverse the last action you performed, or to cancel your last Undo action. For example, if you renamed a field, but do not want to save it, you can click Undo.
Preparation
The Preparation group contains options that you can use to review your data and prepare it for upload. The options are only available when you use the Upload wizard, and include:
- Preparation Options
-
Opens the Preparation Options dialog box, where you can set the following options for Excel spreadsheets.
- Scan all rows
-
Scans all records to determine data type for each column
- Row scan limit
-
Indicates how many worksheet rows are scanned to determine the formats of the columns. Set this value to 0 if you want to scan all of the worksheet rows.
- Extend character length
-
Extends character length by the percentage specified.
- Column format recognition
-
Sets the column format to loose or strict.
- Number of header rows
-
Sets the number of rows used as a header row in the worksheet. Set the value to 0 if a header is not used.
- Add RowID Column
-
Adds a row ID column to your data. This option is only available for Excel spreadsheets.
- Decompose Date fields into components
-
Decomposes Date fields into Year, Quarter, Month, and Day components.
- Date Order
-
Allows you to select a format in which the Date fields appear.
- Activate GEOGRAPHIC_ROLE assignment
-
Assigns geographic roles based on column name analysis.
The following options are also available from the Preparations Options dialog box, when you upload a comma separated values (CSV) file:- Non-printable Delimiter
-
Defines whether the string in the delimiter field is a printable string or a non-printable decimal character.
- Field Enclosure
-
Allows you to select an enclosure characters for each field from the number of available options, which include: none, single quote, double quote, space, and type-in enclosure. The default value is double quote.
- Header row
-
Defines if the header line be used as column names.
- Preserve format
-
Indicates whether the original data layout, including empty records and linefeeds, will be preserved.
- CODEPAGE
-
Specified the code page for the stored data that will be added to the Master File of the generated synonym.
- CDN
-
Continental Decimal Notation (CDN) determines the punctuation used in numerical notation for input data.
- Raw Data
-
Displays the raw data of the file to be uploaded in the Output Pane.
- Error Check
-
Produces informational messages, if the uploaded file contains inconsistent data, based on the first row of data. The Error Check result is displayed in the Output Pane.
Templates
The Templates group contains options that you can use to create and apply a template to your selected file. These options are only available when you use the Upload wizard, and include:
- Save
-
Saves the existing synonym as a template.
- Invoke
-
Opens the Select Template name dialog box, where you can choose a saved template that you created earlier.
Metadata
The Metadata group contains several data preparation options that you can use to enhance your data. This includes defining virtual fields, creating Compute and Variable fields, joining data sources, and pivoting rows of data into columns. The options include:
- Define
-
Opens the Expression builder, where you can create a define field.
- Compute
-
Opens the Expression builder, where you can create a compute field.
- Variable
-
Opens the properties dialog box, which provides access to the following options:
- Variable Name
-
Specifies the name of the variable.
- Prompt Caption
-
A description of the variable that will appear in the prompt.
- Default Value
-
Specifies the default value of the variable.
- Prompt Values
-
Provides a drop-down menu of optional prompt values for the variable. The options are Input box, Static list of values, Static list of values/captions, Synonym based dynamic list of values, and Procedure based dynamic list of values.
- Quoted
-
If selected, this option adds single quotation marks around the variable.
- Usage Format
-
Provides a drop-down menu of date formats for the variable. The options are Integer, Character (fixed), and Decimal.
- Join Editor
-
Opens the Join Editor dialog box, where you can join multiple worksheets to create a cluster.
- DBA
-
Opens the DBA dialog box, where you can edit the access to your data. This option is available only when you use the Connect to Data wizard.
- Pivot
-
Opens the Pivot Prepared Data dialog box, where you can pivot any repeating columns or groups of columns into rows.
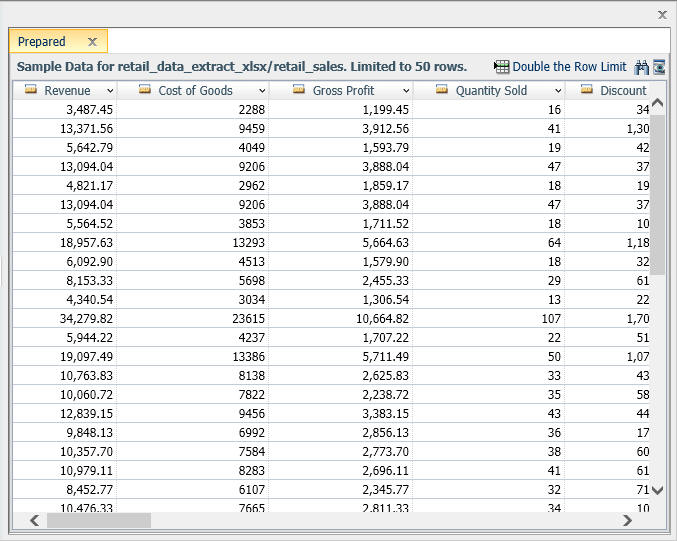
Sample Data
The Sample Data group contains options that you can use to toggle the Autorun and Data Preview options On and Off, stop the current request, and view the Sample Data in the Output Pane to instantly visualize field values.
- Autorun
-
Provides access to the following options:
- Off
-
Disables autorun in the Output Pane.
- On
-
Enables autorun in the Output Pane.
- Data Preview
-
Provides access to the following options:
- Off
-
Disables the display of data values in the Business View Pane.
- On
-
Enables the display of data values in the Business View Pane.
- Sample Data
-
Runs the Sample Data request in the Output Pane.
Options
The Options group consists contains the View and Options functions. You can use the View button to customize your view of the wizard you are using. You can use the Options button to specify options for generating and displaying the synonym and set upload limits.
Click View to access the following options to customize your screen:
- Reset View
-
Reverts all your screen customizations to the default view.
- Grid Details
-
Provides access to the following options:
- View as Columns
-
Displays data in columns inside panes. This option is enabled, by default.
- View as Tooltip
-
Displays data in tooltips, as you hover over fields.
- Table/Column Pane
-
Provides access to the options that control placement of the Table/Column Pane on the screen, such as:
- Tile Horizontal
-
Displays panes on the screen in the horizontal succession. This option is enabled, by default.
- Tile Vertical
-
Displays panes on the screen in the horizontal succession.
- Show
-
Displays the Table/Column Pane on the screen.
- Hide
-
Hides the Table/Column Pane from view. This option is enabled, by default.
- Business View Pane
-
Provides access to the options that control placement of the Business View Pane on the screen, such as:
- Show
-
Displays the Business View Pane on the screen.
- Hide
-
Hides the Business View Pane from view. This option is enabled, by default.
- Filters/Groups Pane
-
Provides access to the options that control placement of the Filters/Groups Pane on the screen, such as:
- Show
-
Displays the Filters/Groups Pane on the screen.
- Hide
-
Hides the Filters/Groups Pane from view. This option is enabled, by default.
- Output Pane
-
Provides access to the options that control the placement of the Output Pane on the screen, such as:
- Show Floating
-
Undocks the Output Pane, so it can be moved around the screen.
- Show Docked
-
Docks the Output Pane on the right side of the screen. This option is enabled, by default.
- Show Maximized
-
Enlarges the Output Pane to the size of the screen.
- Hide
-
Hides the Output Pane.
- Multiple Output Panes
-
Provides access to the options that control the appearance of multiple Output Panes on the screen, such as:
- Show All Tabbed
-
If this option is selected, all output requests are shown in the Output Pane in tabs. This option is selected, by default.
- Show Only Latest
-
If this options is selected, the single-tab Output Pane is reloaded to display the latest output request.
Click Options and select Advanced to open the Options dialog box and select the following synonym creation options:
- Synonym Editor
-
Provides access to the following options, when you use the Connect to Data wizard.
- Support extended options
-
Allows you to insert sort object styling.
- Column Management
-
Provides access to the following options.
- Name display strategy
-
You can select how the column names are displayed in the Tables/Columns Pane from one of the following choices:
- Name. Assigns the FIELDNAME attribute from the synonym as the column name displayed in the Tables/Columns Pane.
- Title. Assigns the TITLE attribute from the synonym as the column name displayed in the Tables/Columns Pane. TITLE is the default value.
- Description. Assigns the DESCRIPTION attribute from the synonym as the column name displayed in the Tables/Columns Pane.
- Alias. Assigns the ALIAS attribute from the synonym as the column name displayed in the Tables/Columns Pane.
- Function display strategy
-
Selects the functions information that displays in the Expression Builder, and on the shortcut menu for a column, when you add a function to the synonym. Select one of the following values:
- Syntax. The function syntax (function name and parameters) is displayed. This is the default value.
- Short Description. A short description of what the function calculates is displayed.
- Language Generation Options
-
Provides options for generating field names and synonym references in the synonym being prepared.
- Use segment to qualify field reference
-
Specifies when the segment name should be added to the field name in order to qualify the field name. Select one of the following values:
- For duplicate fields. Uses the segment name to qualify the field name only when multiple segments contain the same field name. This is the default value.
- Always. Uses the segment name to qualify the field name.
- Use application name to qualify synonym reference
-
Specifies whether synonym references in the synonym being prepared will include the application name. Select one of the following values:
- Yes. Adds the application name to synonym references (appname/synonymname). This is the default value.
- No. Does not add the application name to synonym references.
- Limits
-
Sets limits for working with the Upload or Connect to Data wizard.
- Maximum number of rows for test
-
Sets the maximum number of rows of sample data displayed. The default value is 50.
- Maximum number of columns for test
-
Sets the maximum number of columns of sample data displayed. The default is 999999.
- Maximum number of identical error messages
-
Sets the maximum number of identical error messages that can be generated by the wizard.
- Random Sampling limit (in %)
-
Defines the percentage for the random sample that is used for statistical analysis.
- Undo/Redo Limit
-
Sets the maximum number of undo and redo actions supported. The default value is 50.
- Omit missing (null) values in Data Profiling charts
-
Omits any missing or null values in the data source.
Load
The Load group contains the Load Options and Load Data items. These options are only available when you use the Upload wizard.
Click Load Options to select the following data loading options. These options may change depending on the target adapter selected.
- Load Option
-
Provides access to the following options:
- New
-
Uploads a new worksheet to create a synonym.
- Append Existing Data
-
Adds new data to the existing synonym without changing the structure and parameters of the synonym.
- Merge with Existing Data
-
Merges new data with the existing synonym.
- Adapter
-
Allows you to select a database, in which the unloaded data is stored.
- Connection
-
Specifies a connection for the selected adapter.
- Synonym Application
-
Specifies the application directory for the synonym. Click the ellipsis button to change this directory.
- Synonym
-
Specifies the name of the synonym, as appears in the repository. By default, the name is the same as the name of the source worksheet.
- Data File
-
Contains the name of the DFIX target data file in the database. This option is only available if you are uploading a .CSV file.
- Table Name
-
Indicates the name of the target table in the database.
- Bulk Load
-
Specifies the method of loading data. This option is enabled, by default.
- Key columns derived from
-
Contains a list of candidate fields from which you can select one or more to be used as the primary key of the target table.
- Field Delimiter
-
Allows you to select a column separator from the number of available options, which include: none, comma, tab, pipe, space, semi-colon, colon, type-in delimiter. The default value is comma. This option is only available if you are uploading a .CSV file.
- Header row
-
Defines if the header line be used as column names. This option is only available if you are uploading a .CSV file.
- Field Enclosure
-
Allows you to select an enclosure characters for each field from the number of available options, which include: none, single quote, double quote, space, and type-in enclosure. The default value is double quote. This option is only available if you are uploading a .CSV file.
- Overwrite Existing Synonym
-
Overwrites the existing synonym with the same name.
Click Load Data to upload your synonym to the repository without leaving the Upload wizard. The Load Data button also brings up the Load Options dialog box, allowing to review and modify your loading parameters.
Load and Next
The Load and Next function uploads your synonym to the repository and brings you to the next screen, where you can select how to use your synonym. This option is only available when you use the Upload wizard.
Save and Next
The Save and Next function saves your changes and brings you to the next screen, where you can select how to use your synonym. This option is only available when you use the Connect to Data wizard.
Panes
|
Topics: |
The wizard metadata screen contains the following panes:
- Table/Column
- Business View
- Filters/Groups
- Output
The default view displays Business View and Output Panes. You can customize the view of your screen by clicking View on the ribbon.
Table/Column Pane
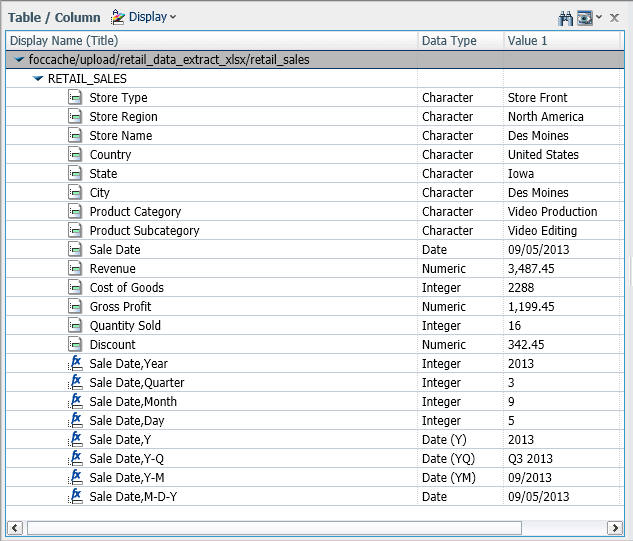
The Table/Column Pane displays the fields in the same order as they are displayed in the source file.
The Table/Column Pane is shown in the following image.
The Table/Column Pane has the following options:
- Display
-
Toggles between the Columns, Business View, and the Join Editor view of folders options. The Join Editor option launches the Join Editor dialog box, where you can create clusters.
- Find
-
Opens the search field, where you can type the name of the field that you want to find and allows you to modify your search options.
- View
-
Provides access to the following options:
- Expand All
-
Expands all nodes, folders, and hierarchies.
- Collapse All
-
Collapses all nodes, folders, and hierarchies.
- Choose Columns
-
Opens the Choose Columns dialog box, where you can select the columns that you want to display in the Business View Pane.
- Reset to defaults
-
Reverts the pane to its default view.
Business View Pane
|
Topics: |
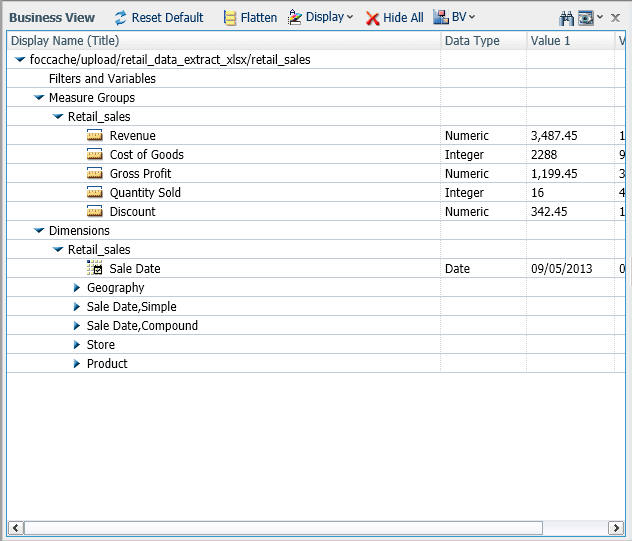
The Business View Pane shows you how the Upload wizard and Connect to Data wizard interpret and categorize your data. The numeric values, such as Gross Profit or Cost of Goods, are interpreted as measures. The alphanumeric values, such as Product or Geography, become dimensions. Dimensions, which categorize data, can be organized into hierarchies to define the relationships between the fields in the hierarchies. For example, a Geography hierarchy can contain the Continent, Country, State, and City dimensions. You can also assign dimension attributes to any dimension field, whether or not it is in a hierarchy. When applied to a field, attributes provide supplementary information that can be used for analysis or display. For example, in a Geography hierarchy, which includes the Country, State, and City dimensions, Population can be assigned as an attribute of the City dimension. Each category of data is represented by an icon. The following table identifies these icons and describes what they represent.
|
Icon |
Identifies |
Description |
|---|---|---|
 |
Measure group |
Contains individual measures. |
 |
Measure |
Measure is a numeric field. It resides inside a measure group. Measures can be moved between measure groups and between measures and dimensions areas. |
 |
Dimension folder |
Contains dimensions, dimension hierarchies, and attributes. |
 |
Dimension Hierarchy |
Resides inside the dimension folder and contains individual dimensions and associated attributes. |
 |
Dimension |
Dimension is an alphanumeric field. It resides inside the dimension hierarchies. Dimensions can be moved between dimension folders, between and outside dimension hierarchies. You can move a dimension into a measure group and turn it into a measure. You can also move a dimension inside an attribute folder and turn it into an attribute. |
 |
Attribute folder |
Contains individual attributes associated with a dimension. |
 |
Attribute |
Resides inside an attribute folder. Attributes can be moved between attribute folders. If you move an attribute outside an attribute folder, it inherits the identity of a hierarchical level to which it is moved. |
The Business View Pane is shown in the following image.
The Business View Pane has the following options:
- Reset Defaults
-
Eliminates all changes and reverts the view back to the initial categorization of your data.
- Flatten
-
Removes dimension hierarchies and displays individual dimensions under the Dimensions folder.
- Display
-
Toggles between the Columns, Folders, and Modeling View of Folders displays.
- Hide All
-
Hides all fields from the view.
Note: When a field is hidden, it is moved to the Table/Column Pane. This pane is hidden, by default. For more information on how to access this pane, see Options.
- BV
-
Opens a menu, where you can change BV_NAMESPACE=OFF and BV_NAMESPACE=ON modes for your session. By default, the wizards create a Business View structure in with BV_NAMESPACE=OFF, which adheres to a fixed structure of measures, followed by dimensions, hierarchies, levels, and attributes, using a folder structure in the synonym. You can insert new entries, but are limited to existing structure types. When you select BV_NAMESPACE=ON, you can insert new folders and increase the flexibility of your metadata.
- Find
-
Opens the search field, where you can type the name of the field that you want to find and allows you to modify your search options. Any occurrence of the search string found in the pane is highlighted.
- View
-
Provides access to the following options:
- Expand All
-
Expands all nodes, folders, and hierarchies.
- Collapse All
-
Collapses all nodes, folders, and hierarchies.
- Choose columns
-
Opens the Choose Columns dialog box, where you can select the columns that you want to display in the Business View Pane.
- Reset to defaults
-
Reverts the pane to its default view.
Each node in the Business View Pane opens a context-sensitive shortcut menu that can be used to insert and modify folders or fields, view sample data, perform statistical analysis and data preparation techniques. You can access these options by right-clicking each level. These shortcut menu options are conditional and depend on the type of an element and its place in the synonym structure. In addition, these options are different if you are editing your synonym in BV_NAMESPACE=OFF mode or BV_NAMESPACE=ON mode. The following list identifies the shortcut menu options for your synonym in both modes.
- Insert
-
Depending on the context, provides access to the following options:
- New Measure Group
-
Creates a new measure group inside this Measure Group folder.
- New Dimension Folder
-
Creates a new dimension folder inside the Dimensions node.
- New Parent/Child Hierarchy
-
Opens the Create a Parent/Child Hierarchy dialog box, where you can create a new hierarchy.
- New Levels Hierarchy
-
Creates a new level hierarchy inside this dimension folder.
- New Folder
-
Creates a new folder, which functions as a segment to provide a view of the synonym and to define the accessible fields and their relationships. You can assign a DV role, such as Dimension, Measure, or Attributes to each new folder that you create. This option is only available in BV_NAMESPACE=ON mode.
- Filter
-
Opens the Filters/Groups Pane, where you can create or modify a filter.
- Character Function
-
Provides a choice of preconfigured character functions that open in the Function Assist for New Define dialog box.
- Conversion Function
-
Provides a choice of preconfigured conversion functions that open in the Function Assist for New Define dialog box.
- Geography Function
-
Provides a choice of preconfigured geographical functions that open in the Function Assist for New Define dialog box.
- Numeric Function
-
Provides a choice of preconfigured numeric functions that open in the Function Assist for New Define dialog box.
- Advanced Function
-
Opens the Define dialog box, where you configure a new function.
- Grouping
-
Opens the Filters/Groups Pane, where you can configure group values.
- Group Numeric (Binning)
-
Opens the Binning wizard, where you can configure a numeric group.
- Aggregation Function
-
Provides a choice of preconfigured aggregation functions that open in the Function Assist for New Compute dialog box.
- Analytic Function
-
Provides a choice of preconfigured analytic functions that open in the Function Assist for New Compute dialog box.
- Advanced Aggregation
-
Opens the Compute dialog box, where you can a compute field using advanced aggregation options.
- Properties
-
Opens the Properties dialog box. For more information, see Using the Properties Dialog Box.
- Pivot
-
Opens the Pivot Prepared Data dialog box, where you can pivot any repeating columns or groups of columns into rows.
- DV Role
-
Opens a sub-menu that allows you to assign a DV role, such as Dimension (Standalone or Drillable), Measure, or Attribute, explicitly to a field or folder. You can also choose to have the field inherit its role from a parent. This role moves with the field if you drag it to another location in the BV+ structure. If you do not explicitly assign a DV role, the role changes as you move the object under a new parent, except if you drop it onto a field with the Drill Level role. This option is only available if you are in BV_NAMESPACE=ON mode.
- Geographic Role
-
Opens a sub-menu, where you can configure a geographic role for the field.
- Create Hierarchy
-
Transforms the dimension into a hierarchy. This option is only available for standalone dimensions.
- Remove Hierarchy
-
Removes a hierarchy and displays all the items inside this hierarchy as individual dimensions.
- Remove from Hierarchy
-
Removes the field from a hierarchy. This option is only available for the dimensions that are part of a hierarchy.
- Show/Hide Attribute
-
Toggles between displaying or hiding attributes for the field.
- Sample Data
-
Displays the sample data for all the measure groups inside this measure group folder in the Output Pane.
- Data Profiling
-
Provides access to the following options:
- Statistics
-
Displays statistic analysis of the field in the Output Pane.
- Hex View
-
Displays the data in hexadecimal format.
- Values
-
Displays the values for this field for the selected number of rows in the Output Pane.
- Values (Bar Chart)
-
Displays the values for the field in a bar chart in the Output Pane. The chart is limited to 50 values.
- Values (Pie Chart)
-
Displays the values for the field in a pie chart in the Output Pane.
- Duplicate Values
-
Displays the duplicate values for this field for the selected number of rows in the Output Pane.
- Outliers
-
Displays the outliers for this field in the Output Pane.
- Impact Analysis
-
Displays the impact analysis results in the Output Pane.
- Rename
-
Opens the Rename dialog box where you can rename the field.
- Hide
-
Moves the field to the Table/Column Pane.
Note: This pane is hidden, by default. For more information on how to access this pane, see Options.
- Cut
-
Cuts the field from its directory.
- Paste
-
Pastes an item inside the directory.
Using the Properties Dialog Box
You can use the Properties dialog box to change settings for your data, such as appearance, formatting, data descriptions, and others. The options in this dialog box change depending on the type of data you are editing.
An example of the Properties dialog box is shown in the following image.
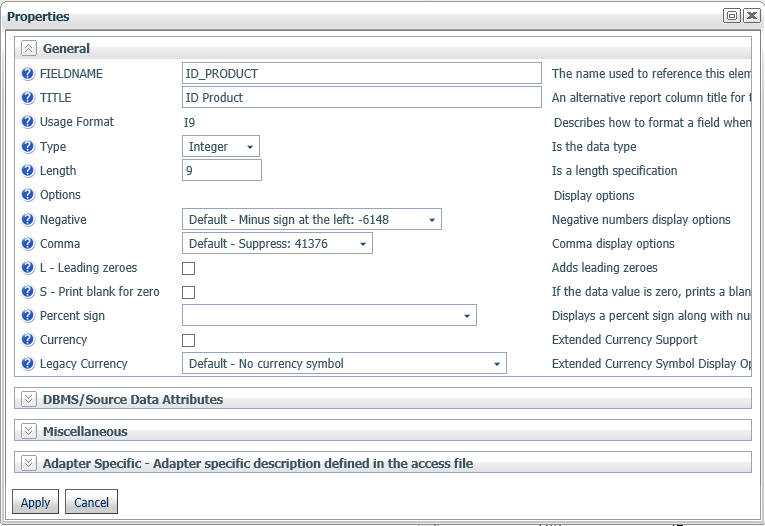
The Properties dialog box is organized into various groups, as described below.
Note: The location of these properties within the different groups may change if you are using BV_NAMESPACE=OFF mode or BV_NAMESPACE=ON mode.
General Group
Contains general properties that can be applied to various elements.
- FOLDER
-
Indicates the name of virtual segment that you have selected.
- PARENT
-
Identifies the name of the parent, for the virtual segment that you have selected.
- DESCRIPTION
-
Provides additional information about the folder that you are viewing. This is an optional attribute.
- FIELDNAME
-
Indicates the name that is used to reference this data element in the request.
- BELONGS_TO_SEGMENT
-
Identifies the segment where the field resides in the original Master File.
- TITLE
-
Specifies an alternative report column title for the field.
- Usage Format
-
Describes how to format a field when displaying it in a report or using it in a calculation.
- Type
-
Allows you to select a data type for this field, as it is stored in the data source.
- Length
-
Describes the length of data as it is stored in the data source.
- Number of decimal places
-
Specifies the number of digits that follow the decimal point.
- Options
-
Displays options for this field.
- Negative
-
Allows you to select a format in which negative numbers are displayed.
- Comma
-
Allows you to choose whether large numbers are displayed with a comma.
- L - Leading zeroes
-
If selected, adds leading zeroes to a number.
- S - Print blank for zero
-
Specifies whether to display the blank field, if the data value is zero.
- Percent sign
-
For the percentage values, toggles between displaying a percentage sign only, or calculating the percentage value and displaying a percentage sign.
- E - Scientific notation
-
If selected, only significant digits are displayed.
- Currency
-
If selected, provides access to the Currency Code and Currency Symbol Position options.
- Currency Code
-
Provides access to ISO currency code formats.
- Currency Symbol Position
-
Indicates the position of the currency symbol.
- Legacy Currency
-
Provides the extended currency symbol display options. Select a currency symbol that displays in the report output, regardless of the default currently symbol that is configured for National Language Support (NLS).
- Component Order
-
Sets the order of the date components, such as MDYY or DMYY.
- Month
-
Sets the display options for a month component.
- Day of the Week
-
Sets the display options for the day of the week component.
- Separator
-
Specifies the element that you can use to separate date components, such as with commas or hyphens.
- DV Role
-
Identifies the dimension view hierarchy the property represents. These options include Dimension (Standalone), Dimension (Drill Level), Measure, Attribute, and Inherit from parent.
DBMS/Source Data Attributes
Contains supplemental properties that you can define for metadata.
- ALIAS
-
Specifies the name of the field, as it appears in the synonym. If you are using BV_NAMESPACE=ON mode, this property appears under the General group.
- ACTUAL
-
Describes the type and length of data as it is stored in the data source.
- Type
-
Allows you to select a data type for this field, as it is displayed in a report or used it in a calculation.
- Length
-
Describes the length of data as it is displayed in a report or used it in a calculation.
- DATEPATTERN
-
Specifies the date pattern that is used for conversion from a date or date time that is stored as an alphanumeric field to a data or data time format.
- MISSING
-
If selected, allows null values to be entered into and read from a field in data sources that support null data.
Miscellaneous Group
Contains supplemental properties. All properties in the Miscellaneous group are disabled, by default.
- REDEFINES
-
Enables you to redefine or recompute a field name that exists in more than one segment. A DEFINE expression may not contain qualified field names.
- WITH
-
Associates the DEFINE with a real field from the synonym.
- DESCRIPTION
-
Creates an attribute for comments and remarks within a field.
- ACCEPT
-
Creates an attribute that can be used to populate an auto-prompt dialogue box or to validate data as it is entered into a field from a MODIFY procedure.
- PROPERTY
-
Indicates the place of the field in the hierarchy of the Master File.
- REFERENCE
-
Shows field attributes, such as physical parent/child relationships among the elements in the file.
- DATASET
-
Specifies a physical name of the data source or alternate index.
- FIELDTYPE
-
Specifies the type of the field.
- I - Index
-
If selected, the field is displayed as an index field.
- R - Readonly
-
If selected, the field is displayed as a read-only field.
- Prompt Values
-
Adds optional prompt values for a define.
- ACCESS_PROPERTY
-
Specifies access options for the field's data. If you are using BV_NAMESPACE=ON mode, this property appears under the General group.
- INTERNAL
-
If selected, the field does not appear in the list of available fields or Sample Data. If you are using BV_NAMESPACE=ON mode, this property appears under the General group.
- NEED_VALUE
-
If selected, the field requires a value to access the data.
- Select By
-
Allows you to set a selection parameter. The choices are: value, range, and multiple values.
- HELPMESSAGE
-
Allows you to add a help message to the field.
- GEOGRAPHIC_ROLE
-
Defines a geographic role of the field.
- TEMPORAL_PROPERTY
-
Specifies a temporal property of the field.
- USE_STYLE
-
Allows you to select a style for the field.
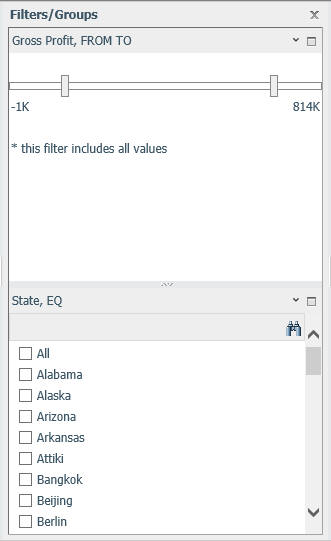
Filters/Groups Pane
The Filters/Groups Pane automatically opens when you create a new filter or group. When you open two or more items at the same time, they display nested in the same pane.
An example of the Filters/Groups Pane is shown in the following image.
Depending on the field type, the Filters/Groups Pane displays the following options:
- Find
-
Opens the search field, where you can type the name of the field that you want to find and allows you to modify your search options.
- Expand
-
Maximizes the section of the pane.
- Drop-down arrow
-
Provides access to the following options for filters:
- Display
-
Determines a display format for the filter. The options include: text box, double list, check-box list, pull-down list, and slider. The default option is slider for Numeric fields and check box for all other fields.
- Relation
-
Creates a relational expression. The options include: EQ, NE, LT, GT, LE, GE, and Range. The default value is Range for Numeric and EQ for all other fields.
- Values
-
Toggles between showing and hiding the NULL values for this field.
- Hide Filter Card
-
Removes filter data from the Filters/Groups Pane, while leaving the pane open.
- Delete Filter
-
Deletes the filter from the synonym.
- Properties
-
Opens the Filter properties dialog box, where you can change the Title for the filter, and view its Name and Base field name properties.
- Move Up
-
Moves the filter up in the Filters/Groups Pane.
- Move Down
-
Moves the filter down in the Filters/Groups Pane.
Provides access to the following options for groups:
- Display
-
Determines a display format for the group. The options are: Double List and Single List. The default value is Single List.
- Add all shown values to a new group
-
Selects all values and adds them to a new group.
- Create a New Group
-
Creates a new empty group, to which you can add values manually.
- Edit properties
-
Opens the Edit properties dialog box, where you can edit the Name, Title, and Default Value properties.
- Hide Group Card
-
Removes the group data from the Filters/Groups Pane.
- Move Up
-
Moves the group up in the Filters/Groups Pane.
- Move Down
-
Moves the group down in the Filters/Groups Pane.
Additionally, if the list of values spans through multiple pages, you can increase or decrease the number of values displayed on each page by clicking the Increase Page Size or Decrease Page Size buttons. You can use the First Page, Previous Page, Next Page, and Last Page buttons to navigate between pages.
Output Pane
The Output Pane displays data and status messages for various features. The Output Pane is shown in the following image.
The Output Pane has the following options:
- Find
-
Opens the search field, where you can type the name of the field that you want to find and allows you to modify your search options.
- View
-
Provides access to the following options:
- Expand All
-
Expands all nodes, folders, and hierarchies.
- Collapse All
-
Collapses all nodes, folders, and hierarchies.
- Choose columns
-
Opens the Choose Columns dialog box, where you can select the columns that you want to display in the Business View Pane.
- Reset to defaults
-
Reverts the Pane to its default view.
If more than one tab is open, you can right-click a tab to access the tab menu, as shown in the following image. The menu allows you to close all other tabs, close tabs to the right, or show only the latest tab.
Creating Clusters
|
How to: |
When you need to add more tables to your synonym, you can use the Join feature to create a cluster. This allows you to enhance the structure of your synonym by introducing more data.
Procedure: How to Create a Cluster
- When uploading data or connecting to data on the main metadata screen, on the ribbon, in the Metadata group, click Join Editor.
The Join Editor dialog box opens.
- Click Insert Child.
The Insert Child dialog box opens.
- Click a Master File from the list, and then click OK.
You can select several Master Files by holding the Shift key.
The completed cluster displays in the Join Editor dialog box, as shown in the following image.
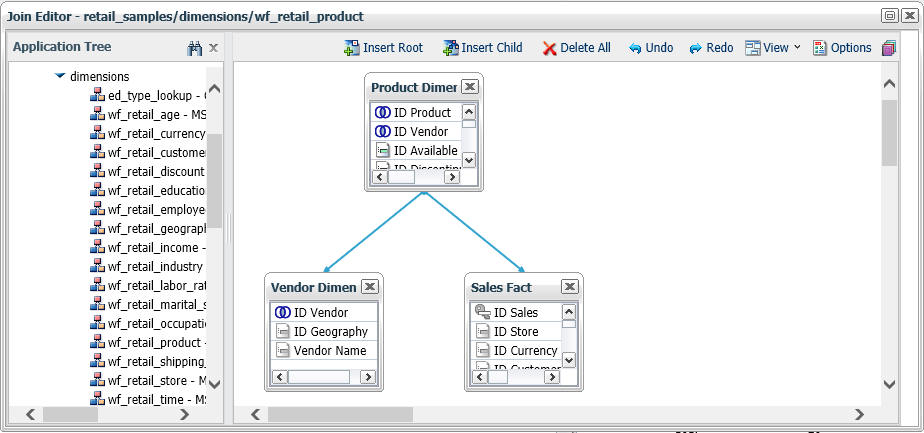
- Close the Join Editor dialog box.
The new columns are added to the Table/Column pane.
- Drag columns to the Business View pane to modify the synonym.
Related Information:
Pivoting Repeating Columns Into Rows
|
How to: |
Some Excel spreadsheets may contain repeating columns, such as sales figures for a series of years. There may even be repeating column groups, such as both budget and actual figures for a series of years. You can use the pivot option to transform these columns or groups of columns into rows.
Procedure: How to Pivot Columns Into Rows
- When uploading data or connecting to data on the main metadata screen, on the ribbon, in the Metadata group, click Pivot.
The Pivot Prepared Data dialog box opens.
- Set the Pivot Type option to Repeating column.
- In the First column drop-down box, select the first column in the range of repeating columns.
- In the Last column drop-down box, select the last column in the range of repeating columns.
- In the Column Title for Pivoted Data, type the new column title that reflects the numeric cell that you are describing.
- In the Title for Pivoted Key field, type the new column title that represents the repeating columns that you are pivoting into rows.
- Leave the Formula for Pivoted Key field value unedited.
This value is automatically generated by the wizard, it should not
be changed.
An example of the completed configuration for pivoting columns is shown in the following image.
- Click OK.
The repeating columns now display as rows. The Pivot button turned into the Remove Pivot button, allowing you to quickly revert your pivoting changes.
Related Information:
Procedure: How to Pivot Column Groups into Rows
- When uploading data or connecting to data on the main metadata screen, on the ribbon, in the Metadata group, click Pivot.
The Pivot Prepared Data dialog box opens.
- Set the Pivot Type option to Repeating group of columns.
- In the Number of groups field, specify the number of groups of columns that you are pivoting.
- In the Column Title for Pivoted Data, type the new column title that will be used for all the columns across the repeating groups.
- In the Title for Pivoted Key field, type the new column title that represents the repeating columns that you are pivoting into rows.
- Edit the automatically generated formula in the Formula
for Pivoted Key field by clicking the ellipsis button. Make sure
there are no repetitive alphanumeric values in the Pivoted Column
field.
An example of the completed configuration for pivoting groups of columns is shown in the following image.
- Click OK.
The repeating groups of columns now display as rows. The Pivot button turned into the Remove Pivot button, allowing you to quickly revert your pivoting changes.
Related Information:
Creating Hierarchies
|
How to: |
When you upload a data file, using the default wizard settings, the wizard creates dimension hierarchies automatically, based on name pattern-matching and date-time analysis. Optionally, you can create additional hierarchies to organize individual columns, enable drill-downs in your data, and add more flexibility to your synonym.
Note: If you set BV_NAMESPACE=ON, you are able to add new folders, but will not be able to create new hierarchies.
Procedure: How to Create a Hierarchy
- When uploading data or connecting to data on the main metadata screen, in the Business View Pane, right-click
a dimension folder, point to Insert, and
then click New Levels Hierarchy.
The Hierarchy is added to the dimension folder.
- Right-click the Hierarchy, and then click Rename.
The Rename dialog box opens.
- Type the name of your new hierarchy and click OK.
Note: You can also turn an existing dimension into a dimension hierarchy. To do so, right-click the dimension, and then click Create Hierarchy.
- Drag individual columns into the new hierarchy in a logical order to populate it.
- To remove a field from the hierarchy, right-click the field, and then click Remove from Hierarchy.
- Once you have edited your metadata, click Next.
The Save As dialog box opens.
- Enter a name for the synonym in the File Name field and
click OK.A pop-up window opens, providing access to the following options:
- Create.
-
Allows you to create a report, chart, document, or visualization with your new Master File.
- Finish.
-
Closes the wizard.
Related Information:
Creating Folders and Assigning DV Roles
|
Topics: |
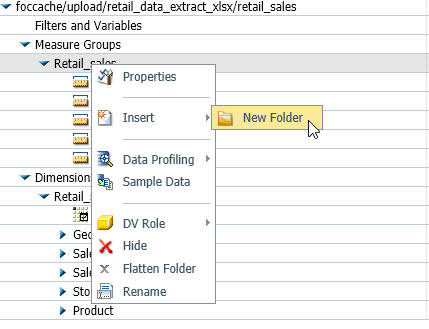
When using BV+ capabilities, specifically, when you are working in a Business View, you can create folders to organize your data. Folders function as segments to provide a view of the synonym and define the accessible fields and their relationships. Folder relationships are the same as segment relationships, with parent folders, child folders, and sibling folders. Once you create a new folder, you can add data fields and assign roles.
You can create a new folder by right-clicking a folder or field, clicking Insert, and then clicking Folder, as shown in the following image.
Assigning DV Roles
While you have total flexibility defining a structure using any fields from your data source, when you issue a report request against the synonym, the retrieval path for the data must conform to any constraints imposed by your DBMS entity diagrams and by the rules of WebFOCUS BUE retrieval.
Only the folders will be displayed in the WebFOCUS tools, not the real segments, and only the fields within the folder structure will be accessible for reporting.
You can assign a DV role to a folder or field by right-clicking the folder or field and assigning a DV role. The following image shows the context menu and options for a folder.
You can explicitly assign a DV role to a folder or field, or have it automatically inherit its role from its parent. If you explicitly assign a DV role, that role moves with the object if you drag it to another location within the BV+ structure. If you do not explicitly assign a DV role, the role changes as you move the object under a new parent, except if you drop it onto a field with the Drill Level role. If dropped onto a Drill Level field, the moved field inherits the Drill Level role.
You can assign the following DV roles.
- Dimension. A dimension field, when double-clicked or dragged onto the report or chart canvas in the WebFOCUS BUE tools, is automatically
added to the request as a vertical (BY) sort field.
A folder can be assigned the role Dimension.
A field can be assigned the role Dimension (Standalone) or Dimension (Drill Level). When it is assigned the role Dimension (Drill Level), it becomes part of a hierarchy, where the levels depend on the order of the fields in the folder. Then, when AUTODRILL is turned on, automatic drill-downs are created in the report or chart output. The following image shows the choices for DV role when you right-click a dimension field.
A folder can contain only one drill level hierarchy. However, you can use the same fields in multiple hierarchies by placing each hierarchy in a separate folder. A folder with a drill level hierarchy is not limited to just the hierarchy. It can contain other fields with different DV_ROLEs.
- Measure. A measure field, when double-clicked or dragged onto the report or chart canvas in the WebFOCUS BUE tools, will automatically be added to the request as an aggregated value (SUM), if it is numeric. If it is alphanumeric, it will be added as a vertical (BY) sort field. A folder or field can be assigned the role Measure.
- Attribute. An attribute field, when double-clicked or dragged onto the report or chart canvas in the WebFOCUS BUE tools, will automatically be added to the request as an aggregated value (SUM), if it is numeric, or as a vertical sort field (BY), if it is alphanumeric.
- Folder. A folder is a virtual segment in a BV+. It can be assigned the roles Dimension, Measure, or Attribute.
Note: When a folder is inserted as a child of a field, the attribute PARENT_FIELD describes this relationship. By default, such a folder and its fields will be assumed to have the Attribute role.
- None. If no role is assigned, the field or folder will inherit its role from its parent. If a role has been assigned, you can remove
it by selecting the option to inherit its role from its parent, as shown in the following image.
For more information about the Business View pane, see Wizard Metadata Screen Reference.
| WebFOCUS | |
|
Feedback |