Topics: |
In WebFOCUS BUE you can upload spreadsheets and delimited data files to the repository. After the spreadsheet is uploaded with the Upload wizard, you can append new data or replace data without changing the structure and parameters of the file. The Upload wizard is available from the Resources tree, under Quick Links, and the Open dialog box in InfoAssist+.
How to: |
With the Upload wizard, you can perform the following actions:
- You can Upload spreadsheets to the repository.
- You can append new data to the existing synonym.
-
Launch the Upload wizard in one of the
following ways:
- From the Resources tree, right-click a domain or folder, point to Upload, and then click Data.
- In the Open dialog box, in InfoAssist+, click Upload Data.
- On the Home page, under Quick Links, click Upload Data.
- Drag the file that you want to upload into the Upload pane or click Select Upload File, and navigate to the location of a file on your machine.
-
Click Next.
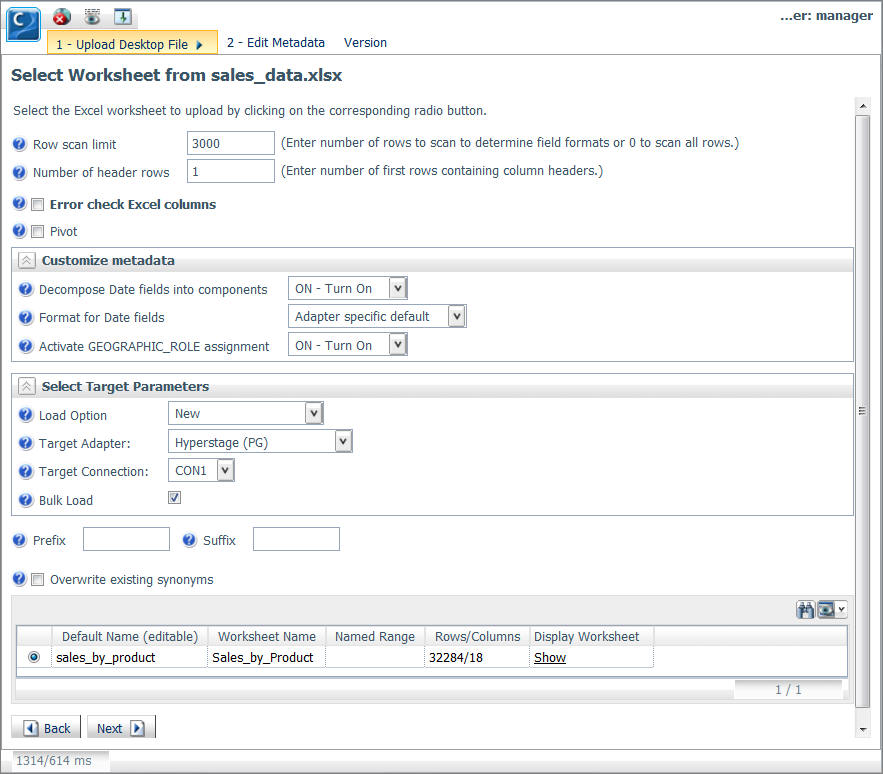
The Select Worksheet pane opens, as shown in the following image.
-
You can customize your worksheet by using the options
available on this pane.
The options include:
- Row scan limit
-
Indicates how many worksheet rows are scanned to determine the formats of the columns. Set this value to 0 if you want to scan all of the worksheet rows.
- Number of header rows
-
Sets the number of rows used as a header row in the worksheet. Set the value to 0 if a header is not used.
- Error check Excel columns
-
Produces informational messages, if the uploaded file contains inconsistent data, based on the first row of data.
- Pivot
-
If selected, transforms columns into rows for a better visualization of complex matrices.
- Customize metadata
-
Provides access to the following options:
- Decompose Date fields into components
-
Decomposes Date fields into Year, Quarter, Month, and Day components.
- Format for Data fields
-
Allows you to select a format in which the Date fields will appear.
- Activate GEOGRAPHIC_ROLE assignment
-
Assigns geographic roles based on column name analysis.
- Select Target Parameters
-
Provides access to the following options:
- Load Option
-
Provides access to the following options:
- New
-
Uploads a new worksheet to create a synonym.
- Append Existing Data
-
Adds new data to the existing synonym without changing the structure and parameters of the synonym.
- Target Adapter
-
Allows you to select a database, in which the unloaded data is stored in.
- Target Connection
-
Specifies a connection for the selected adapter.
- Bulk Load
-
Specifies the method of loading data.
- Prefix
-
Adds a prefix to the name of the synonym.
- Suffix
-
Adds a suffix to the name of the synonym.
- Overwrite existing synonyms
-
Overwrites the existing synonym with the same name.
- Default Name (editable)
-
Indicates the synonym name to be created, based on the worksheet name. You can change this default name. If a Prefix or Suffix value is used, it will be added to this name.
- Worksheet Name
-
Indicates the worksheet name, determined from the uploaded file.
- Named Range
-
Indicates an Excel Named Range to a specific group of cells within a worksheet.
- Rows/Columns
-
Indicates the number of rows and columns in the worksheet.
- Display Worksheet
-
Shows the data in the selected worksheet in tabular format. Double click the link to view the data.
-
Click Next.
If your upload is successful, the Categorize Fields into Measures, Dimensions and Hierarchies pane opens.
Note: If there are informational messages or if your upload is unsuccessful, the Status pane opens.
The Measure/Dimension View shows:
- The default set of measures (all numeric columns).
- The default dimension hierarchies, based on name pattern-matching and date-time analysis.
- The remainder of columns as individual dimensions.
-
Once you have defined the measures and dimensions, click Next.
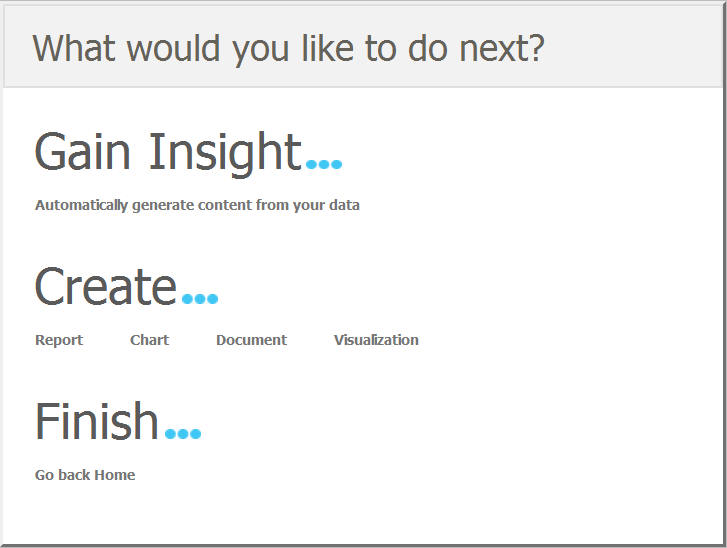
A pop-up window opens, providing access to the following options:
- Gain Insight
-
Automatically generates content from your data.
- Create
-
Allows you to create a report, chart, document, or visualization with your new Master File.
- Finish
-
Closes the Upload wizard.
- Launch the Upload wizard.
- Drag the file, containing the data that you want to append, into the Upload pane or click Select Upload File, and navigate to the location of a file on your machine.
-
Click Next.
The Select Worksheet pane opens.
- From the Load Option drop-down list, click Append Existing Data (Keep Metadata).
-
Click the Show File Picker button
 next to the Select Target Synonym
option, and select the synonym to which you want to append data.
next to the Select Target Synonym
option, and select the synonym to which you want to append data.
The path to the synonym appears in the Select Target Synonym field.
- Click OK to close the Select Target Synonym dialog box.
-
Click Next.
A pop-up window opens, providing access to the following options:
- Gain Insight.
-
Automatically generates content from your data.
- Create.
-
Allows you to create a report, chart, document, or visualization with your new Master File.
- Finish.
-
Closes the Upload wizard.
Note: If there are informational messages or if your upload is unsuccessful, the Status pane opens.
How to: |
The WebFOCUS Business User Edition automatically assigns geographic roles by analyzing the common location names in the uploaded data.
The following table shows the geographic roles that are assigned based on the field names.
|
Role Name |
Value |
Description |
|---|---|---|
|
Country |
COUNTRY |
Specifies country names. |
|
State/Province/Region |
STATE |
Specifies the names of provinces, states, regions, and first level administrative boundaries. |
|
County (USA Only) |
COUNTY |
Specifies the names of counties and county equivalents in the United States. |
|
Zip (USA Only) |
ZIP |
Specifies five-digit ZIP codes for the United States. |
|
Latitude |
LATITUDE |
Specifies the distance measured, north or south of the equator, in decimal degrees. |
|
Longitude |
LONGITUDE |
Specifies the angular distance of a point east or west of the meridian, at Greenwich in decimal degrees. |
|
City |
CITY |
Specifies the names of cities that are generally denoted by administrative boundaries. |
In addition to the default geographic roles, you can manually assign geographic roles to the fields that are not automatically recognized.
-
In the Categorize Fields into Measures, Dimensions
and Hierarchies pane, right-click a measure or dimension to which
you want to assign a geographic role, then click Geographic
Role.
The Set Geographic Role window opens, as shown in the following image.
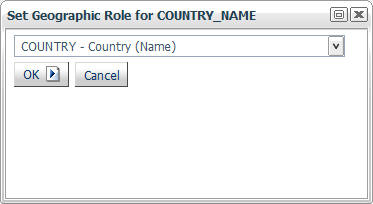
- From the drop-down list, select a geographic role that you want to assign to the field.
-
Click OK.
The geographic role is assigned, allowing the field to generate longitude and latitude coordinates for display on a map view in InfoAssist+.
How to: |
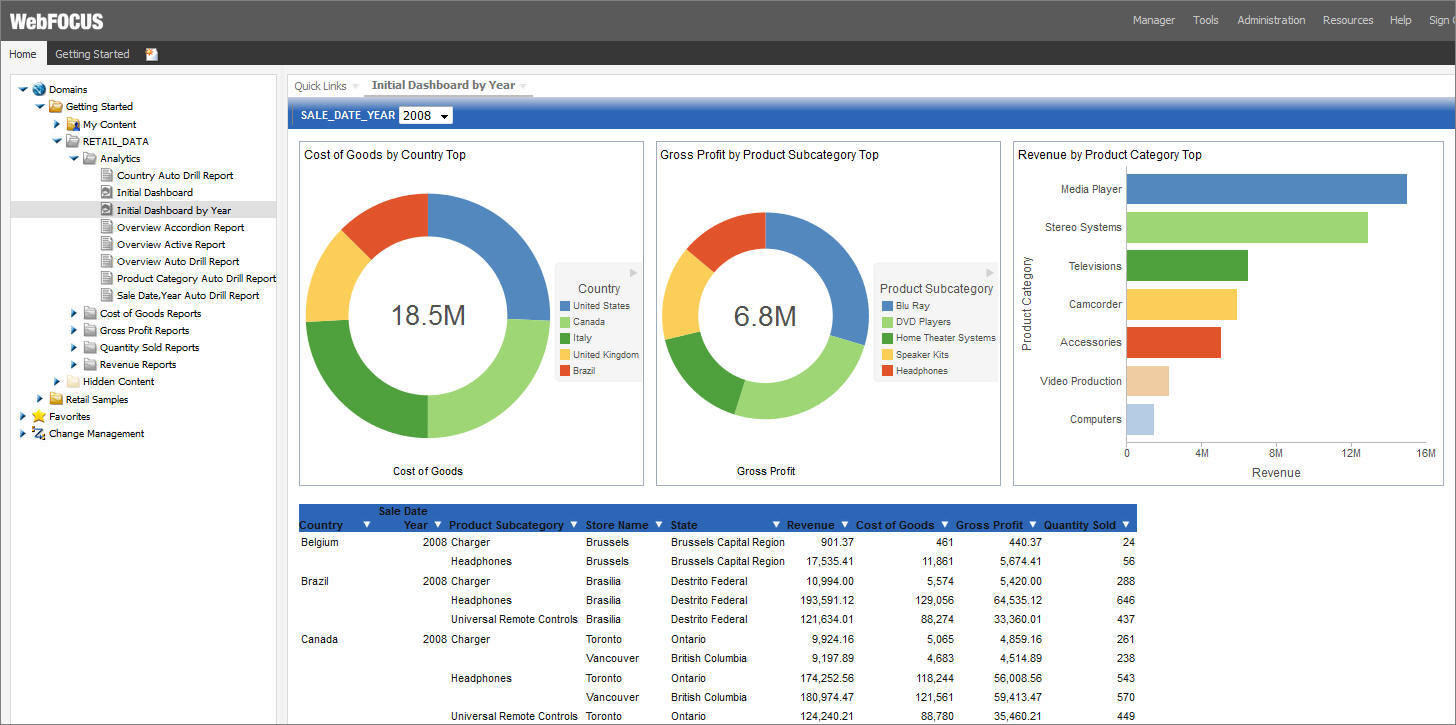
After uploading a spreadsheet to the repository, you have an option to automatically generate content from your new Master File. This option provides you with a number of sample charts, reports, and dashboards, that quickly help you to visualize your data. Depending on the structure of your synonym, a number of charts is created for each top level field in each hierarchy. Additionally, a group of overview reports and dashboards are also generated. You can view, edit, or delete this content. You can also use this content to create new dashboards.
-
Upload a spreadsheet, as described in How to Upload Excel Spreadsheets.
After the upload is complete, you are presented with a series of options, as shown in the following image.
-
Click Automatically generate content from
your data.
Sample content is generated in the same folder that you selected for your upload, and you are redirected to the Home page of the BUE portal, where you can interact with the sample generated content. If your data contains any dates, you will be presented with the Initial Dashboard By Year, as shown in the following image. Otherwise you will see the Initial Dashboard.
| WebFOCUS |
Feedback |