Topics: |
The data source being used determines the type of metadata that is required. For example:
- When the server accesses a relational data source, it needs to know how to interpret the data stored there. You must create a synonym that describes the structure of the data source and the server mapping of the data types.
- When the server invokes a transaction or procedure, it needs to know how to build the request, what parameters to pass, and how to format an answer set from the response. You must create a synonym that describes the layout of the request or response area.
Whatever your data source, the adapter you are using manages the synonym creation process for you, creating a synonym that meets your specific requirements.
Synonyms define unique names (or aliases) for each table, view, transaction, or procedure that is accessible from the server. Synonyms are useful because they hide the underlying data source location, identity, transaction, or procedure from client applications. They also provide support for extended metadata features of the server, such as virtual fields and additional security mechanisms.
Note: Although all synonym creation panes have the same look and feel, the parameters are specific to each adapter. To obtain detailed information for an adapter, click the question mark (?) next to a parameter.
Topics:
How to: |
The Connect to Data wizard provides a step-by-step process for configuring adapters that connect to data sources, that you can use to build reports, charts, and visualizations in InfoAssist+.
Using the Connect to Data wizard you can perform the following steps:
- Connect to SQL. Configures an adapter, creates a new connection, or changes connection parameters.
- Import Metadata. Creates a synonym for one or more data sources.
- Edit Metadata. Enhances metadata by adding measures, dimensions, and dimension hierarchies.
Note:
- A measure is a numeric value, such as Gross Profit or Cost of Goods Sold, that you may want to aggregate. All numeric values that can be summed are measures. Numeric fields that cannot be summed, such as product number and miles per gallon, are not treated as measures. Instead, they may be used in the same way as dimension fields to analyze measures. It is up to you to understand your data and determine whether each numeric field can be summed. Related measures can be organized into measure groups. For example, Gross Profit and Cost of Goods Sold can be part of a Sales measure group.
- A dimension is a way to categorize data. You can use a dimension to analyze and compare measures. Generally, any field that is not a measure, usually an alphanumeric field such as product, is a dimension. Dimensions can be organized into hierarchies to define the relationships between the fields in the hierarchies. For example, a Geography hierarchy can contain the Continent, Country, State, and City dimensions. You can also define dimension fields that are not part of a dimension hierarchy.
- You can assign dimension attributes to any dimension field, whether or not it is in a hierarchy. When applied to a field, attributes provide supplementary information that can be used for analysis or display. For example, in a Geography hierarchy, which includes the Country, State, and City dimensions, Population can be assigned as an attribute of the City dimension. It is up to you to determine whether a measure as an attribute is useful. It depends on the design of the data source.
These steps are displayed in the navigation pane, as shown in the following image. The step that you are on is highlighted. Click any step to go directly to that step.
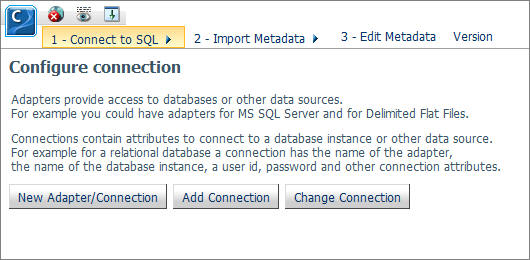
As you complete the tasks for each step, the tool automatically proceeds to the next step.
You can launch the Connect to Data wizard in one of the following ways:
-
From the Resources tree, right-click a domain or folder, point to Metadata, and then click Connect to Data.
-
On the Home page, on the Quick Links tab, click Connect to Data.
-
In the Open dialog box, in InfoAssist+, click Connect to Data.
The first step in the Connect to Data wizard is creating a connection to your data. In this step, you can configure an adapter, add a connection, or change a connection.
-
From the Configure connection pane,
click New Adapter/Connection.
The Configure Adapter pane opens, as shown in the following image.

-
Select the radio button for the adapter and click Next.
Note: You can click the Adapter, Release/Dialect, Adapter Category, or Adapter Sub-category columns to sort the available adapters.
The Add to Configuration pane opens.
- Enter the parameters for the specific adapter and click Configure. For information on the parameters, see the online Help.
-
From the Configure connection pane,
click Add Connection.
The Add Connections pane opens.
- Select the radio button for the adapter and click Next.
- Enter the parameters for the specific adapter and click Configure.
-
From the Configure connection pane,
click Change Connection.
The Edit Connections pane opens.
-
Select the radio button for the connection and click Next.
Note: You can click the Adapter, Connection, Connection string, or Profile columns to sort the available connections.
- Change the parameters for the specific connection and click Configure.
The first pane in this step is the Select connection to create synonyms pane. In this step, you select the connection and metadata that you want to import for further use.
-
Select the radio button for the adapter
and click Next.
Note: You can click the Adapter, Connection, or Connection string columns to sort the available adapters.
The Select Synonym Candidates pane opens.
-
Select or enter the parameters for each screen and click Next.
The Create Synonym pane opens.
- Select one or more synonym check boxes.
-
Click Next.
The synonyms are created in the application directory.
The first pane in this step is the Categorize Fields into Measures, Dimensions and Hierarchies pane. In this step, you can modify the view of your measures and dimensions.
The Measure/Dimensions window shows a logical, generic cube, structure of your synonym. By default, the numeric fields are represented as measures, and non-numeric fields are categorized as dimensions and dimension hierarchies, based on joins and selected synonyms. Dimensions and dimension hierarchies reside inside dimension folders, and can include attributes. The icons, located next to each synonym component, represent its type. In the following table, the first column lists the icons, and the second column describes what they represent.
|
Icon |
Identifies |
Description |
|---|---|---|
|
|
Measure group |
Contains individual measures. |
|
|
Measure |
Resides inside a measure group. Measures can be moved between measure groups and between measures and dimensions areas. |
|
|
Dimension folder |
Contains dimensions, dimension hierarchies, and attributes. |
|
|
Dimension Hierarchy |
Resides inside the dimension folder and contains individual dimensions and associated attributes. |
|
|
Dimension |
Resides inside the dimension hierarchies. Dimensions can be moved between dimension folders, between and outside dimension hierarchies. You can move a dimension into a measure group and turn it into a measure. You can also move a dimension inside an attribute folder and turn it into an attribute. |
|
|
Attribute folder |
Contains individual attributes associated with a dimension. |
|
|
Attribute |
Resides inside an attribute folder. Attributes can be moved between attribute folders. If you move an attribute outside an attribute folder, it inherits the identity of a hierarchical level to which it is moved. |


The following image shows an example of a Measure/Dimensions window showing all of the categorizations that are described above.
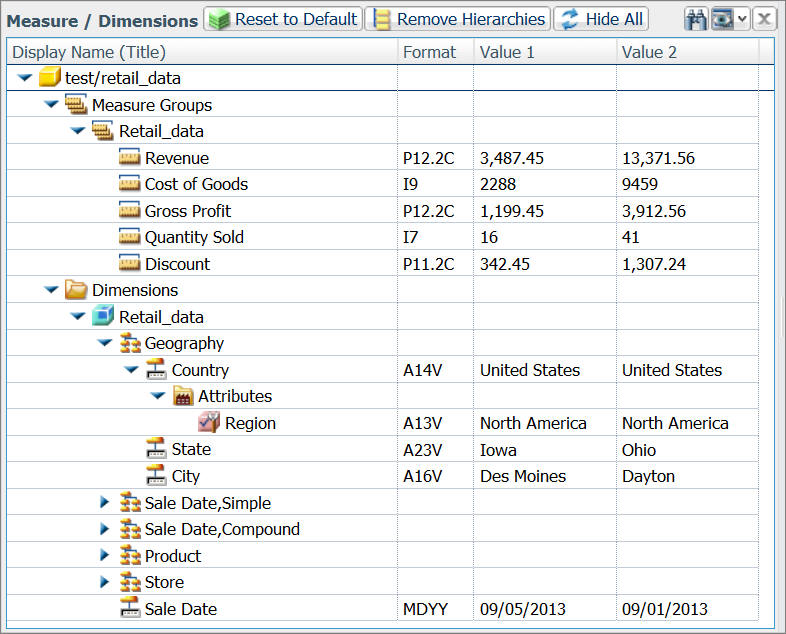
From the Measure/Dimensions window, you can:
- Click the Reset to Default button
to undo all changes and refresh the view back to the initial categorization
of measures and dimensions.
Note: Dimensions are grouped in hierarchies based on name pattern matching and date-time analysis.
- Click the Remove Hierarchies button to revert the hierarchical grouping of dimensions to a list of individual columns.
- Click the Hide All button to move all
columns back to the Table/Column window.
Note: The Table/Column window is hidden by default. To display the Table/Column window, do the following: on the Ribbon, in the Options group, click View, point to Table/Column Window, and then click Show.
- Drag dimensions, hierarchies, and other columns within the pane to rearrange the order.
- Select multiple list items by holding the Shift key.
- Add new variable definitions, segments, fields, defines, computes, and filters to the Measure/Dimensions window.
- Use the shortcut menu for more actions.
Using shortcut menu options, you can:
- Right-click the Measure Groups folder,
point to Insert and click New
Measure Group, or click Sample Data.
Note: The sample data displays in the Output Window, which is docked in the right pane by default. To undock, maximize, or hide the Output Window, do the following: on the Ribbon, in the Options group, click View, point to Output Window, and then click Show Floating, Show Maximized, or Hide.
- Right-click a measure and click Properties, Insert (to gain access to the Filter, Define, Group Values, and Compute options), Pivot, Geographic Role, Sample Data, Data Profiling, Impact Analysis, Rename, Hide, Cut, or Paste. The Hide option moves the measure to the Table/Column window.
- Right-click a dimension and click Properties, Create Hierarchy (to learn more about creating a hierarchy, see How to Create a Hierarchy), Insert (to gain access to the Filter, Define, Group Values, and Compute options), Pivot, Geographic Role, Sample Data, Data Profiling, Impact Analysis, Rename, Show/Hide Attribute, Hide, Cut, or Paste. The Hide option moves the dimension to the Table/Column window.
- Right-click a hierarchy and click Properties, Remove Hierarchy, Sample Data, Rename, Hide, Cut, or Paste. The Hide option removes the hierarchy and moves the columns contained in the hierarchy to the Table/Column window.
From the Ribbon, you can:
- View the session log.
- Click Test in the Diagnostics group to view the Master file and Access file of the current synonym.
- Undo or redo the previous action.
- Create a new Define, Compute, or a Variable field.
- Click Joins in the Metadata group to open the Modeling View window and create a cluster by joining two or more existing data sources. To learn more about creating a cluster, see How to Create a Cluster.
- Create DBA statements.
- Click Pivot in the Metadata group to access the pivot options for transforming columns into rows.
- Stop existing requests and view sample data.
- Access the View options to customize the Categorize Fields into Measures, Dimensions and Hierarchies pane.
- Access Advanced Options to customize the synonym.
When you create a synonym, the Connect to Data wizard creates dimension hierarchies automatically, based on name pattern-matching and date-time analysis. Optionally, you can create additional hierarchies to organize individual columns, enable drill-downs in your data, and add more flexibility to your synonym.
-
In the Measure/Dimensions window, right-click
a dimension folder, point to Insert, and
then click New Levels Hierarchy.
The Hierarchy1 is added to the dimension folder.
-
Right-click the Hierarchy1, and then click Rename.
The Rename dialog box opens.
-
Type the name of your new hierarchy and click OK.
Note: You can also turn an existing dimension into a dimension hierarchy. To do so, right-click the dimension, and then click Create Hierarchy.
- Drag individual columns into the new hierarchy in a logical order to populate it.
- To remove a field from the hierarchy, right-click the field, and then click Remove from Hierarchy.
Optionally, you can join two or more tables together to create a cluster.
-
On the Ribbon, in the Metadata group, click Joins.
The Modeling View dialog box opens.
-
Click Insert Child.
The Insert Child dialog box opens.
-
Click a Master File from the list, and then click OK.
You can select several Master Files by holding the Shift key.
The completed cluster displays in the Modeling View dialog box, as shown in the following image.
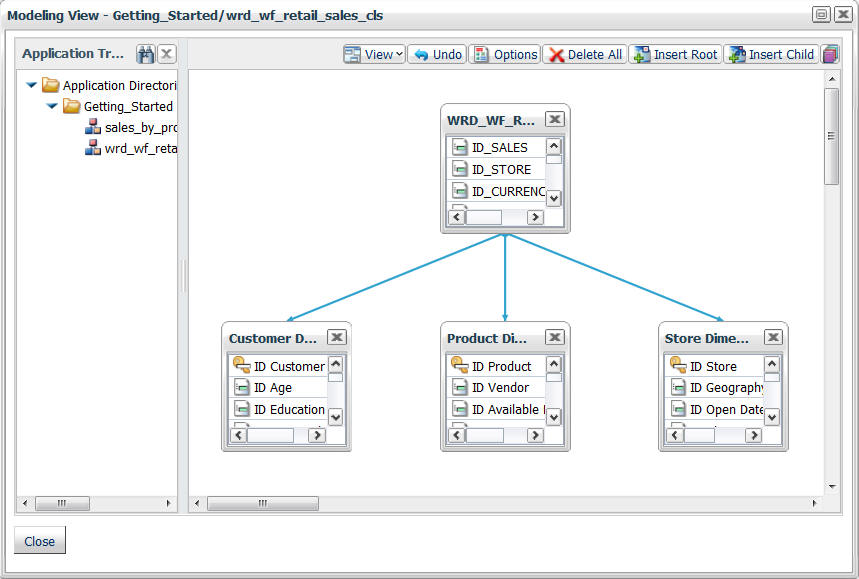
-
Click Close.
The new columns are added to the Table/Column window.
- Drag columns to the Measure/Dimensions window to modify the synonym.
-
Once you have edited your metadata,
click Next.
The Save As dialog box opens.
-
Enter a name for the synonym in the File Name field and
click OK.
A pop-up window opens, providing access to the following options:
- Create.
-
Allows you to create a report, chart, document, or visualization with your new Master File.
- Finish.
-
Closes the Connect to Data wizard.
How to: |
You are able to edit or delete previously created synonyms using the shortcut menu.
-
To edit an existing synonym,
right-click a domain or folder, point to Metadata,
and then click Edit.
The Reporting Server window opens. A list of synonyms associated with the folder displays in the Applications directory.
-
Right-click a synonym and click Open,
as shown in the following image.
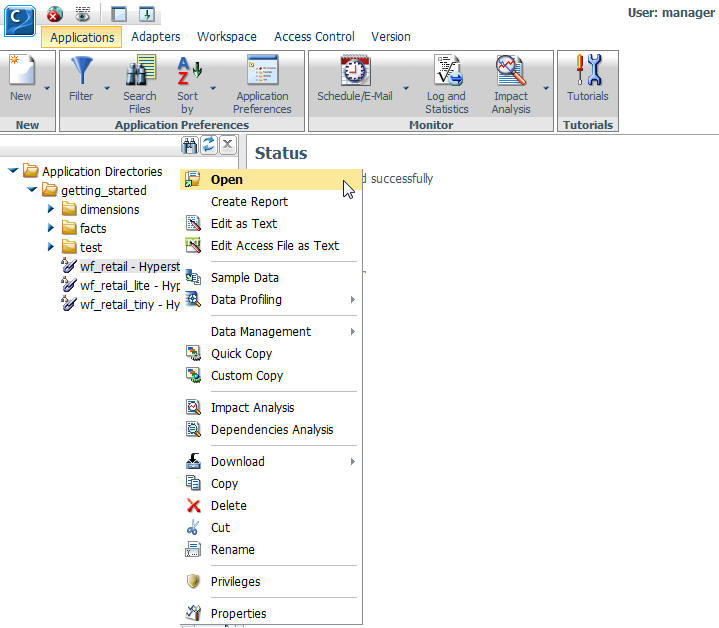
The Categorize Fields into Measures, Dimensions and Hierarchies pane opens, where you can modify your synonym. For more information on the Categorize Fields into Measures, Dimensions and Hierarchies pane, see Step Three: Edit Metadata.
- To save your synonym, click File, and then click Save.
- Close the Reporting Server window.
-
To delete an existing
synonym, right-click a domain or folder, point to Metadata,
and then click Edit.
The Reporting Server window opens. A list of synonyms associated with the folder displays in the Applications directory.
-
Right-click the synonym that you wish to Delete, point
to Data Management, and then click Delete
All Data.
A confirmation window opens, alerting you that you are deleting every row of data.
- Click OK to proceed.
- To remove the synonym from the view, right-click this synonym again and then click Delete.
- Close the Reporting server window.
The following table lists the configurable adapters in WebFOCUS Business User Edition.
|
Category |
Adapter | |
|---|---|---|
|
SQL |
1010data |
MS SQL Server |
|
Apache Drill |
MS SQL Server ODBC | |
|
Apache Hive |
MySQL | |
|
Apache Phoenix |
Netezza | |
|
C9 |
Nucleus/SAND | |
|
Cache |
ODBC | |
|
DB2 |
Oracle | |
|
Excel (via ODBC) |
Oracle TimesTen | |
|
Google BigQuery |
parAccel | |
|
Greenplum DB |
PostgreSQL | |
|
Hyperstage |
Progress | |
|
Hyperstage (PG) |
PSQL | |
|
IBM i Access |
SQLBase | |
|
Informix |
Sybase | |
|
Ingres |
Teradata | |
|
JBoss |
Transoft | |
|
JDBC |
Vertica | |
|
MongoDB |
UniData | |
|
MS Access | ||
|
XML Based |
JSON |
XML |
|
ERP |
Salesforce.com | |
|
OLAP |
SQL Server Analysis Services | |
|
Procedures |
REST |
Web Services |
|
Sequential and Indexed |
Delimited Flat File |
Flat File |
|
Excel (via direct retrieval) |
MicroFocus CISAM | |
|
DBMS |
LDAP |
Lotus Notes |
|
Social Media |
Words Analysis | |
| WebFOCUS |
Feedback |