Topics: |
The ReportCaster Console is the interface that provides access to the tools that administer the Distribution Server and manage schedule job logs, blackout dates, and execution Ids.
Note: Throughout this section, the ReportCaster Console will be referred to as the Console.
The following tools are accessible from the Console.
- Server Status
- Job Status
- Job Logs
- Blackout Periods
- Global Updates
- Purge Logs
In WebFOCUS Business User Edition configurations licensed for ReportCaster, authorized users can access the ReportCaster Console through the Administration Console, from the Administration option on the menu bar, as shown in the following image.
Depending upon your privileges, these options are also available from the ReportCaster Status option on the Tools menu, as shown in the following image.
The Console intuitive ribbon displays in a new browser window, as shown in the following image. The ribbon displays a tab for each tool the user is authorized to access.
Topics: |
The Server Status tool allows Managers to select a Distribution Server to restart, suspend, or stop. The tool also enables Managers to view traces or refresh data, as shown in the following image.
The Server Status tool, accessed by selecting the Server Status tab in the Console, enables you to view the status of the Distribution Server. The Server Status tool also provides details about the Distribution Server, such as the host name and port number, the status, and the number of jobs that are running and in the queue. The Distribution Server information includes:
-
Distribution Server. The
name used to identify the server in the Console. Primary is the name given to the server
listed in the ReportCaster Configuration tool setting (Primary
Distribution Server).
Note: When the Distribution Server attempts to make an SMTP connection to an Email server, the connection will timeout after five minutes.
- Host and Port. The host name and port number where the Distribution Server is installed.
-
Mode. The
state and function of the Distribution Server. Options include:
- Full Function. Indicates that the Distribution Server is up and functioning. When you configure ReportCaster with a secondary Distribution Server, this indicates that the server is acting as the primary Distribution Server.
- Down. Indicates that the Distribution Server is stopped.
- Running. The number of scheduled and on demand jobs that are currently running.
- Queued. The number of scheduled and on demand jobs that are in the Distribution Server queue.
-
Services. The
services currently running on the Distribution Server. Options include:
- Cache Cleaner. The Distribution Server uses this service to refresh the IBFS Cache. The frequency at which the cache is refreshed is controlled by the setting IBI_Repository_Sync_Interval in the Administration Console.
- Console. The Distribution Server uses this service to listen for communication from the ReportCaster application or API.
-
Dispatcher. The
Distribution Server uses this service to execute scheduled jobs.
Note: Depending on your server configuration, you may have one or more additional Dispatchers listed in the Server Status Dialog box.
- Reader. The Distribution Server uses this service to poll the Repository.
-
Status. The
status of each service currently running on the Distribution Server.
Options include:
- Ready. The service is available.
- Standing By. The service is standing by.
- Suspend. The service is suspended.
- Listening. The Console service is actively listening.
- Polling. The Reader service is active.
- Monitoring. The Repository Monitor is active.
- Waiting. Displayed when a job in the running queue is waiting for a connection to the reporting server. Occurs when a multi-task schedule is started because a connection is available to the reporting server in the first task but then waits because a connection is not available to the reporting server in the second task.
From the Server Status interface, you can perform the following tasks:
- Refresh. Retrieves the most current information and refreshes the Distribution Server status with this information.
- Restart. Recycles the Distribution Server and the Application Server.
- Suspend. This option is always available. Suspends the Distribution Server services, but the server remains running. When you suspend a server, the Suspend button label will change to Resume.
-
Stop. Brings
the Distribution Server completely down.
Note: When you stop the Distribution Server using this option, you must restart it from the machine where it resides. You cannot restart the Distribution Server remotely.
-
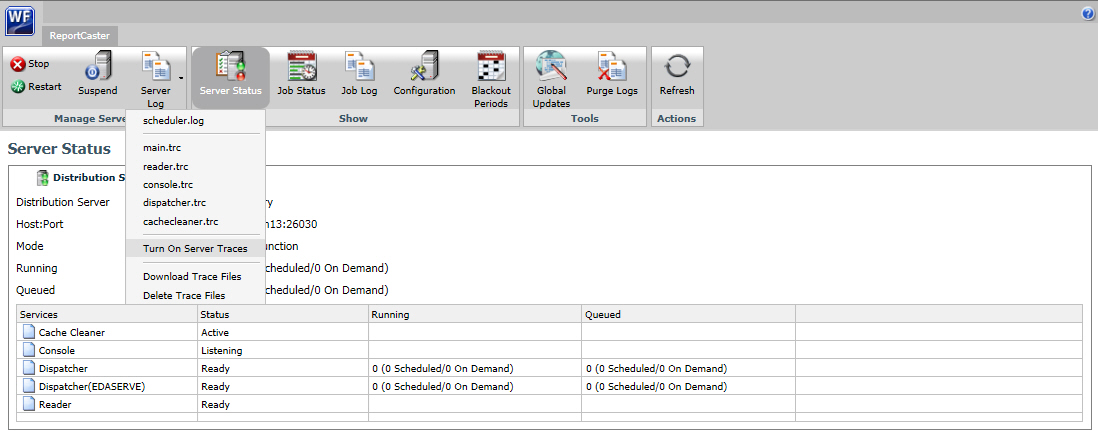
View Trace. Allows
you to view trace information for the scheduler.log, main.trc, reader.trc,
console.trc, and dispatcher.trc files. You can also turn the Distribution
Server traces on or off. For more information, see How to Turn Distribution Server Traces On or Off.
Note: Distribution Server traces are tracked separately from Job traces using this functionality. You do not need to turn on job traces to see distribution server traces.
- Help. Opens the Console Server Status online documentation.
- From the ReportCaster Console, select Server Status.
- From the Distribution Server list, select a server.
- On the toolbar, click the down arrow on the Server Log button.
-
Click Turn
On Server Traces to turn the Distribution Server traces
on, as shown in the following image.
To disable the Distribution Server traces, follow steps 1 and 2, and then hover over Turn On Server Traces and click Turn Off Server Traces.
The Distribution Server has separate job queues for each Reporting Server, as well as an additional queue for tasks that do not require a Reporting Server, as shown in the following image. Therefore, there will always be at least one job thread available for each Reporting Server, in addition to at least one thread for non-server based jobs. No one Reporting Server can have all of the available job threads consumed by jobs associated with that server.
The Server Status interface enables you to stop and restart the Distribution Server, as follows:
-
To stop the Distribution Server, click the Stop button. A window opens, asking you to confirm that you want to stop the server. Click Yes.
Note: When you stop the Distribution Server using this option, the Server Status Restart option cannot be used to restart the Distribution Server. To start the Distribution Server, log on to the machine on which the Distribution Server is installed.
- To suspend the Distribution Server, click the Suspend button. A window opens, asking you to confirm that you want to suspend the server. Click Yes.
-
To restart the Distribution Server, click the Restart button. A window opens, asking you to confirm that you want to restart the server. Click Yes.
When you restart the server, the Distribution Server and the ReportCaster Application are restarted.
-
To obtain the most current information about the Distribution Server, click Refresh.
- Select a server that is running.
-
From the
toolbar, click Restart to restart the server.
A window opens, asking you to confirm that you want to restart the server.
- Click Yes.
- Select the server in Full Function mode.
-
On the toolbar,
click Suspend.
A window opens, asking you to confirm that you want to suspend the server.
-
Click Yes.
The reader service is suspended and the toolbar button changes to Resume.
To resume polling the repository for schedules, click Resume. Click Yes to confirm.
Another resource for tracking schedules is the schedule job status. The schedule status provides a list of scheduled jobs that are in the Distribution Server queue. Status information includes the Schedule ID, the time it started running, and the status of the job.
The schedule information includes:
- Job Id. The ID assigned to the job.
- Schedule ID. A unique ReportCaster generated key assigned to the job when it was scheduled.
- Description. The description provided when the schedule was created.
- Priority. The priority level of the schedule. 1 is the highest and 4 is the lowest priority.
- Start Time. The time that the schedule run began.
- Owner. The name of the user who owns the schedule.
-
Status. The
status of the scheduled job. It contains one of the following values:
- Running. The scheduled job is currently running.
- Queue. The scheduled job is waiting for a thread to become available to run the request.
- Server Name. The Reporting Server to which the job has been submitted.
The Job Log tab enables you to view the logs of executed jobs belonging to you or to users whose job logs you are authorized to see. You can view log and trace information, open job logs, delete job logs, refresh job logs, or access related help for job logs on the Job Log tab. You can also view log and trace information for the daily and on-demand Log Purge jobs. The Log Purge log can be accessed from the system folder. The logs for other jobs can be accessed under the folder of the user to whom the job belongs.
Note: The Job Log tab supports the functionality of a multiple selection, whereby you can open or delete multiple files simultaneously.
The job logs information includes:
- Job Id. The ID assigned to the job.
- Start Time. The time that the schedule was run.
- Job Duration(seconds). The amount of time needed to complete a job.
-
Job
Status. The status of the job when it completed processing.
- Success. No errors occurred during the scheduled job processing.
- Error. One or more errors occurred during the scheduled job processing. No report was generated or distributed.
- Warning. One or more warnings occurred during the scheduled job processing. A report was generated and distributed.
Topics: |
|
The Configuration tool enables Managers to view and manage the configuration of the Distribution Server, Servlet (deployed in WebFOCUS Business User Edition web application) interfaces and tools. Options that Managers can modify include Distribution Servers, Repository Settings, General Preferences, Email Distribution, Notification, and other options, as shown in the following image.
In the Configuration tab on the ReportCaster Console ribbon, a series of icons enable you to perform the following tasks.
Note: When you select Configuration in the ReportCaster Console ribbon, the Manage Configuration group displays on the left-hand side. Clicking Server Status, Job Status, Job Log, or Blackout Periods will change the name and functionality of this group, depending where you are in the interface. These options all appear in the Show group of the ribbon.
-
Manage Configuration group
- Save. Saves any changes made to the configuration. You will receive a message asking you to confirm the save. You must save the changes to the configuration settings as part of the process to implement the change. For details, see Changing Configuration Settings
- New. Creates a new Reporting Server. This option is only active when working in the Data Servers folder.
- Remove. Deletes a Reporting Server from the ReportCaster configuration. You will receive a message asking you to confirm the deletion. This option is only active when working in the Data Servers folder.
- Test. Tests the connection to the selected server or repository. This option is only active when working in the Data Servers, Repository Settings, and LDAP Settings folders. You may be prompted for a user ID and password to connect to a specified server. You will receive a message describing whether the test succeeded or failed.
- Restart. Restarts the Distribution Server and ReportCaster to implement changes to the server configuration. You can also select Restart from the Action menu. For more information, see Changing Configuration Settings.
-
Tools group
- Global Updates. Authorized users can make global updates in the Global Updates interface for the Mail Server, Printer, Email Address, Email from, and Data Server values stored in schedules and distribution lists.
- Purge Logs. Provides on-demand capability for purging logs. You can also specify a number of days (past) for which to purge logs. For example, if you want to purge logs for the past month, you would use the default number of days, which is 30. You can also specify an option for traces: Default Traces, No Traces, or Trace On. For more information, see How to Purge Logs on Demand.
-
Actions group
- Refresh. Refreshes the settings to reflect the last saved configuration settings.
- Help. Opens the online Help file. This option is only available when accessing the configuration tool through the ReportCaster web application. It is not available when accessing the tool from the Windows Programs menu or by running editit.bat or the UNIX editit script file from the /utilities directory within the ReportCaster Distribution Server installation.
The Configuration tab provides access to configuration settings through the following folders:
- Distribution Servers. Defines and configures the Distribution Server.
- General Preferences. Specifies which Address Book access types, distribution formats, and methods will be available to a user creating a schedule. In this folder, you can also specify whether schedule group blackout dates can be defined, and if ReportCaster scheduling options will include the ability to distribute a PDF file directly to a printer. For details on these settings, see General Preferences.
- Email Distribution. Configures email settings, such as the default email host, number of attempts to distribute to an email host, and security information. For details on these settings, see Email Distribution.
- Notification. Configures notification settings, such as the notification email host and default notification type. For details on these settings, see Notification.
- Zip Settings. Provides settings to configure how Zip files will be created and named. For details on these settings, see Zip Settings.
- Other Schedule Defaults. Defines the default end date and time of a ReportCaster schedule. For details on these settings, see Other Schedule Defaults.
- Log Purge. Allows you to specify the time and period that log files will be automatically purged. For details on these settings, see Log Purge.
- LDAP Setting. Allows you to configure ReportCaster self-service users to be authenticated and authorized against an LDAP data source rather than the WebFOCUS Business User Edition Repository. You can also configure ReportCaster to retrieve email address information from an LDAP data source. For details on these settings, see LDAP Setting.
- Data Servers. Allows you to configure multiple Reporting Servers, including cluster servers. For details on these settings, see Data Servers Settings.
To implement changes to the ReportCaster server configuration settings, you must save the changes, and then restart the Distribution Server and the ReportCaster web application. Use the following steps to save any configuration changes.
- After you make changes
to any of the configuration settings within a Configuration folder,
click the Save icon in the Manage Configuration
group toolbar.
A window opens, asking you to confirm the save.
- Click OK.
A window opens, explaining that you must restart the Distribution Server and the ReportCaster Web Application in order for the changes that you saved to take effect.
- Click OK.
- Click the Restart icon
in the Manage Configuration toolbar.
A window opens, asking you to confirm that you want to stop all running jobs and restart.
- Click Yes.
- Notify all users that are currently logged that they must restart their sessions to obtain the new configuration information. This is required because user sessions have information cached pertaining to the ReportCaster configuration. The user interfaces must be restarted to obtain any updated configuration information.
Several of the Configuration tab folders provide the
option to change the default user ID and/or password. To change
a default user ID settings, click the  icon
that appears to the right of the setting field. This opens the User
dialog box, where you can type a new user ID and password. When
your changes are complete, click OK to exit
the User dialog box. Remember to save your changes and restart the
Distribution Server to implement any changes.
icon
that appears to the right of the setting field. This opens the User
dialog box, where you can type a new user ID and password. When
your changes are complete, click OK to exit
the User dialog box. Remember to save your changes and restart the
Distribution Server to implement any changes.
The Distribution Servers folder, shown in the following image, contains the settings that define and configure the Distribution Server. The Server Status option, located on the ribbon, provides the ability to restart the Distribution Server, suspend distribution, stop distribution, switch servers, and refresh data. For more information, see Server Status.
The Distribution Servers folder contains the following configuration settings.
|
Setting |
Optional or Required/Default Value |
Descriptions and Possible Values |
|---|---|---|
|
Primary Distribution Server section | ||
|
Host |
Required. |
Host name of the primary Distribution Server. |
|
Port |
Required. |
Port number of the primary Distribution Server. |
|
Reader Interval |
Required. Default value is 1 minute. |
Polling interval (in minutes) for the ReportCaster Distribution Server to check for scheduled jobs. An acceptable value is any positive integer from 1 to 999999. Negative numbers and zero are not allowed. Note: This setting is also available in the Administration Console. |
|
Recovery |
Default value is OFF. |
On. During startup, the ReportCaster Distribution Server recovers scheduled jobs that were processed but not completed. Off (Default). During startup, the ReportCaster Distribution Server does not recover any scheduled jobs. Note: This setting is also available in the Administration Console. |
|
Processing for No Report to Distribute |
Required. Default value is Error. |
Specifies whether the No Report to Distribute message from the WebFOCUS Reporting Server is categorized as an error or a warning. This is a global setting, relevant to all schedules. Possible values are:
These settings also apply to burst reports when there is a No Report to Distribute message for an individual burst value. |
|
Max Messages per Task from Data Server |
Required. Default value is 1000 |
Controls the number of messages for each task from the Data Server written to the ReportCaster log file. |
|
Setting |
Optional or Required/Default Value |
Descriptions and Possible Values |
|---|---|---|
|
Scan-back section | ||
|
Scan-back Type |
Required. Default value is On. |
Possible values are:
|
|
Scan-back Interval |
Default value is 15, 24 hour periods. |
If the Distribution Server is unavailable for a period of time, this is the number of 24 hour periods (beginning with the Distribution Server restart time) that you want the Distribution Server to scan for jobs not yet run and run them. Note: This setting is also available in the Administration Console. |
|
Setting |
Optional or Required/Default Value |
Descriptions and Possible Values |
|---|---|---|
|
Additional Settings folder | ||
|
SSL Certificate section | ||
|
The Console Requires Secure SSL Connection |
Optional |
Select this check box to encrypt the communication between the ReportCaster application and the ReportCaster Distribution Server. After enabling secure communication and saving the changes, you must manually restart the ReportCaster application and the ReportCaster Distribution Server. |
|
SSL Certificate |
Required if The Console Requires Secure SSL Connection check box is selected. |
A default SSL Certificate is supplied by the installation procedure. You can optionally replace the default certificate with your own certificate to activate secure communication. |
|
Schedule Job Traces |
Default value is Off. |
|
|
Hold Repository Connection |
By default, this option is selected. |
Selected. The database connection is kept open throughout the execution of the schedule, including obtaining Address Book information and writing information to the log files. Not selected. The database connection is dropped before executing the schedule. A new connection is made after the schedule is executed to obtain Address Book information and write information to the log files. |
The General Preferences folder in the Configuration tab, as shown in the following image, contains settings that determine which distribution formats and methods will be available to a user.
The General Preferences folder contains the following configuration settings.
|
Setting |
Optional or Required/Default Value |
Descriptions and Possible Values |
|---|---|---|
|
Allow PDF Distribution Directly to a Printer |
Required. By default, this option is selected. |
When selected, PDF is a selectable format for the Printer distribution method. This enables a PDF file to be distributed directly to a printer. The printer must have the appropriate driver to print PDF files. |
|
Distribution Formats |
Optional. All formats are enabled, by default. |
Specifies what report and graph formats are available to users. |
|
Distribution Methods |
Optional. All distribution methods are enabled, by default. |
Specifies what distribution methods are available to users. |
The Distribution Formats setting in the General Preferences folder enables users to specify what report and graph formats are available to users and groups.
This setting only applies to WebFOCUS (Repository) procedures. By default, all report and graph formats are enabled (selected). A minimum of one report or graph format must be selected.
Note: If a Format is cleared after a schedule using that Format has been created, the schedule will fail when it is run. A message in the log will indicate how to fix the problem.
-
In the General
Preferences folder, click the icon to the right of the Distribution
Formats field.
The ReportCaster - Report/Graph Formats dialog box opens, as shown in the following image.
-
Using the
Styled Formats drop-down list, you can select Specialized
Formats, Non-styled Formats,
or Graph Images. Optionally, you can keep
the default, Styled Formats.
By default, Styled Formats are displayed with each format type selected.
- To enable or disable styled formats, select or clear the check box for one of the listed formats.
-
To enable or disable Non-styled Formats,
which do not support styling using WebFOCUS StyleSheet commands,
select Non-styled Formats from the drop-down
list. By default, the Non-styled Formats are displayed with each
format type enabled, as shown in the following image.
-
To enable or disable graph images,
which are created by a WebFOCUS BUE graph request, select Graph
Images from the drop-down list. By default, the graph
image formats are displayed with each format type enabled, as shown
in the following image.
-
When your
selections are complete in the Report/Graph Formats dialog box,
click OK.
The changes are saved and the Report/Graph Formats dialog box closes.
- To implement the configuration changes, restart the Distribution Server and WebFOCUS BUE web application.
The Distribution Methods setting, in the General Preferences folder, enables authorized users to specify the distribution methods that are available to users and groups. If a method is cleared after a schedule using that method has been created, and Only run schedules for selected Distribution Method is selected, the schedule processing will not run the scheduled tasks. A message in the log will indicate that the distribution method is not configured for use. In addition, a schedule that has multiple distributions will not run if one of the distribution methods is cleared in the Distribution Methods drop-down menu, in the General Preferences folder, of the Configuration tab.
By default, all distribution methods are enabled (selected).
Note: A minimum of one distribution method must be selected.
The Repository option only appears if these products are enabled. Repository is an optional product component that is installed with the WebFOCUS BUE Client.
-
In the General
Preferences folder, click the icon to the right of the Distribution
Methods field.
The ReportCaster - Schedule Distribution Methods dialog box opens, as shown in the following image.
-
To enable or disable specific distribution
methods, select or clear the check box for one of the listed options.
Note: At least one schedule distribution method must be selected.
- Optionally, select the Only run schedules for selected Distribution Methods check box to limit the schedules running to those that have at least one of the Distribution Methods selected.
-
When your
selections are complete in the Schedule Distribution Methods dialog
box, click OK.
The changes are saved and the Schedule Distribution Methods dialog box closes.
- To implement the configuration changes, restart the Distribution Server and WebFOCUS BUE web application.
The Email Distribution folder in the Configuration tab contains default email settings, email retry options, and email security. The Email Distribution window is shown in the following image.
The Email Distribution and Notification folder contains the following configuration settings.
|
Setting |
Optional or Required/Default Value |
Descriptions and Possible Values |
|---|---|---|
|
Inline Report Distribution |
Required. The default value is Allowed. |
Specifies whether the Schedule tool will enable the email distribution option to send a report in the body of the email (inline). Note: If this option is cleared after a schedule using this option has been created, the schedule will fail when it is run. A message in the log will indicate how to fix the problem. |
|
Packet Email |
Required. The default value is Yes. |
Controls how task output and burst content are distributed through email. Valid values are:
|
|
Allowed Email Domains |
The default value is Off. |
Contains the email domains that are authorized in a distribution. Note: Files containing email addresses intended for distribution are also verified for valid domains at schedule execution time. If it contains a restricted address, then no delivery is made to that address and an error message is written to the log file. |
|
Customize Attachment Message |
Optional |
Provides the ability to specify a custom message. |
|
Default Attachment Message |
Required. |
Defines the default message used in your Email Distribution. The message that you define here displays in the Basic Scheduling Tool. |
|
Mail Server Defaults section | ||
|
Mail Server |
Required. |
Name of the default mail server used to distribute an email schedule. You can also specify a port for Mail Host using hostname:port. If you do not specify a port or the port you specify is not present, the default port is used. |
|
This Server Requires a Secure SSL Connection |
Optional. |
Select this check box if the specified mail server uses SSL. |
|
This Server Requires a Secure TLS Connection |
Optional. |
Select this check box if the specified mail server uses TLS. |
|
This Server Requires Authentication |
Optional. |
Select this check box if the specified mail server requires authentication with a user ID and password. |
|
SMTP User Id/Password |
Required if the mailhost is using SMTP Authorization. No default value. |
User ID and password used to connect to the mailhost. |
|
Email Reply Defaults section | ||
|
Mail From |
Optional. |
Default value for the email From field. This can be any value. |
|
Mail Reply Address |
Optional. |
Default email reply address when creating an email schedule. |
|
Email Retries section | ||
|
Email Retries |
The default value is 1. |
Number of times the Distribution server will try to connect to the email server to deliver report output. If the Distribution server is unable to connect to the email server on the first try, it will attempt to connect again after the specified Email Retry Interval has passed. A message for each attempt is written to the log file. Valid values are 0 through 9. |
|
Email Retry Interval(seconds) |
The default value is 60 seconds. |
Amount of time that the Distribution server will wait between retries. Valid values are 1 through 999. |
- From the ReportCaster Tools menu, click ReportCaster Status.
-
Click the Configuration button,
as shown in the following image.
Note: Authorized users can also access the ReportCaster Configuration tool from the Administration Console.
- In the left pane, select the Email Distribution folder.
-
Populate
the email distribution fields. You can:
- Make changes to the current email settings. For more information, refer to the preceding table.
- Supply any default values that you would like to be available at schedule creation time.
- If your mail server(s) require authentication or SSL or TLS, check the appropriate boxes and enter the required credentials. For more information, see the Installation topic in the Information Center.
- Click Save.
The Notification folder in the Configuration tab contains default notification settings. The Notification window is shown in the following image.
The Notification folder contains the following configuration settings.
|
Setting |
Optional or Required/Default Value |
Descriptions and Possible Values |
|---|---|---|
|
Notification Defaults section | ||
|
Notify Mail Server |
Optional. |
Name of the mail server that distributes the notification email. If blank, ReportCaster uses the Mailhost setting as the notification mail server. Tip: Information Builders recommends using different mail servers for notification and email distribution. This way, if there is a problem with your Mailhost, notification will still be sent. Having separate mail servers ensures that you will be informed when the default mail server falters. You can also specify a port for the Notify Mailhost using hostname:port. If you do not specify a port or the port you specify is not present, the default port is used. |
|
Default Notify Type |
The default value is Never. |
Specifies whether to send notification of the schedule status to a specified email address. Possible values are:
Note: This setting is also available in the Administration Console. |
|
Enable Brief Notification Only |
Optional. |
Controls whether Full Notification is available as a scheduling option. When this check box is selected, you can only select the Brief Notification option when you schedule a report. Full Notification is not available. Note: Messages are displayed in the log when Full Notification is disabled. If a schedule is created before Full Notification is disabled, when the schedule executes, a Brief Notification will be sent, and a warning will be displayed in the schedule log. |
- From the ReportCaster Tools menu, click ReportCaster Status.
-
Click the Configuration button,
as shown in the following image.
Note: Authorized users can also access the ReportCaster Configuration tool from the Administration Console.
- In the left pane, select the Notification folder.
-
Populate the notification fields. You can:
- Make changes to the current notification settings. For more information, refer to the preceding table.
- Supply any default values that you would like to be available at schedule creation time.
- Click Save.
The Zip Settings folder in the Configuration tab, as shown in the following image, contains settings for adding an extension to a distributed Zip file, the Zip encryption to use for distribution.
The Zip Settings folder contains the following configuration settings.
|
Setting |
Optional or Required/Default Value |
Descriptions and Possible Values |
|---|---|---|
|
Add Zip Extension to Filename if Not Specified |
Required. By default, this option is selected. |
Controls whether or not the .zip file extension will be automatically appended to the Zip file name entered by the user in a schedule distributed by email or FTP. Select this option if you want to automatically append .zip to the entered file name. Do not select this option if you want to use the file name as entered by the user and not have .zip automatically appended to the file name. |
|
Zip Minimum with Email Distribution |
Required. The default size is in KB and set to 0. |
Select either MB or KB and customize the size of your file using the up and down arrows. |
|
Zip Encoding |
Optional. |
Specifies an encoding other than the default encoding of the ReportCaster Distribution Server platform. The encoding specified must match the encoding used by WinZip or any other Zip utility installed on the Distribution Server. Note: This setting is also available in the Administration Console. |
|
Maximum Concurrent Compressions |
Optional The default value is zero (0). |
The total number of compression operations that the Distribution Server will perform simultaneously. If many running jobs include a compression operation (for example, zipping the output before sending), the compression operations could consume all of the available resources on the Distribution Server. You can lower this number to prevent this from occurring. |
- From the ReportCaster Tools menu, click ReportCaster Status.
-
Click the Configuration button.
Note: Authorized users can also access the ReportCaster Configuration tool from the Administration Console.
- In the left pane, select the Zip Settings folder.
- Populate the Zip Settings fields using the information provided in the preceding tables.
- If you want to produce zipped output that is encrypted and password protected, you can use the Zip Encryption Password Plug-in. To use your own program to supply the password, select Custom from the drop-down list and enter the name of the program in the Zip Encryption Password Plug-in Name field. To use the default, select Default.
- Click Save.
The Other Schedule Defaults folder in the Configuration tab, as shown in the following image, contains settings for Schedule End Date and Schedule End Time.
Note: Depending on your time zone, the default Schedule End Date may be set to Jan 1, 2100.
The following table lists and describes the configuration settings available in the Other Schedule Defaults folder.
|
Setting |
Optional or Required/Default Value |
Descriptions and Possible Values |
|---|---|---|
|
Schedule End Date |
Required. |
Clicking the drop-down menu displays a calendar where you can select the schedule end date. |
|
Schedule End Time |
Required. |
Manually, you can enter an end time for the schedule. Alternatively, use the arrows to assign a schedule end time. |
The Log Purge folder in the Configuration tab, as shown in the following image, contains settings for purging log files, log purge periods, and log purge times.
The Log Purge folder contains the following configuration settings.
|
Setting |
Optional or Required/Default Value |
Descriptions and Possible Values |
|---|---|---|
|
Purge Log at Distribution Server Start |
Optional. By default, the check box is unchecked. |
When selected, log reports are automatically purged each time the Distribution Server starts. This is in addition to the scheduled log purging that is set using the Log Purge Period and Log Purge Time options. |
|
Daily Scheduled Log Purge section | ||
|
Log Purge Period (Days) |
Optional. |
Automatically purges individual log reports when they are older than a set number of days. Note: This setting is also available in the Administration Console. |
|
Log Purge Time |
Optional. |
Time at which log purging occurs. Note: This setting is also available in the Administration Console. |
ReportCaster can be configured to retrieve email address information from an LDAP data source. The leading mail server software vendors use LDAP for storage of email information. This includes Active Directory on Windows platforms.
The LDAP Setting folder in the Configuration tab, as shown in the following image, contains settings to define LDAP server connection and security, as well as LDAP email settings.
The LDAP Settings folder contains the following configuration settings.
|
Setting |
Optional or Required/Default Value |
Descriptions and Possible Values |
|---|---|---|
|
General Setting section | ||
|
Active Directory |
By default, this option is not selected. |
Select if you are using the Active Directory technology for LDAP. Do not select if you are using any other technology for LDAP. |
|
Secure Connection (SSL) |
By default, this option is not selected. |
Indicates whether or not SSL (Secure Sockets Layer) is used to communicate with the LDAP server. |
|
LDAP Host |
There is no default value. |
Host name or IP address of your LDAP directory server. |
|
LDAP Port |
Default value is 389. |
Port on which the directory server listens. |
|
LDAP Search Base |
There is no default value. |
Filter for LDAP searches. Only the subtree below the search base is available for LDAP queries. For example, dc=ibi, dc=com. |
|
Search Time Out |
Default value is 120. |
Time, in seconds, that ReportCaster can search an LDAP data source before timing out. |
|
Security Principal |
No default value. |
Service account of the user performing authentication. The user must have sufficient access rights to locate user entries in the directory. Select the icon to the right of this option to open the User dialog box, where you can type a user name and password. |
|
LDAP Email Setting section | ||
|
Email LDAP Enabled |
By default, this option is not selected. |
Indicates whether ReportCaster is enabled to retrieve email address information from an LDAP data source. |
|
Email Map |
Default value is mail. |
Attribute type for email entries. |
|
Email User Filter |
Default value provided is dependent on the LDAP Type selected. |
Filter for email entries to be retrieved. For example: (& (mailnickname=*) (|(&(objectCategory=person) (objectClass=user)(!(homeMDB=*)) (!(msExchHomeServerName=*))) (&(objectCategory=person) (objectClass=user)(|(homeMDB=*) (msExchHomeServerName=*))) (&(objectCategory=person) (objectClass=contact)) (objectCategory=group) (objectCategory=publicFolder))) |
|
First Name Map |
Default value is givenName. |
Attribute for first name entries. |
|
Last Name Map |
Default value is sn. |
Attribute for last name entries. |
The Data Servers folder in the Configuration tab contains settings to configure the Reporting Servers associated with ReportCaster. Using the configuration settings in this folder, you can also configure multiple Reporting Servers with ReportCaster.
Note: Data Server connection information is stored in the WebFOCUS BUE Client, and not in ReportCaster. ReportCaster runs scheduled procedures through the WebFOCUS BUE Client which is installed with the Distribution Server. When a ReportCaster job is executed by the WebFOCUS BUE Client, the alternate deferred server is used if an alternate deferred server is defined.
The following image shows the display in the right panel when the Data Servers folder is selected. Initially, the default data server appears in this panel with information, such as the data server name, URL (used to connect to the Reporting Server), the type of server, whether or not it is the default server, and what security type it is using. When you add a data server that ReportCaster can access, it will appear in this list.
The following image shows the configuration settings when you select a specific data server under the Data Servers folder (in this example, EDASERVE).
The Data Servers folder contains the following configuration settings.
|
Setting |
Optional or Required/Default Value |
Descriptions and Possible Values |
|---|---|---|
|
Settings for the Data Servers folder: | ||
|
Graph Agents |
The default value is 1. |
Optimizes the processing of graphs. Due to performance considerations, Information Builders generally recommends configuring this setting to 1 Graph Agent for each concurrent graph report. However, your own internal testing should determine the Graph Agent value that best suits the business needs of your organization. |
|
Graph Servlet URL |
Optional. There is no default. |
Overrides the default graph server setting and configures graph image files to be created on the Application Server. Type the following value http://hostname/context_root/IBIGraphServletwhere:
This setting is available for WebFOCUS BUE Server and WebFOCUS BUE procedures. This setting should not be used when web server security is enabled. This includes Basic authentication, IWA, SSL, and third-party security products (such as SiteMinder). In these cases, the web server security settings can prevent WebFOCUS BUE from creating the graph. |
|
Excel Servlet URL |
Default value is http://localhost: 8080/ibi_apps |
Specifies the application server to be used to zip the file components that comprise an EXCEL® 2007 file (.xlsx) as follows: &URL_PROTOCOL://servername/alias/IBIEXCELSERVURL where:
This setting is available for WebFOCUS BUE Server and WebFOCUS BUE procedures. This setting should not be used when web server security is enabled. This includes Basic authentication, IWA, SSL, and third-party security products (such as SiteMinder). In these cases, the web server security settings can prevent WebFOCUS BUE from creating the Excel 2007/2010 file. |
|
FOCEXURL/FOCHTMLURL |
Default value is http://localhost:8080 |
Specifies the host name and port of the FOCEXURL/FOCHTMLURL. |
|
Settings for an individual Data Server: | ||
|
Name |
Required. |
Name of the selected Data Server. Note: Data Server names are case-sensitive. Data Servers are defined in the WebFOCUS BUE Client as uppercase so you should also define Data Servers as uppercase in ReportCaster. |
|
Default |
Required. |
This option is selected by default. |
|
Set FOCEXURL/ FOCHTMLURL in the scheduled procedure |
Required. |
This setting is selected, by default. If this setting is not selected, the Distribution Server will not set the value of FOCEXURL or FOCHTMLURL for a scheduled procedure. Therefore, when cleared, if FOCEXURL or FOCHTMLURL is already set in the edasprof.prf file, this setting remains in effect, unless it is overridden in the scheduled procedure. |
|
Security section | ||
|
Security Type |
By default, this option is set to User. |
Static. A valid Execution Id and password is supplied in the User setting. When creating a schedule, you cannot specify an Execution Id and password. User. A valid Execution Id and password must be specified when creating a schedule. Shared. When creating a schedule, the user ID and password is internally assigned as the Execution Id and password. Note: Since the actual password is not stored in the WebFOCUS BUE repository, the Shared configuration can only be used when a password is not required to connect to the Reporting Server. Trusted. The Execution Id is the schedule owner and no password is sent to the WebFOCUS BUE Reporting Server when schedules run. Note: The Reporting Server must be a configured to accept a Trusted connection when the Trusted option is selected. |
|
Graph section | ||
|
Graph Engine |
Required. The value is GRAPH53. |
Controls which graph engine to use for server-side graphics. By default, this specifies the GRAPH53 setting. |
|
Headless |
By default, this option is not selected. |
Determines whether a graphics card exists on the WebFOCUS BUE Reporting Server. When not selected (the default), a graphics card exists on the server. When selected, no graphics card exists on the server. |
|
Maximum Connection/Threads |
Required. The default connection is 3. |
Maximum number of connections available to the Reporting Server. You can specify a maximum of 20 connections. This setting works in conjunction with the optional Weight setting, enabling you to prioritize the alternate servers in a cluster queue. |
You can configure multiple Reporting Servers with ReportCaster through the Data Server folder in the ReportCaster Configuration tab. Although the installation program automatically populates values for the default EDASERVE server, all additional Reporting Servers must be added to the configuration manually.
Note: If the default Reporting Server is changed on the Client, then the change will not be effective until the period specified by the IBFS Cache Cleaner service or until the Distribution Server is restarted. If the Distribution Server is installed on another machine with a separate copy of the Client, then a change to the default Reporting Server will not be effective until the same change is made on the Client installed on the same machine as the Distribution Server.
-
In the left
panel of the Configuration tab, select the Data Servers folder,
then select New in the toolbar, as shown
in the following image.
Note: The default Data Server names are SERVER, SERVER 2, SERVER 3, and so on.
- From the Available Data Servers dialog box, select one or more Data Servers, and click OK. You can optionally select the Select All check box.
-
Double-click
the new server node in either the Data Servers folder in the left
panel or the server list in the right panel.
The right panel displays the default properties for the selected server, as shown in the following image.
-
Provide
values for the appropriate settings.
In the Name field, verify the name of the server you want to add to the ReportCaster configuration is the same as the NODE setting for that server specified in the WebFOCUS BUE Client Server Connections configuration. You can review the WebFOCUS BUE Client Server Connections by accessing the Administration Console and selecting Reporting Servers within the Configuration tab.
Optionally, provide values for the Security Type and Maximum Connections settings or leave the default values in place.
You can also optionally set the Data Server being added to be the default Data Server when new schedules are created, specify not to have the FOCEXURL and FOCHTMLURL settings automatically added when scheduled jobs run, and specify that the Data Server does not have a graphics card, is Headless.
- To implement the changes in ReportCaster, in the Configuration tab toolbar, select Save, then Restart.
Caution: Information Builders recommends that you avoid changing the name of a Reporting Server, since all existing jobs on that server will no longer run.
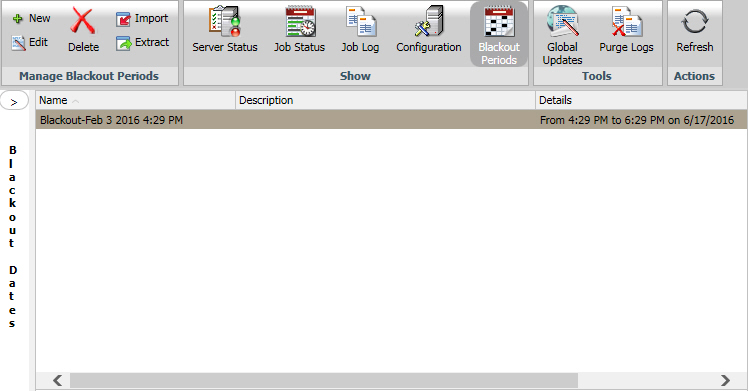
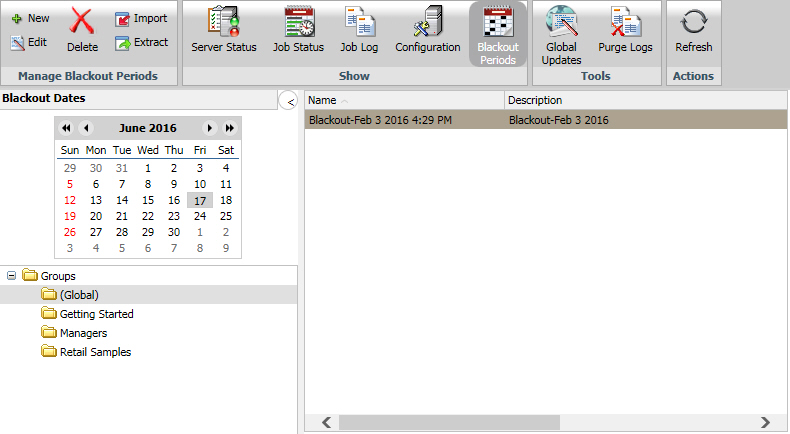
Blackout Periods are those dates and times on which schedules will not run and cannot be set to run. A user authorized to access the Blackout Periods tool can view, define, update, import, export, and delete blackout periods.
To view schedule blackout periods, select Blackout Periods from the Show group in the Console. The Blackout Periods interface, which is shown in the following image, provides a calendar in the left panel and the right panel lists the blackout dates you are authorized to manage.
Users authorized to manage blackout periods can add new blackout periods, delete blackout periods, replace the description of existing blackout periods, and extract existing blackout period information to a file for future use. In the ReportCaster Blackout Periods interface, these tasks can be completed using the following features:
- The Blackout Date and Time dialog box, accessed from the New and Edit buttons in the Manage Blackout Periods group.
- The Import Dates dialog box, accessed from the Manage Blackout Periods group.
- The Extract Blackout Dates dialog box, accessed from the Manage Blackout Periods group.
You can change the month or year using the arrows at the top of the calendar. Dates only appear as available or unavailable. You can show or hide the left panel by clicking the arrow in the top-right corner of the left panel. The following image shows the display with the left panel hidden.
Every type of Blackout Period profile shares the same basic settings: Group Assignment, Name, Description, Details, and Blackout Time. Within that basic configuration, there are four types of Blackout Periods that accommodate differing scheduling requirements. These include:
- Weekly Blackout Periods. Recur on a specified day or days of the week.
- Monthly Blackout Periods. Recur on a specified monthly date or dates.
- Single Day Blackout Periods. Occur only once on a specified date.
- Every Day Blackout Periods. Recur at a specified time every day.
This variety of profiles enables you to build blackout periods into your reporting schedule that accommodate those regularly recurring and special one-day events that would cause you to suspend reporting.
The Blackout Date and Time dialog box contains settings that define the timing and frequency of a scheduled Blackout Period. There are four variations of this dialog box to accommodate the Weekly, Monthly, Single Day, and Every Day frequency options.
The following table describes settings in the Global Blackout Date and Times profile.
|
Setting |
Optional or Required/Default Value |
Descriptions and Possible Values |
|---|---|---|
|
Group |
Displays the name (Global). |
Displays the name (Global). |
|
Name |
Optional. By default displays the name: Blackout-[Current Date] [Current Time] For example: Blackout-Jun 26 2015 10:27 AM |
A descriptive name for the Blackout Date and Time profile. You can modify the default name by clicking within the Name field. |
|
Description |
Optional. |
A detailed description of the Blackout Date and Time profile. |
|
Details Label |
Assigned to the profile after creation. |
A summary of the detailed times and frequency of the Blackout Period. This is a narrative description of the selections you make in the Weeks, Days, Months, and Blackout Time fields. ReportCaster creates this description automatically when you save the profile, and updates it when you save changes to it. You cannot create, edit, or delete it directly. |
|
Blackout Time check box |
By default this check box is cleared. |
Selected. The Blackout Period covers the hours specified in the Start (Time) and End (Time) fields. Not Selected. The Blackout Period covers the entire day. Note: If you change a profile from Single Date to any other frequency setting, you must clear this check box if the blackout period is to cover the entire day. |
|
Start (Time) |
Optional. By default, displays the current hour and minute. |
The Hour and Minute in which a Blackout Period is to begin. This value is relevant only if the Blackout Time check box is selected. |
|
End (Time) |
Optional. By default, displays the time two hours after the current hour and minute. |
The Hour and Minute in which a Blackout Period is to end. This value is relevant only if the Blackout Time check box is selected. |
|
Frequency |
Required. By default, the Weekly option is selected. |
Weekly. Blackout periods that recur on a specified day of the week. Monthly. Blackout periods that recur on a specified monthly date. Single Day. Blackout periods that occur once on a specified date. Every Day. Blackout periods that recur at a specified time every day. |
To configure a blackout period:
-
From the
Manage Blackout Periods group on the ribbon, click New.
The Blackout Date and Time dialog box opens, as shown in the following image.
- Accept the default Name assigned to the Blackout Period profile or enter a new value for Name.
- Type a description for the Blackout Period profile in the Description field.
- If this blackout period must cover the entire day, leave the Blackout Time check box cleared and skip to step 7.
-
If this blackout period must be limited to a range of
hours within a day, select the Blackout Time check box and configure
the start and end time for the Blackout Period.
For more information, see How to Configure a Start Time and End Time for a Blackout Period.
-
Click the appropriate frequency option:
- Weekly. Establish the frequency for the blackout period. For configuration information, see Configuring Weekly Blackout Periods.
- Monthly. Establish the frequency for the blackout period. For configuration information, see Configuring Monthly Blackout Periods.
- Single Day. Select the date for the blackout period. For configuration information, see Configuring Single Day Blackout Periods.
- Every Day. Establish the hours for the daily blackout period. For configuration information, see Configuring Every Day Blackout Periods.
-
Review your configuration.
- If your configuration of dates and hours is unacceptable, the OK button will not respond when you attempt to click OK. Adjust your configuration and refresh the profile by clearing and reselecting the recurring check boxes.
- If your configuration is acceptable, the OK button will be available, and the Details label will include a description summarizing your selections.
-
When your configuration is complete, click OK.
An entry for the Blackout Profile appears in the right pane of the Blackout Dates window and the Blackout Date Calendar in the left pane highlights the new blackout dates.
The Weekly Blackout Period configuration bases its recurrence on a specified day of the week. It suits events that recur as part of a weekly schedule, regardless of the date on which that day falls.
Even though the name implies that this Blackout Period occurs only once a week, Blackout Periods using the weekly configuration can occur more or less frequently.
The tools in this configuration enable you to specify:
- The day, or days, of the week on which the blackout period will occur.
- The week, or weeks, of the month in which the blackout period will occur.
- The month, or months, of the year in which the blackout period will occur.
Instead of requiring you to enforce blackout periods on the same day each and every week, this flexible configuration enables you to schedule Blackout Periods that occur more than once a week. It also enables you to configure Blackout Periods that skip one or more weeks in a month or skip one or more months in a year.
If you select the Weekly option, the Blackout Date and Time dialog box displays a unique set of options that enables you to schedule Blackout Periods for specified days of the week.
|
Setting |
Optional or Required/Default Value |
Descriptions and Possible Values |
|---|---|---|
|
On Week of the Month Check Boxes (Left Column) |
Required (At least one selection from this column.) |
The week of the month check boxes list ordinal weeks of the month. When you select one, you define the week of the month in which this blackout period is to occur. That is, the first week of the month, the second week, and so on. You can select one or more individual weeks. The Select All check box automatically selects every week of the month, establishing a blackout period that takes place every week in a month. |
|
On Days of the Week check boxes (Right Column) |
Required (At least one selection from this column). |
The day of the week check boxes list the days of the week. When you select one, you define the day of the week in which this blackout period will occur. That is, on Monday, Tuesday, and so on. You can select one or more individual days. The Select All check box automatically selects every day of the week, establishing a blackout period that takes place every day of your selected weeks in the month. |
|
Months |
Required (At least one selection from this group). |
The Month check boxes list the months of the year. When you select one, you define the month of the year in which this weekly black out period will occur. That is, in January, February, and so on. You can select one or more individual months. The Select All check box automatically selects every month of the year, establishing a blackout period that takes place during every month on your selected week and day. |
To configure weekly blackout period settings:
-
From the Blackout Date and Time dialog box, click Weekly.
The dialog box displays check boxes that support the Weekly frequency schedule, as shown in the following image.
Note: In order to enable the OK button and save the profile, you must select at least one week, day, and month check box.
- Select the check boxes for the week or weeks of the month in which the Blackout Period is to occur, or click Select All to select every week automatically.
- Select the check boxes for the day or days of the week on which the Blackout Period is to occur, or click Select All to select every day of the week automatically.
- Select the check boxes for the month or months in which the Blackout Period is to occur, or click Select All to select every month automatically.
The Monthly Blackout Period configuration bases its recurrence on a specified monthly date. It suits events that recur on the same date, regardless of the day of the week on which that date falls.
Even though the name implies that this Blackout Period occurs only once a month, Blackout Periods using this configuration can occur more or less frequently. They can occupy the entire day, or they can be limited to a range of hours within a single day.
The tools in this configuration enable you to specify:
- The day, or days, of the month on which the blackout period will occur.
- The month, or months, of the year in which the blackout period will occur.
Instead of requiring you to enforce blackout periods on the same day of the month, each and every month, this flexible configuration enables you to schedule Blackout Periods that occur more than once a month. It also enables you to configure Blackout Periods that skip one or more months.
If you select the Monthly option, the Blackout Date and Time dialog box displays a unique set of options that enables you to schedule Blackout Periods for specified dates of the month.
|
Setting |
Optional or Required/Default Value |
Descriptions and Possible Values |
|---|---|---|
|
Days |
Required. |
The Days check boxes list the dates within a month. When you select one, you define the day of the month on which this blackout period will occur. That is, on the first day of the month, the second, the third, and so on. You can select one or more individual dates. The Select All option automatically selects every day of the month, establishing a blackout period that takes place every day during your selected months. |
|
Months |
Required. |
The Months check boxes list the months of the year. When you select one, you define the month in which this black out period will occur. That is, in January, February, and so on. You can select one or more individual months. The Select All option automatically selects every month of the year, establishing a blackout period that takes place during every month on your selected day or days. |
To configure monthly blackout period settings:
-
From the Blackout Date and Time dialog box, click Monthly.
The Blackout Date and Time dialog box displays the check boxes that support the Monthly frequency, as shown in the following image.
Note: At a minimum, you must select a check box for one day and a check box for one month. Until you do, the OK button will be unavailable, and you will be unable to save the profile.
- Select the check boxes for the day or days of the month on which the Blackout Period is to occur, or click Select All to select every date in the month automatically.
- Select the check boxes for the month or months in which the Blackout Period is to occur, or click Select All to select every month automatically.
Single Day Blackout Periods occur once, on a single, specified date. They can occupy the entire day, or they can be limited to a range of hours within a single day. The settings for Single Day Blackout Periods are shown in the following image.
If you select the Single Day option, the Blackout Date and Time dialog box displays a copy of the Blackout Dates calendar, which enables you to select a single date for a scheduled Blackout Period.
-
From the Blackout Date and Time dialog
box, click Single Day.
The dialog box appears, displaying the calendar automatically set to the current date.
- Click the single arrows to change the month and click the double arrows to change the year.
-
When you have found the month and year for the scheduled
single day blackout period, click on the date on which you want
the Blackout Period to occur.
The calendar highlights the new date.
Every Day Blackout Periods recur every day. To prevent Every Day Blackout Periods from blocking the release of any reports, you must limit them to a range of hours within the day. The settings for Every Day Blackout Periods are shown in the following image.
If you select the Every Day option, the Blackout Date and Time dialog box limits its display to the Beginning and End time for the Blackout Period. No other options are relevant.
-
From the Blackout Date and Time dialog
box, click Every Day.
The Blackout Time check box is selected automatically, and the dialog box displays a note reminding you to select the start and end time.
The Start time is automatically set to the current time, and the End time is automatically set to a value two hours later.
- To change the Start or End Time values, see How to Configure a Start Time and End Time for a Blackout Period.
From the Blackout Date and Time dialog box:
-
To change the hour of the start time, click in
the Hour section of the Start field.
- Click the up or down arrow to move the value ahead one hour or back one hour, respectively.
- You can also type the hour in this section, but be careful to stay within the twelve hour range. If you enter a value outside of this range, the dialog box will automatically recalculate your value in terms of a twelve hour clock. For example, 44 hours would become 8. (44-(12X3))=(44-36)=8
- Ensure that the start time is earlier than the end time.
-
To change the minutes of the start time, click in the Minutes section
of the Start field.
- Click the up or down arrow to move the value ahead one minute or back one minute, respectively.
- You can also type the minutes in this section, but be careful to stay within the sixty minute range. If you enter a value outside of this range, the dialog box will automatically recalculate your value in terms of the number of minutes within an hour. For example, 88 minutes would become 28. (88-60) = 28).
- Ensure that the start time is earlier than the end time.
-
To change the start time from AM to PM, click in the
AM/PM section of the Start field.
- Click the up arrow to move from AM to PM.
- Click the down arrow to move from PM to AM.
- You can also type AM or PM directly into this section.
-
To change the hour of the end time, click in the Hour section
of the End field.
- Click the up or down arrow to move the value ahead one hour or back one hour, respectively.
- You can also type the hour in this section, but be careful to stay within the twelve hour range. If you enter a value outside of this range, the dialog box will automatically recalculate your value in terms of a twelve hour clock. For example, 44 hours would become 8. (44-(12X3))=(44-36)=8.
- Ensure that the end time is later than the start time.
-
To change the minute of the end time, click in the Minutes section
of the End field.
- Click the up or down arrow to move the value ahead one minute or back one minute, respectively.
- You can also type the minute in this section, but be careful to stay within the sixty minute range. If you enter a value outside of this range, the dialog box will automatically recalculate your value in terms of the number of minutes within an hour. For example, 88 minutes would become 28. (88-60 = 28).
- Ensure that the end time is later than the start time.
-
To change the end time from AM to PM, click in the AM/PM section
of the End field.
- Click the up arrow to move from AM to PM.
- Click the down arrow to move from PM to AM.
- You can also type AM or PM directly into this section.
Important: You must use the right or left arrow keys to move between the Hour, Minutes, and AM/PM sections of the Start and End fields.
If you try to use the Tab key to move between sections, you will move down to the next option instead of across to the next section of the Start or End field.
For example, if you use the Tab key to move from the Hours section of the Start field, you will move down to the Hours section of the End field, not over to the Minutes section of the Start field. To move right, you must use the right direction key instead.
Similarly, the Shift+Tab key combination will move you to the previous option, not back to a previous section within the Start or End field. To move left, you must use the left direction key instead.
- In the left pane of the Blackout Dates dialog box, click the folder for the Group to which the Blackout Period profile you want to delete is assigned.
-
In the right pane, click the entry for Blackout Period
profile you want to delete, as shown in the following image.
- On the ribbon, in the Manage Blackout Periods group, click Delete.
-
When you receive a confirmation message, click Yes,
as shown in the following image.
Your newly deleted entry disappears from the right pane and the dates assigned to that entry are no longer highlighted on the Blackout Dates calendar in the left pane.
You can use the Blackout Period Import operation to automate Blackout Period management tasks. Using a properly formatted import file with this tool, you can:
- Create new Blackout Period profiles.
- Remove Blackout Period profiles.
- Enrich Blackout Period information.
The source file for the import contains the following information about a Blackout Period Profile:
- Date. The date on which the Blackout Period profile becomes effective. This date can be omitted for Every Day Blackout Period profiles.
- Start Hour. The time (HH:MM:SS) at which the Blackout Period becomes effective. This value is optional for all but Every Day Blackout Period profiles.
- End Hour. The time (HH:MM:SS) at which the Blackout Period ceases to be effective. This value is optional for all but Every Day Blackout Period profiles.
- Description. A detailed description of the Blackout Period profile.
- Name. The unique name assigned to a Blackout Period profile.
Note: Additional Codes precede entries for Weekly or Monthly Blackout Period profiles. For more information, see Weekly Blackout Period Import File Entry Layout and Monthly Blackout Period Import File Entry Layout.
The task you select when you run an import operation determines the way in which ReportCaster uses the information in the source file for the Import.
If you select:
- Add, the import creates new Blackout Period profiles from the records in the import source file.
- Remove, the import compares date and additional information in import file records to that of existing Blackout Period profiles and removes those profiles that match the file records.
- Replace, the import compares date information in import file records to that of existing Blackout Period profiles and adds Name and Description information to them.
- Use the actions specified in the file, the import runs the add, remove, and replace operations as required by commands included in the Import file along with entries for the Blackout Period profiles affected by them.
The automation of these tasks frees you from manually creating, updating, or deleting Blackout Period profiles when operational changes, such as monthly, quarterly, or annual operation schedule updates, require a sweeping review and revision of your reporting schedule.
For example, at the start of the year, you have a file containing the dates and names of all scheduled holidays that must be incorporated into your reporting schedule. The Blackout Period Import enables you to import that file and establish the holiday blackout schedule for an entire year in a single operation. Without the import you would have to create a Single Date Blackout Date and Time profile for each holiday in the coming year.
Even though entries in the Import File format for Blackout Period records use the same basic structure, each profile type contains minor variations that identify the type of Blackout Period profile ReportCaster must create from the entry details.
You can import Single Date Blackout Date and Time profiles from a flat file that lists the information for each profile on a separate line. Each line must follow the following layout:
[Date]/[Start Hour]| [End Hour] [Description]|[Name]
For example:
20150629/08:59:00|10:59:00 Report Blackout for June 29th Only|Special One Day Blackout - June 29th
- Dates use the format YYYYMMDD
- Hours use the format HH:MM:SS
- You can omit the hours to schedule an all day blackout.
The Weekly, Monthly, and Every Day Blackout Date and Time profiles use a variation of this format.
You can import Weekly Blackout Date and Time profiles from a flat file that lists the information for each profile on a separate line. Each line must follow the following layout:
[Blackout Pattern] [Description]|[Name]
For example:
[111111111111/10000:0000010]/17:00:00|23:59:00 Report Blackout First Friday of Every Month 5:00 PM to 11:59 PM|First Friday Afternoons
This information identifies the entry as a Weekly Blackout Period, and includes its Description and Name. The Blackout Pattern indicates the selected Month(s) and Selected Day(s) of the Week. A '1' means that a month or day is selected. A '0' means that a month or day is not selected.
You can import Monthly Blackout Date and Time profiles from a flat file that lists the information for each profile on a separate line. Each line must follow the following layout:
[Blackout Pattern]/[Start Hour]|[End Hour] [Description]|[Name]
For example:
[111111111111/10000:0000010]/17:00:00|23:59:00 Report Blackout First Friday of Every Month 5:00 PM to 11:59 PM|First Friday Afternoons
This information identifies the entry as a Monthly Blackout Period, and includes its Description and Name. The Blackout Pattern indicates the selected Month(s) and Selected Day(s) of the Month. A '1' means that a month or day is selected. A '0' means that a month or day is not selected.
You can import Every Day Blackout Date and Time profiles from a flat file that lists the information for each profile on a separate line. Each line must follow the following layout:
/[Start Hour]|[End Hour] [Description]|[Name]
For example:
/21:04:00|23:04:00 Every Day Blackout between 3:00 PM and Midnight|Daily Afternoon Blackout
This information identifies the entry as an Every Day Blackout Period and includes its Description and Name.
To add a Blackout Period profile through the import is to create a new Blackout Period profile from information in the import file. Your Import file must therefore contain records for all Blackout Period profiles you want to add to ReportCaster through this import operation.
- In the Blackout Dates pane, click the folder of the group for which you are importing Blackout Period profiles.
-
On the ribbon,
in the Manage Blackout Periods group, click Import.
- In the File Name field, type the full path to the file, or click Browse and navigate to the file you want to import.
-
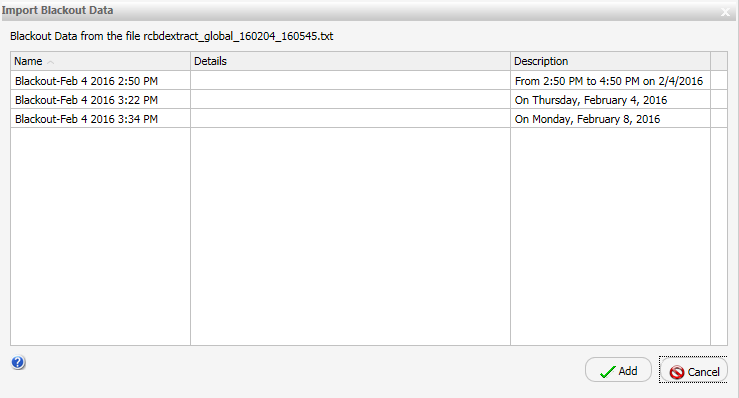
Click Add, and click OK.
The Import Blackout Data dialog box opens, listing details of the new Blackout Profiles based on each entry in the Import file as shown in the following image.
-
Click Add to add the new Blackout
Period profiles listed in the Import Blackout Data dialog box to
the Blackout Dates Calendar and Group entries.
A message displays, informing you that the blackout dates have been successfully imported, as shown in the following image.
-
Click OK.
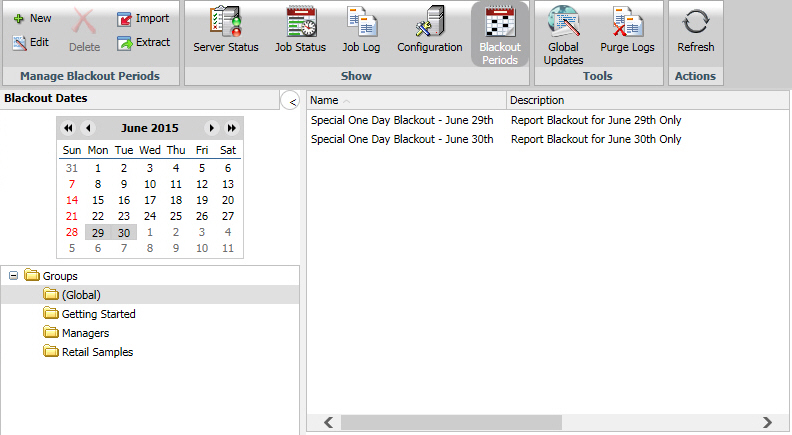
The Blackout Dates calendar highlights the newly imported Blackout Period Dates in the left pane of the Blackout Dates window and entries for the new Blackout Period profiles appear in the right pane, as shown in the following image.
To replace a Blackout Period profile through the import is to add updated information to its Name and Description fields. To ensure that the import-based update affects the proper profiles, your Import file must contain records whose dates match those of the existing Blackout Period profiles that must be enriched by this Import operation.
Note: You must use this procedure to update or enrich information assigned to a Blackout Period profile created from an Import.
- In the right pane of the Blackout Dates dialog box, select the group for which you are importing Blackout Period profiles.
-
On the ribbon, in the Manage Blackout Periods group,
click Import.
The Import Dates dialog box opens, as shown in the following image.
- In the File Name field, type the full path to the file, or click Browse and navigate to the file you want to import.
-
Click Replace, and then click OK.
The Import Blackout Data dialog box opens, listing the details from each entry in the Import file that will be added to their corresponding Blackout Period profiles.
-
Click Replace to add new the information
listed in the Import Blackout Data dialog box to the designated
Blackout Period profiles.
A message displays, informing you that the blackout dates have been successfully imported, as shown in the following image.
-
Click OK.
Enriched entries for the updated Blackout Period profiles appear in the right pane.
Removing a Blackout Period profile through the import deletes it. To ensure that the import-based deletion affects the proper profiles, your Import file must contain records whose dates match those of the existing Blackout Period profiles that are to be deleted by this Import operation.
- In the Blackout Dates tab pane, select the group containing blackout period profiles that must be removed.
-
On the ribbon, in the Manage Blackout Periods group,
click Import.
The Import Dates dialog box opens, as shown in the following image
- In the File Name field, type the full path to the file, or click Browse and navigate to the file you wish to import.
-
Click Remove, and then click OK.
The Import Blackout Data dialog box opens, listing details from each entry in the Import file that successfully matched an existing Blackout Period profile.
-
Click Remove to delete those Blackout
Period profiles listed in the Import Blackout Data dialog box.
A window opens, informing you that the blackout dates have been successfully imported.
-
Click OK.
Blackout Period profiles removed by this operation are no longer highlighted in the left pane of the Blackout Dates window or as entries for the new Blackout Period profiles in the right pane, as shown in the following image.
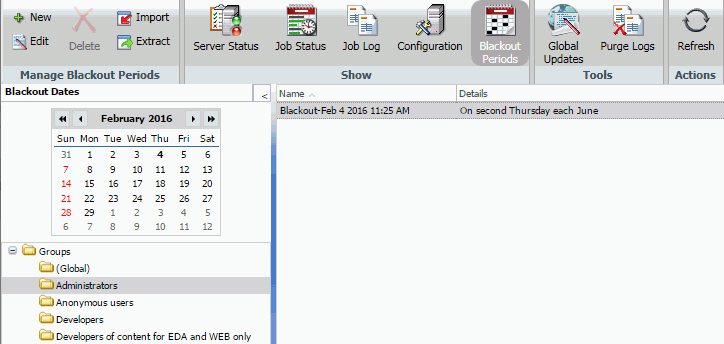
The Use the actions specified in the file option allows the import process to add, remove, and replace multiple Blackout Period profiles in a single operation. Your Import file must therefore contain the all necessary commands followed by entries representing Blackout Period profiles that must be added, removed, or enriched by the import operation.
- In the right pane of the Blackout Dates dialog box, select the group for which you are managing Blackout Period profiles.
-
On the ribbon, in the Manage Blackout Periods group,
click Import.
The Import Dates dialog box opens.
- In the File Name field, type the full path to the file, or click Browse and navigate to the file you want to import.
-
Click Use the actions specified in the file,
and then click OK.
The Import Blackout Data dialog box opens, listing details from each entry in the Import file and a note about its proposed update.
- Click OK.
-
When you receive the Blackout Dates have been successfully imported message,
click OK.
The Blackout Dates calendar highlights the dates of the newly imported Blackout Periods in the left pane of the Blackout Dates window. Entries for the new and enriched Blackout Period profiles appear in the right pane. Calendar highlights and entries for profiles removed by the Import no longer appear.
Note: You will be unable to use the Edit command to update Blackout Period profiles created from a direct file import. You will be required to update these profiles using the Replace option in the Import operation.
You can extract existing blackout period profile information from the ReportCaster Development Interface to a .txt file.
A direct file extract minimizes the time it would take to transfer information about multiple Blackout Periods to a text file that can serve as a backup of your Blackout Calendar configuration or as the source of an import to an external system for reporting or auditing purposes.
For example, if your group is required to maintain a backup copy of blackout dates for the coming six months, the extract operation enables you to transfer the Description, Date, and Name of all scheduled blackout periods during that time. You can recreate basic information about these profiles from the backup file in an emergency, shortening the time required to reconstruct your reporting schedule.
The Import and Extract file operations use the same layout and format conventions. The Extract file contains additional comments that document the range of dates selected for the extract and templates for the format of the entries it contains, as shown in the following image.
For more information about each entry type layout, see Viewing Blackout Period Import File Format.
To extract schedule blackout period profiles:
- In the Blackout Dates pane, select the group from which you are extracting blackout period profiles.
-
In the Manage
Blackout Periods Toolbar group, click Extract.
The Extract Blackout Dates dialog box opens. The Group Name from which you are extracting the blackout dates appears at the top of the dialog box, as shown in the following image.
-
Select one
of the following from the Date Range Options:
- All to extract all currently saved blackout period profiles.
- Date Range to specify the range of dates containing scheduled blackout period profiles that you want to extract.
If you select Date Range, type or select the Start Date and End Date. To select a date, click the down arrow next to the field. A calendar opens, from which you can choose a date.
- Click OK.
-
To open the file, click the Open button
when your browser presents it.
A window opens, displaying the contents of the extracted content profiles, as shown in the following image.
You can save and close the file using the commands in the File menu.
-
To accept an automatic download of the extract file,
click the Save button (users of Google Chrome
need only close the page displaying the new file name).
You can later retrieve the file from the Downloads folder of your computer, rename it if necessary, and save a copy of it in another folder for archival or other purposes.
- To rename and save the file in a different location, click the Open or Open With button, and select the Save As command from the program that opens the file.
-
From the Save As window, navigate to the folder in which
you want to save the file, rename the file if necessary, and click Save.
You can close any additional web pages that may remain open after you save the file.
Note: The default extract file name is rcbdextract_GroupName_YYMMDD_HHMMSS.txt, where GroupName is the name of the group from which the blackout dates are extracted, YYMMDD and HHMMSS are the date (year, month, day) and time (hour, minute, second) that the file was created.
How to: |
Authorized users can make global updates in the Global Updates interface for the Mail Server, Printer, Email Address, Email from, and Data Server values stored in schedules and distribution lists.
-
In the Global
Updates interface, click the Setting drop-down
list and select Mail Server (the default),
as shown in the following image.
- Type the existing Mail Server in the Old Value box.
- Type the new Mail Server in the New Value box.
- Click Update to update the new Mail Server value in schedules.
-
In the Global
Update interface, click the Setting drop-down
list and select Email Address, as shown in
the following image.
- Type the existing Email address in the Old Value box.
- Type the new Email address in the New Value box.
- Click Update to update the new Email address value in schedules and distribution lists.
-
In the Global
Update interface, click the Setting drop-down
list and select Email from, as shown in the
following image.
- Type the existing Email from in the Old Value box.
- Type the new Email from in the New Value box.
- Click Update to update the new Email from value in schedules.
-
In the Global
Update interface, click the Setting drop-down
list and select Data Server, as shown in
the following image.
- Type the existing Data Server in the Old Value box.
- Type the new Data Server in the New Value box.
- Click Update to update the new Data Server value in schedules.
How to: |
The Purge Logs functionality provides on-demand options for purging logs, including the ability to specify a number of days (past) for which to purge logs. For example, if you want to purge logs for the past month, you would use the default number of days, which is 30. You can also specify an option for traces: Default Traces, No Traces, or Trace On.
-
From the
Tools group in the ReportCaster Console, click Purge
Logs.
The Purge Logs dialog box displays, as shown in the following image.
- In the Purge Logs older than (days) field, accept the default number of days or specify another value. The default number of days is 30.
- Under Trace Options, you can accept the default of Default Traces, or select No Traces or Trace On.
- Click OK.
| WebFOCUS |
Feedback |