Variable Definitions and Sampling
|
Topics: |
When the RStat tool opens for a new model to be built or modified, it appears as shown in the following image. Note that the data from the procedure (FEX) developed in the Report canvas is loaded into RStat and is ready for modeling. You can also open RStat without any data loaded (see Creating a Scoring Application for more information).
The first tab of RStat, the Data tab, displays the variables from a CSV file that are loaded into RStat.
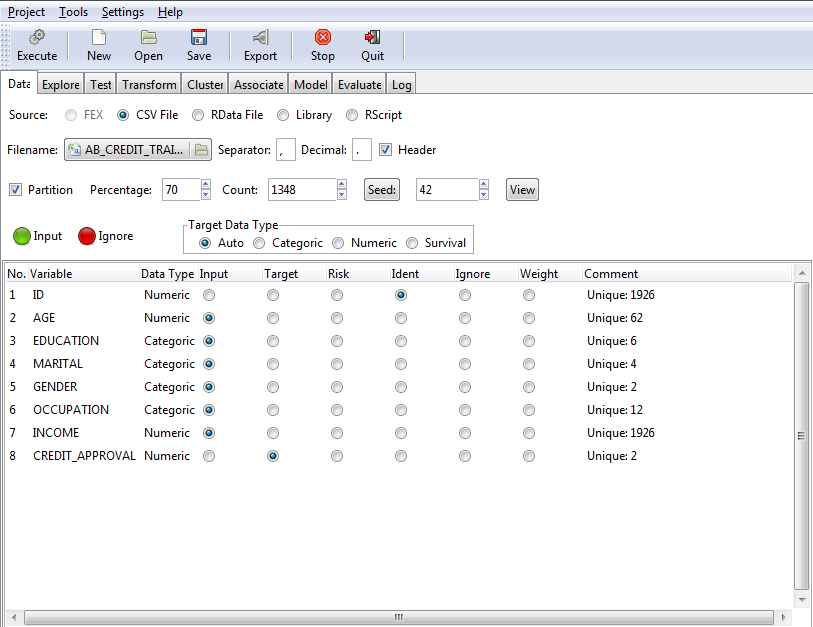
The main display features of RStat are described in the following table.
|
Display Feature |
Description |
|---|---|
|
Menu Bar |
Displays the RStat menus, such as Project, Tools, Settings, and Help. |
|
Action Toolbar |
Displays the actions available in RStat, such as Execute, New, Open, Save, Export, Stop, and Quit. |
|
Data Tab |
Displays the options to load a data set. For more information, see Data Source Selection. |
|
Explore Tab |
Displays the options to explore the data to identify how it is distributed. For more information, see Data Exploration. |
|
Test Tab |
Displays the options for hypothesis testing, including Distribution Test (Kolmogorov-Smirnov and Wilcoxon Signed Rank Test), Location & Variance Test (Wilcoxon Rank Sum, T test, and F test), and Correlation Test (Chi-SQ Test). For more information, see Hypothesis Testing. |
|
Transform Tab |
Displays the options to transform the data in various ways. For more information, see Data Transformation. |
|
Cluster Tab |
Displays the options to build clusters for data sets. |
|
Associate Tab |
Displays the options to create association rules for the data. |
|
Model Tab |
Displays the options to build predictive models. |
|
Evaluate Tab |
Displays the options to evaluate the models. |
|
Log Tab |
The corresponding R Code appears in the Log tab. This enables you to review the R commands that perform the corresponding data mining tasks. |
|
Status Bar |
Indicates when an action is completed. |
Data Source Selection
The following options are available on the Data tab in RStat. You may also access the Data tab through the Tools menu.
Source
Different options may be available depending on the data type.
- FEX. Loads the data from a FEX.
- CSV File. Loads
data from a comma-separated value (CSV) file. When CSV File is selected,
the following options become available:
- Filename: Indicates the data file that is currently in use.
- Separator. Specifies the separator type. For example, ",", "|", and so on.
- Decimal. Specifies a decimal character. For example, “,” or “.”. The character that you specify is used in the file for decimal points and supports international currency differences. For example, 30.00 versus 30,00.
- Header. Allows you to indicate whether the first row contains column headings.
- RData File. Loads data from an
RData file (usually binary). When RData File is selected, the following
options become available:
- Filename. Enables you to select a data file.
- Data Name. Allows you to load different data frames of the R data file. Data frames are collections of individual observations (rows of data) across many variables (fields). They are analogous to the SAS or SPSS data sets that organize the data set for statistical analysis in a cases by variables matrix. For example, rows across multiple columns. You can have multiple data frames in one R data file.
- Library. Enables
you to select a supplied data set from the R library. When Library
is selected, the following option becomes available:
- Data Name Opens a list, which you can use to select a library file.
- RScript. Provides
the capability of running plots, charts, summaries, and model techniques.
It can also be used to execute scoring functionality using R.
- Filename. Enables you to select a data file.
Partition
Partitioning splits the single data set into two data sets, a training data set used for analysis and modeling, and a test data set used to evaluate how well a model performs. It is a common practice to test models on new data, different from the data used to create the model.
You can define the partition size either as a percentage of the total records or as an exact number of records. Changing the percentage will automatically change the count and vice versa.
- Percentage. The default is 70%. The sample randomly chooses 70% of the data for a selected data set.
- Count. Displays the number of records that will be included in the sample based on the selected percentage. You can manually specify the number of records, which in turn will change the percentage.
- Seed. Numerical value used to initialize a random sampling algorithm or to establish a starting point in a table of random numbers. By using the same seed number, you will generate exactly the same sample. You can click Seeds to update the seed with a random number.
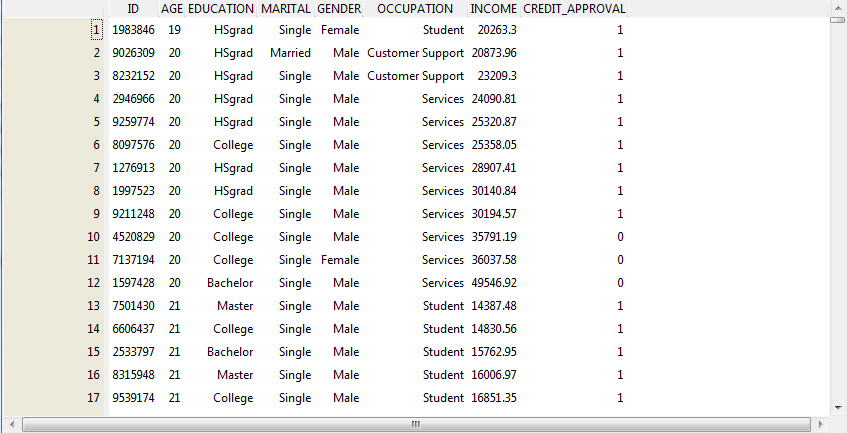
- View. Opens
the Data Viewer window, enabling you to view data. An alternate
way to view data is to run the WebFOCUS procedure (FEX) that you
use to load the data.
- Input and Ignore Buttons
You can set a group of variables to a single role using the Input and Ignore buttons by:
- Selecting the variables to be set from the Variable Grid. To select multiple variables, hold down the Ctrl key while clicking each variable, or the Shift key to define a range. You can select all variables within the grid by clicking one of the variables and then pressing Ctrl+A.
- Clicking the green Input button to define all selected variables as input, or the red Ignore button to define all selected variables as ignored. This defines a portion to be used as training data and opens with the selected data set loaded. RStat presents nine tabs that reflect the standard modeling workflow. The Data tab shows the variables and the roles each will play in building the model.
- Target Data Type
The data type of the target variable determines the type of modeling available and the specific algorithms that will be used within the modeling process. The data type is defined based on the type of data RStat identifies and the quantity of unique values found in the actual data. In RStat, data types are defined as:
- Auto. This option is selected by default and uses the rules that were most recently defined.
- Categoric. Any character data or any numeric data with 10 or less unique values.
- Numeric. Any numeric data with more than 10 unique values.
- Survival. Allows the user to run a Survival Model (that is, Cox Proportional Hazards or Parametric). A Time variable and a Status variable must be selected from the list of variables.
-
The Target option allows you to override these heuristic settings:
- Auto will use the previously defined rules.
- Categoric will handle character and numeric values as categories.
- Numeric will assign a unique numeric value to each categoric value.
- Variable Roles. Each
variable can have only one role.
- Input. This is the exploratory (independent) variable(s) where presence or degree determines the change in the dependent variable.
- Target. This is the dependent variable. In modeling, it is assumed that the dependent variable is influenced by the input variables. The model shows the degree to which the dependent variable is influenced by the input variables.
- Risk. Special variable in the data set that measures the amount of risk associated with each record in the data set.
- Ident. Identifies the variable as containing the ID for each record in the data set.
- Ignore. Ignores the variable for any analysis or modeling.
- Weight. Used to identify some observations as more important than others. There is no standard method for calculating this type of weight. This should be NULL or a numeric vector.
- Comment. Provides information on the type of data and the values found within the data, including the count of missing values and unique values.
| WebFOCUS | |
|
Feedback |