Saving Report Output in PPTX Format
WebFOCUS Release 8.0 Version 08 introduced the capability to retrieve data from any WebFOCUS supported data source and to generate a PPTX formatted (PowerPoint 2007, PowerPoint 2010, and PowerPoint 2013) presentation.
The PPTX format in WebFOCUS supports the following Microsoft Office software products:
- Microsoft Office 2013/2010/2007.
- Microsoft Office 2000/2003 with the Microsoft Office Compatibility
Pack.
Note: As per the Microsoft Support has ended for Office 2003 statement, support and updates for Office 2003 are no longer available. Although you will still be able to start and work in the Microsoft Office 2003 application, Microsoft recommends that you upgrade to a newer version of Office to get continuing support and updates. If your organization uses Office 2003, go to the end of support page for Windows XP SP3 and Office 2003 for more information.
- Open Office Support (FORMAT PPTX). Core PowerPoint functionality generated by the PPTX format is supported for Open Office as of WebFOCUS Release 8.0 Version 08. For details on Open Office, see http://www.openoffice.org/.
- MAC Office 2008 and 2011. FORMAT PPTX is supported as of WebFOCUS Release 8.0 Version 08.
WebFOCUS generates PPTX presentations based on the Microsoft PPTX standard. These presentations are accessible through all browsers and the Microsoft PowerPoint mobile application.
Note: This section, which describes important PPTX features, applies to PowerPoint 2007, PowerPoint 2010, and PowerPoint 2013, unless otherwise indicated.
Building the .pptx Presentation File
|
How to: |
Microsoft changed the format and structure of the PowerPoint presentation file in PowerPoint 2007. The new .pptx file is a binary compilation of a group of .xml files. Generating this new file format using WebFOCUS is a two-step process that consists of generating the .xml files containing the report output and zipping the .xml documents into the binary .pptx format. The Reporting Server performs the xml generation process. The zipping process can be completed either by the Client (WebFOCUS Servlet) or the Server (JSCOM3):
- WebFOCUS Servlet. The WebFOCUS Client within the application server performs the zipping process. This can be done within the local client or through a remotely accessed client. The servlet method is the default approach defined for each WebFOCUS Client, with the client pointing to itself, by default.
- JSCOM3. The Java layer of the Reporting Server performs the zipping operation. This option should be used when the WebFOCUS Servlet is configured on a secured web or application server. This is because JSCOM3 does not require URL access to a remote WebFOCUS Client.
Syntax: How to Select the Method for Zipping the .pptx File
You designate the method and location where the zipping will occur by setting EXCELSERVURL to a URL (for the WebFOCUS Servlet) or to a blank (for JSCOM3). Even though this setting is prefaced with EXCEL, when applied, the same results are achieved for PowerPoint. You can set this value for a specific procedure or for the entire environment:
- For a procedure. Issue the SET EXCELSERVURL command within the procedure.
- For the entire environment. Edit the IBIF_excelservurl variable in the WebFOCUS Administration Console by selecting Configuration/Client Settings/General/IBIF_excelservurl.
For more information on accessing the WebFOCUS Administration Console and setting the IBIF_excelservurl variable, see the WebFOCUS Security and Administration manual.
The value you assign to EXCELSERVURL determines whether the WebFOCUS Servlet or JSCOM3 performs the zipping operation:
- Specifying the Servlet. To
specify that the WebFOCUS Servlet should be used, set the EXCELSERVURL
parameter or the IBIF_excelservurl variable to the URL of a WebFOCUS Release
8.0 Version 09 or higher client configuration.
In a procedure:
SET EXCELSERVURL = http://servername:8080/ibi_apps
In the WebFOCUS Administration Console:
IBIF_excelservurl = http://servername:8080/ibi_apps
- Specifying JSCOM3. To specify that JSCOM3 should be used
within the current Reporting Server, set EXCELSERVURL to a blank
or an empty string.
In a procedure:
SET EXCELSERVURL = ' '
In the WebFOCUS Administration Console:
IBIF_excelservurl = ' '
By default, each WebFOCUS Client contains the following URL definition that points to itself:
&URL_PROTOCOL://&servername:&server_port&IBIF_webapp
Syntax: How to Generate a PPTX Presentation
You can specify that a report should be saved to a PPTX presentation, displayed in the browser, or displayed in the PowerPoint application.
ON TABLE {PCHOLD|HOLD} AS name FORMAT PPTX
where:
- PCHOLD
-
Displays the generated presentation in either the browser or the PowerPoint application, based on your desktop settings. For information, see Viewing PowerPoint Presentations in the Browser vs. the PowerPoint Application.
- HOLD
-
Saves a presentation with a .pptx extension to the designated location.
- name
-
Specifies a file name for the generated presentation.
Note: To assign a file name to the generated presentation, set the Save Report option to YES for the .pptx file extension in the WebFOCUS Client Redirection Settings. When opened in the PowerPoint application, the generated presentation will retain the designated AS name. For more information on the Redirection Settings, see the WebFOCUS Security and Administration manual.
Opening PPTX Report Output
|
Topics: |
To open PPTX presentations, the user must have an account for Microsoft Office365 or Microsoft PowerPoint 2013, 2010, or 2007 must be installed on the desktop.
Upon execution of a report with FORMAT PPTX, the user is prompted to Open or Save the PPTX file. The file name displayed before the .pptx extension is an internally generated name.
The WebFOCUS procedure generates a presentation containing as many slides as required to display output. A report may contain defined elements, such as headings, subtotals, and titles, as well as StyleSheet syntax, such as conditional styling and drill downs.
Opening PPTX Report Output in Microsoft PowerPoint 2000/2003
PowerPoint 2000 and PowerPoint 2003 can be updated to read PowerPoint PPTX presentations using the Microsoft Office Compatibility Pack available from the Microsoft download site (http://www.microsoft.com/downloads/en/default.aspx). When the file extension of the file being opened is .pptx (PPTX presentation), the Microsoft Office Compatibility Pack performs the necessary conversion to allow PowerPoint 2000/2003 to read and open it.
In addition to the Microsoft Office Compatibility Pack, it is important to enable the WebFOCUS Client Redirection Settings Save As option so that PowerPoint 2000/2003 will be able to open the PPTX report output without users first having to save it to their machine with the .pptx file extension. The WebFOCUS Client processing Redirection Settings Save As option configures how the WebFOCUS Client sends each report output file type to the user machine.
This option can be set as follows:
- Save As Option disabled (NO). The WebFOCUS Client
Redirection Setting Save As is disabled, by default. When the Save
As option is disabled, the WebFOCUS Client sends report output to
the user machine in memory with the application association specified for
the report format in the WebFOCUS Client Redirection Settings configuration
file (mime.wfs).
A user machine that does not have PowerPoint 2007 or higher installed will not recognize the application association for PowerPoint and PowerPoint will display a message. The PowerPoint 2000/2003 user can select Save and provide a file name with the .pptx extension to save the report output to their machine. The user can then open the .pptx file directly from PowerPoint 2000/2003.
- Save As Option enabled (YES). When the WebFOCUS Redirection
Save As option is enabled, the WebFOCUS Client sends the report
output to the user as a file with the extension specified in the
WebFOCUS Client Redirection Settings configuration file (mime.wfs).
Upon receiving the file, Windows will display the File Download
prompt asking the user to Open or Save the file with the identified
application type. The File Download prompt displays the Name with
the .pptx file extension for the report output that is recognized
as a PowerPoint PPTX file type.
Note: The download prompt will display for all users, including users who have PowerPoint 2007 or higher installed on their machines.
If a PowerPoint 2000/2003 user chooses to open the file, the Microsoft Office Compatibility Pack will recognize the .pptx file extension and perform the necessary conversion to allow PowerPoint 2000/2003 to read the PowerPoint PPTX presentation.
If a PowerPoint 2007 or higher user chooses to open the file, PowerPoint will recognize the .pptx file extension and read the PowerPoint PPTX presentation.
For additional information on WebFOCUS Client Redirection Settings, see the WebFOCUS Security and Administration manual.
Viewing PowerPoint Presentations in the Browser vs. the PowerPoint Application
Your Operating System and desktop settings determine whether PowerPoint output sent to the client is displayed in an Internet Browser window or within the PowerPoint application. When PowerPoint output has been defined within the Windows environment to Browse in same window, the workbook generated by a WebFOCUS request is opened within an Internet Explorer® browser window. When the Browse in same window option is unchecked for the .ppt file type, the browser window created by WebFOCUS is blank because the report output is displayed in the stand-alone PowerPoint application window.
- In Windows XP and earlier, file type specific settings are
managed on the desktop within Windows Explorer by selecting Tools/Folder
Options, clicking the File Types tab,
selecting the extension (.ppt or .pptx), clicking the Advanced button,
and checking the Browse in same window check
box.
As per the Microsoft Support has ended for Office 2003 statement, support and updates for Office 2003 are no longer available. Although you will still be able to start and work in the Microsoft Office 2003 application, Microsoft recommends that you upgrade to a newer version of Office to get continuing support and updates. If your organization uses Office 2003, go to the end of support page for Windows XP SP3 and Office 2003 for more information.
- In Windows 7, Microsoft removed the desktop settings that support
opening worksheets in the browser. This means that to change this
behavior, you can no longer simply navigate to the Folder Options
dialog box, but you must change a registry setting. This change
is documented in the Microsoft Knowledge Base Article ID 927009
at the following website:
http://support.microsoft.com/kb/927009
Note: This works the same for both PPT and PPTX formats. The only difference is the selection of file type based on the version of PowerPoint output you will be generating.
Grouping Tables and Components in a PowerPoint Slide
|
How to: |
When table elements are placed on a PowerPoint slide, the elements are placed in individual text boxes to allow for explicit positioning to match the other positioned drivers, such as PDF and DHTML.
The PPTXGROUP parameter enables you to group elements together in a PPTX report. You can rotate, flip, move, or resize objects within a group at the same time as though they were a single object. You can also change the attributes of all of the objects in a group at one time, including font, color, or size, and you can ungroup a group of objects at any time, and then regroup them later.
In WebFOCUS, grouping is done within each report component. Objects within the report component (or stand-alone report), including data, all headings and footings, and images, are grouped together. In compound reports, each component report is grouped individually and non-component elements, such as drawing objects, lines, and images, are not included in any group.
Syntax: How to Group Tables and Components in a PowerPoint Slide
SET PPTXGROUP = {ON|OFF}The command can also be issued from within a report using:
ON TABLE SET PPTXGROUP = {ON|OFF}In a StyleSheet:
TYPE=REPORT, PPTXGROUP = {ON|OFF}where:
- ON
-
Enables you to group elements together in a PPTX report.
- OFF
-
Indicates no grouping of elements, which is the legacy behavior. OFF is the default value.
Example: Displaying Group Tables and Components in a Standard Report
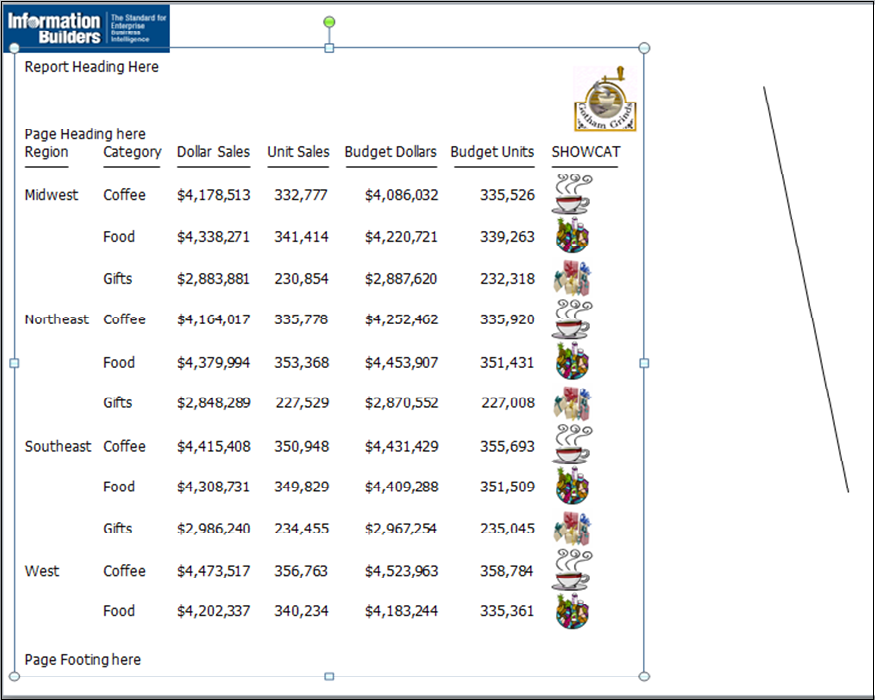
In the following standard report, the grouping is defined for the core report elements, excluding images and drawing objects, defined at the TYPE=REPORT level.
TABLE FILE GGSALES
SUM DOLLARS/D12CM UNITS/D12C BUDDOLLARS/D12CM BUDUNITS/D12C
COMPUTE SHOWCAT/A100=CATEGORY||'.GIF';
BY REGION
BY CATEGORY
ON TABLE SUBHEAD
"Report Heading Here"
" "
" "
" "
HEADING
"Page Heading here"
FOOTING
"Page Footing here"
ON TABLE SUBFOOT
"Report Footing Here"
ON TABLE PCHOLD AS GROUPTEST FORMAT PPTX
ON TABLE SET STYLE *
TYPE=REPORT, PPTXGROUP = ON, SQUEEZE=ON, FONT=TAHOMA,SIZE=12, ORIENTATION=LANDSCAPE, $
TYPE=REPORT, OBJECT=LINE, POSITION=(9 1), DIMENSION=(1 5), COLOR=BLUE, $
TYPE=REPORT, IMAGE=IBILOGO, POSITION=(0 0), $
TYPE=TABHEADING, IMAGE=GGLOGO.GIF, POSITION=(6.5 .10), $
TYPE=DATA,COLUMN=SHOWCAT, IMAGE=(SHOWCAT), PRESERVERATIO=ON,
SIZE=(.5 .5), $
END
The output is:
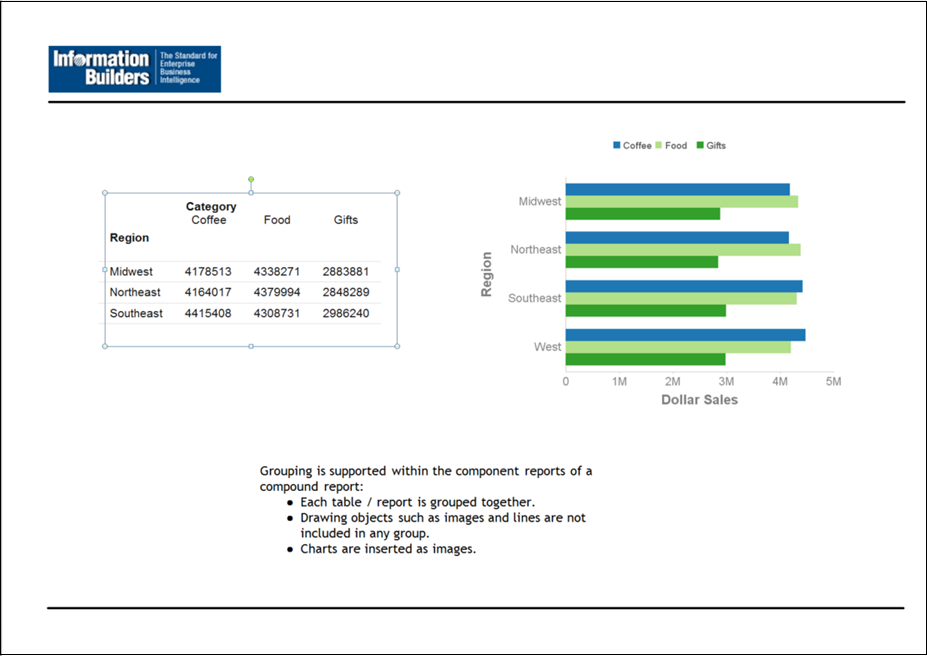
Example: Displaying Group Tables and Components in a Compound Report
In the following compound report, the grouping is defined for the component report. Additional objects on the page, including the chart image, logo image, lines, and text box are not included in the grouping.
SET HTMLARCHIVE=ON
SET PPTXGRAPHTYPE=PNG
SET PPTXGROUP=ON
COMPOUND LAYOUT PCHOLD FORMAT PPTX
UNITS=IN, $
SECTION=section1, LAYOUT=ON, MERGE=OFF, ORIENTATION=LANDSCAPE, PAGESIZE=PPT Slide, $
PAGELAYOUT=1, NAME='Page layout 1', TEXT='Page layout 1', BOTTOMMARGIN=0.5, TOPMARGIN=0.5, $
OBJECT=STRING, NAME='text1', TEXT='<left>Grouping is supported within the component reports of a compound report:
<ul type=disc>
<LI>Each table / report is grouped together. </LI>
<LI>Drawing objects such as images and lines are not included in any group. </LI>
<LI>Charts are inserted as images.</LI></ul><div><br></div><br></left>',
POSITION=(2.764 4.958), MARKUP=ON, WRAP=ON, DIMENSION=(4.000 1.992), FONT='TREBUCHET MS', COLOR=RGB(0 0 0), SIZE=10, $
COMPONENT='report1', TEXT='report1', POSITION=(1.028 2.083), DIMENSION=(4.431 1.667), $
COMPONENT='chart2', TEXT='chart2', POSITION=(4.972 1.319), DIMENSION=(4.456 3.085), COMPONENT-TYPE=GRAPH, $
OBJECT=BOX, NAME='line1', POSITION=(0.498 6.500),
DIMENSION=(9.167 0.022), BACKCOLOR=BLACK, BORDER-COLOR=BLACK, $
OBJECT=BOX, NAME='line2', POSITION=(0.502 1.097),
DIMENSION=(9.167 0.022), BACKCOLOR=BLACK, BORDER-COLOR=BLACK, $
OBJECT=IMAGE, NAME='image4', IMAGE=ibologo.gif, ALT='',
POSITION=(0.502 0.499), DIMENSION=(1.861 0.506), $
END
SET COMPONENT='report1'
TABLE FILE GGSALES
SUM
   GGSALES.SALES01.DOLLARS
BY GGSALES.SALES01.REGION
ACROSS LOWEST GGSALES.SALES01.CATEGORY
ON TABLE SET PAGE-NUM NOLEAD
ON TABLE NOTOTAL
ON TABLE PCHOLD FORMAT PPTX
ON TABLE SET STYLE *
     INCLUDE=IBFS:/FILE/IBI_HTML_DIR/ibi_themes/Warm.sty,$
$
ENDSTYLE
END
SET COMPONENT='chart2' SET PAGE-NUM=NOLEAD SET ARGRAPHENGINE=JSCHART SET EMBEDHEADING=ON SET GRAPHDEFAULT=OFF GRAPH FILE GGSALES SUM GGSALES.SALES01.DOLLARS BY GGSALES.SALES01.CATEGORY ACROSS GGSALES.SALES01.REGION ON GRAPH PCHOLD FORMAT HTML ON GRAPH SET VZERO OFF ON GRAPH SET GRWIDTH 1 ON GRAPH SET UNITS 'PIXELS' ON GRAPH SET HAXIS 770.0 ON GRAPH SET VAXIS 405.0 ON GRAPH SET GRMERGE ADVANCED ON GRAPH SET GRMULTIGRAPH 0 ON GRAPH SET GRLEGEND 1 ON GRAPH SET GRXAXIS 1 ON GRAPH SET LOOKGRAPH HBAR ON GRAPH SET STYLE *
*GRAPH_SCRIPT
setPieDepth(0);
setPieTilt(0);
setDepthRadius(0);
setCurveFitEquationDisplay(false);
setPlace(true);
*END
INCLUDE=IBFS:/FILE/IBI_HTML_DIR/ibi_themes/Warm.sty,$
TYPE=REPORT, TITLETEXT='WebFOCUS Report', $
*GRAPH_SCRIPT
setLegendPosition(4);
*GRAPH_JS_FINAL
"blaProperties": {
    "orientation": "horizontal"
},
"agnosticSettings": {
    "chartTypeFullName": "Bar_Clustered_Horizontal"
}
*END
ENDSTYLE
END
-RUN

COMPOUND END
The output is:
Date and Page/Slide Number
You can add the date and page numbers to both single and Compound Reports.
- For single reports, use the TABPAGENO feature and the associated attributes.
- For Compound Reports, add your data and page number to text objects. For more information, see Text Formatting Markup Tags for a Text Object.
Text Formatting Markup Tags for a Text Object
|
Topics: |
Note: If your text contains any open caret characters (<), you must put a blank space after each open caret that is part of the text, for example, “< 250”. If you do not, everything following the open caret will be interpreted as the start of a markup tag and will not display as text.
Font Properties
The font tag supports three attributes: face, size, and color (where the color must be specified as the hexadecimal number code for the color):
<font face="font" size=[+|-]n color=color_code>text</font>
For example:
<font face="New Century Schoolbook">Test1</font>
<font face="Times" size=12>test2</font>
<font face="Times New Roman" color=#0000FF size=+4>Test3</font>
<font size=-2 face="Times New Roman" color=#0000FF >Test4</font>
Text Styles
The supported text styles are bold, italic, underline, and superscript:
Bold: <b>text</b>
Italic: <i>text</i>
Underline: <u>text</u>
Superscript: <sup>text</sup>
Line Breaks
The line break tag after a portion of text begins the next portion of text on a new line. Note that there is no closing tag for a line break:
<br>
Text Alignment
The alignment options pertain to wrapped text, as well as specified line breaks. Both horizontal justification and vertical alignment are supported.
- Horizontal Justification
Left Justification:
<left>text</left>
Right Justification:
<right>text</right>
Center Justification:
<center>text</center>
Full Justification:
<full>text</full>
- Vertical Alignment
Top Alignment:
<top>text</top>
Middle Alignment:
<mid>text</mid>
Bottom Alignment:
<bottom>text</bottom>
Unordered (Bullet) List
The unordered (ul) list tag encloses a bullet list. Each item is enclosed in a list item tag (li). The start tag and end tag for the list must each be on its own line. Each list item must start on a new line:
<ul>
<li>list item1</li>
<li>list item2</li>
  .
  .
  .
</ul>
By default, the bullet type is disc. You can also specify circle or square:
<ul type=disc>
<ul type=circle>
<ul type=square>
Ordered (Number or Letter) List
The ordered (ol) list tag encloses a list in which each item has a consecutive number or letter. Each item is enclosed in a list item tag (li). The start tag and end tag for the list must each be on its own line. Each list item must start on a new line:
<ol>
<li>list item1</li>
<li>list item2</li>
  .
  .
  .
</ol>
By default, Arabic numerals (type=1) are used for the ordering of the list. You can specify the following types of order:
Arabic numerals (the default): <ol type=1>
Lowercase letters: <ol type=a>
Uppercase letters: <ol type=A>
Lowercase Roman numerals: <ol type=I>
Uppercase Roman numerals: <ol type=I>
Hyperlinks
Hyperlinks can be included within text markup in a PPTX output file.
The syntax for the anchor markup tag is a subset of the HTML anchor syntax:
<a href="hyperlink">Text to display</a>
where:
- hyperlink
-
Is the hyperlink to jump to when the text is clicked.
- Text to display
-
Is the text to display for the hyperlink.
For example:
<a href="http://www.example.com/help.htm">Click here for help</a>
No other attributes are supported in the anchor markup tag.
Page Numbering
There are two pseudo-HTML tags for embedding page numbers in text on a Page Master for a Coordinated Compound Layout report:
Current page number: <ibi-page-number/>
Total number of pages: <ibi-total-pages/>
Note that when MARKUP=ON, space is allocated for the largest number of pages, so there may be a wide gap between the page number and the text that follows. To remove the extra space in the text object that has the page numbering tags:
-
If specific styling of the text object is not required, do not insert markup tags, and turn MARKUP=OFF.
MARKUP=OFF, TEXT='Page <ibi-page-number/> of <ibi-total-pages/> of Sales Report', $
This displays the following output:
Page 1 of 100 of Sales Report
-
If specific styling of the text object is required, you must set MARKUP=ON. With MARKUP=ON, set WRAP=OFF and do not place any styling tags between the page number variables within the string. Tags can be used around the complete Page n of m string. The following code produces a page number string without the extra spaces:
MARKUP=ON, WRAP=OFF, TEXT='<font face="ARIAL" size=10><i>Page <ibi-page-number/> of <ibi-total-pages/> of Sales Report </i>', $
This displays the following output:

Dates
To display a date in the report output, insert a WebFOCUS date variable in a text object on a Page Master (such as &DATEtrMDYY) in the text object.
Example: Formatting a Compound Layout Text Object With Markup Tags
The following request displays a text object with markup tags in a PPTX output file.
Important: Text markup syntax cannot contain hidden carriage return or line feed characters. For purposes of presenting the example in this documentation, line feed characters have been added so that the sample code wraps to fit within the printed page. To run this example in your environment, copy the code into a text editor and delete any line feed characters within the text markup object by going to the end of each line and pressing the Delete key. In some instances, you may need to add a space to maintain the structure of the string. For additional information on displaying carriage returns within the text object see Text Formatting Markup Tags for a Text Object.
SET PAGE-NUM=OFF
SET LAYOUTGRID=ON
TABLE FILE GGSALES
BY REGION NOPRINT
ON TABLE PCHOLD AS LINESP1 FORMAT PPTX
ON TABLE SET STYLE *
type=report, size=8, $
object=string, position=(1 1), dimension=(7 3), wrap=on, markup=on,
 linespacing=multiple(3),
 text='<b><font face="Arial" size=12>This paragraph is triple-spaced
 (LINESPACING=MULTIPLE(3)):</font></b>
 <full>Our <i>primary</I> goal for fiscal 2006 was to accelerate our
 transformation to customer centricity. In this letter, I’d like to
 give you an update on this work, which contributed to the 22-percent
 increase in earnings from continuing operations we garnered for fiscal
 2006. Since the past is often prologue to the future, I’d like to
 describe how customer centricity is influencing not only our goals for
 fiscal 2007, but also our long-term plans. At Gotham Grinds, customer
 centricity means treating each customer as a unique individual, meeting
 their needs with end-to-end solutions, and engaging and energizing our
 employees to serve them.</full>', $
ENDSTYLE
END
In this request:
- No fields from the data source are displayed. Only the text object displays on the output.
- The SET LAYOUTGRID command displays a grid to indicate the coordinates and dimensions of the text object.
- The OBJECT=STRING declaration specifies triple spacing: LINESPACING=MULTIPLE(3).
- The following text is displayed in boldface, in the Arial font
face, and with a font size of 12 (the default is 8 from the TYPE=REPORT
declaration):
‘This paragraph is triple-spaced (LINESPACING=MULTIPLE(3)):’
The markup for this formatting is:
<b><font face="Arial" size=12>This paragraph is triple-spaced (LINESPACING=MULTIPLE(3)):</font></b>
Note, however, that the image has been resized to fit the page so the font may appear smaller:
- The remainder of the text is displayed with full justification
(left and right sides align):
<full>Our ... </full>
- The following markup displays the text ‘primary’ in italics:
<i>primary</I>
The output is:

Example: Drawing Text and Line objects on a Page Master
The following request places a line on the Page Master between the header report and the component reports and places a line and a text string on the bottom of each page:
SET PAGE-NUM=OFF
SET SQUEEZE=ON
COMPOUND LAYOUT PCHOLD FORMAT PPTX
SECTION=S1, LAYOUT=ON, MERGE=ON, ORIENTATION=LANDSCAPE, $
PAGELAYOUT=ALL, $
COMPONENT=HEADER, TYPE=REPORT, POSITION=(1 1), DIMENSION=(4 4), $
OBJECT=STRING, POSITION=(1 6.6), MARKUP=ON,
TEXT='<font face="Arial" color=#0000FF size=12> Slide <ibi-page-number/>
        </font> ', WRAP=ON, DIMENSION=(4 4),$
OBJECT=LINE, POSITION=(1 2.5), ENDPOINT=(9.5 2.5),
        BORDER-COLOR=BLUE,$
OBJECT=LINE, POSITION=(1 6.5), ENDPOINT=(9.5 6.5),
        BORDER-COLOR=BLUE,$
PAGELAYOUT=1, $
COMPONENT=R1, TYPE=REPORT, POSITION=(1 3), DIMENSION=(4 4), $
COMPONENT=R2, TYPE=REPORT, POSITION=(6 3), DIMENSION=(4 4), $
PAGELAYOUT=2, $
COMPONENT=R3, TYPE=REPORT, POSITION=(4 3), DIMENSION=(4 4), $
END
SET COMPONENT=HEADER TABLE FILE GGSALES " " "Report package for <REGION" BY REGION NOPRINT ON TABLE HOLD FORMAT PDF ON TABLE SET STYLE * TYPE=REPORT, FONT=HELVETICA, SIZE=20, $ TYPE=REPORT, IMAGE=gglogo.gif, POSITION=(+.25 +.25), $ TYPE=HEADING, LINE=2, ITEM=1, POSITION=1.5, $ END SET COMPONENT=R1 TABLE FILE GGSALES "Sales report for <REGION" " " SUM DOLLARS/F8M BY REGION NOPRINT BY ST BY CITY ON TABLE SET STYLE * TYPE=REPORT, FONT=HELVETICA, COLOR=RED, SQUEEZE=ON, $ END SET COMPONENT=R2 TABLE FILE GGSALES "Number of unit sales per product for <REGION" " " SUM CNT.UNITS AS 'Number of units sold' BY REGION NOPRINT BY PRODUCT ON TABLE SET STYLE * TYPE=REPORT, FONT=HELVETICA, COLOR=BLUE, SQUEEZE=ON, $ END SET COMPONENT=R3 TABLE FILE GGSALES "Report R3 for <REGION" BY REGION NOPRINT SUM DOLLARS BY ST ON TABLE SET STYLE * TYPE=REPORT, FONT=HELVETICA, COLOR=GREEN, $ END COMPOUND END
The first page of output is:

The second page of output has the same drawing objects:

Example: Vertically Aligning Text Markup in PPTX Report Output
The following request creates three boxes and places a text string object within each of them:
- In the left box, the text is aligned vertically at the top.
- In the middle box, the text is aligned vertically at the middle.
- In the right box, the text is aligned vertically at the bottom.
Important: Text markup syntax cannot contain hidden carriage return or line feed characters. For purposes of presenting the example in this documentation, line feed characters have been added so that the sample code wraps to fit within the printed page. To run this example in your environment, copy the code into a text editor and delete any line feed characters within the text markup object by going to the end of each line and pressing the Delete key. In some instances, you may need to add a space to maintain the structure of the string. For additional information on displaying carriage returns within the text object see Text Formatting Markup Tags for a Text Object.
SET PAGE-NUM=OFF
TABLE FILE GGSALES
BY REGION NOPRINT
ON TABLE PCHOLD FORMAT PPTX
ON TABLE SET STYLE *
type=report, font=arial, size=10, $
object=box, position=(1 1), dimension=(6 1), $
object=line, position=(3 1), endpoint=(3 2), $
object=line, position=(5 1), endpoint=(5 2), $
object=string, text='<top>Vertically aligned text within a text object using top alignment.</top>', position=(1.05 1), dimension=(2 1), linespacing=exact(.15), markup=on, wrap=on, $
object=string, text='<mid>Vertically aligned text within a text object using middle alignment.</mid>', position=(3.05 1), dimension=(2 1), linespacing=exact(.15), markup=on, wrap=on, $
object=string, text='<bottom>Vertically aligned text within a text object using bottom alignment.</bottom>', position=(5.05 .9), dimension=(2 1),linespacing=exact(.15), markup=on, wrap=on, $
END
The output is:

Display Unordered Lists With Bullets, Discs, Squares, and Circles
The unordered (ul) list tag encloses a bulleted list in which each item is marked by a bullet of a particular shape or design. Each item or point is enclosed in a list item tag (li). The start and end tags for each point may occupy one continuous line or be placed on different lines. When each list is placed on a new line, insert a backslash (\) after each closing tag.
Example: Displaying Unordered Lists With Bullets, Squares, and Circles
The following request displays a bulleted list with bullets of particular shapes and designs.
<ul>
<li>list item1</li>\
<li>list item2</li>\
</ul>
SET HTMLARCHIVE=ON
COMPOUND LAYOUT PCHOLD FORMAT PPTX
UNITS=IN, $
SECTION=section1, LAYOUT=ON, MERGE=OFF, ORIENTATION=PORTRAIT, PAGESIZE=Letter, SHOW_GLOBALFILTER=OFF, $
PAGELAYOUT=1, NAME='Page layout 1', text='Page layout 1',
BOTTOMMARGIN=0.5, TOPMARGIN=0.5, $
OBJECT=STRING, NAME='text1', TEXT='<font face="TREBUCHET MS" size=10>\
<UL>
<LI>The first level of a bulleted line </LI>\
<UL>
<LI><b>Second level:</b> Indented or nested line one</LI>\
<LI><b>Second level:</b> Indented or nested line two</LI>\
<LI><b>Second level:</b> Indented or nested line three</LI>\
<UL>\
<LI>Third level: Indented or nested line one</LI>\
<LI>Third level: Indented or nested line two</LI>\
</UL>\
<BR><BR><BR><U><DIV><BR></DIV></U></font>', POSITION=(0.938 0.938),
MARKUP=ON, WRAP=ON, DIMENSION=(6.563 4.167), $
COMPONENT='DfltCmpt1', POSITION=(0 0), DIMENSION=(0 0), $
END
SET COMPONENT='DfltCmpt1'
TABLE FILE SYSCOLUM
" "
SUM TBNAME NOPRINT
IF READLIMIT EQ 1
ON TABLE SET PREVIEW ON
ON TABLE PCHOLD FORMAT PPTX
ON TABLE SET STYLE *
END
COMPOUND END
The output is:

The default bullet type is disc. You may also specify circle or square, as shown in the following request.
SET HTMLARCHIVE=ON
COMPOUND LAYOUT PCHOLD FORMAT PPTX
UNITS=IN, $
SECTION=section1, LAYOUT=ON, MERGE=OFF, ORIENTATION=PORTRAIT, PAGESIZE=Letter, SHOW_GLOBALFILTER=OFF, $
PAGELAYOUT=1, NAME='Page layout 1', text='Page layout 1',
BOTTOMMARGIN=0.5, TOPMARGIN=0.5, $
OBJECT=STRING, NAME='text1', TEXT='<font face="TREBUCHET MS" size=10>\
<UL type=square>\
<LI> line 1, showing a square </LI>\
<UL type=circle>\
<LI> line 2, showing a circle </LI>\
<UL type=disc>\
<LI> line 3, showing a disc </LI>\
</UL>\
<BR><BR><BR><U><DIV><BR></DIV></U></font>', POSITION=(0.938 0.938),
MARKUP=ON, WRAP=ON, DIMENSION=(6.563 4.167), $
COMPONENT='DfltCmpt1', POSITION=(0 0), DIMENSION=(0 0), $
END
SET COMPONENT='DfltCmpt1'
TABLE FILE SYSCOLUM
" "
SUM TBNAME NOPRINT
IF READLIMIT EQ 1
ON TABLE SET PREVIEW ON
ON TABLE PCHOLD FORMAT PPTX
ON TABLE SET STYLE *
END
COMPOUND END
The output is:

Inserting Images In Various Elements of PowerPoint PPTX Reports
|
How to: |
WebFOCUS supports the placement of images within each element or node of the report. An image, such as a logo, gives corporate identity to a report, or provides visual appeal. Data specific images can be placed in headers and footers to provide additional clarity and style. The image must reside on the WebFOCUS Reporting Server in a directory named on EDAPATH or APPPATH. If the file is not on the search path, supply the full path name.
All images will be placed in the defined area, based on the explicit positioning defined by the POSITION attribute within the style sheet.
Images can be placed in any available WebFOCUS reporting node or element. Supported image formats include .gif, .jpg, and .png. Images may be positioned and resized by using the POSITION and SIZE attributes to set the x, y coordinates and height, width settings, respectively. Justification of images is not supported.
Note: The highest quality image format for charts is PNG, which allows for transparency, as well as better integration with the styling within slide backgrounds.
Syntax: How to Insert Images Into WebFOCUS PPTX Reports
TYPE={REPORT|HEADING|data}, IMAGE={file|(column)}
[,BY=byfield] [,SIZE=(w h)] ,$
where:
- REPORT
-
Embeds an image in the body of a report. The image appears in the background of the report. REPORT is the default value.
- HEADING
-
Embeds an image in a heading or footing. Valid values are TABHEADING, TABFOOTING, FOOTING, HEADING, SUBHEAD, and SUBFOOT. Provide sufficient blank space in the heading or footing so that the image does not overlap the heading or footing text. You may also want to place heading or footing text to the right of the image using spot markers.
- data
-
Defines a data column in which to place the image. Must be used with COLUMNS=column title to identify the specific report column where the image should be anchored.
- file
-
Is the name of the image file. It must reside on the WebFOCUS Reporting Server in a directory named on EDAPATH or APPPATH. If the file is not on the search path, supply the full path name. When specifying a GIF file, you can omit the file extension.
Example: Inserting Images in the Headers and Footers of a Report
The following request inserts images in the headers and footers of a report.
TABLE FILE EMPDATA
SUM
EMPDATA.EMPDATA.SALARY
BY LOWEST EMPDATA.EMPDATA.DEPT
BY EMPDATA.EMPDATA.LASTNAME
ON EMPDATA.EMPDATA.DEPT SUBFOOT "Subfoot"
" "
ON EMPDATA.EMPDATA.DEPT PAGE-BREAK
ON TABLE SUBHEAD
"Report Heading"
" "
HEADING
"Page Heading"
" "
FOOTING
"Page Footing"
" "
ON TABLE SUBFOOT "Report Footing"
" "
ON TABLE SET PAGE-NUM NOLEAD
ON TABLE NOTOTAL
ON TABLE PCHOLD FORMAT PPTX
ON TABLE SET STYLE *
PAGESIZE='PPT Slide',
  ORIENTATION=LANDSCAPE,
$
TYPE=REPORT,
  OBJECT=STATUS-AREA,
  JUSTIFY=LEFT,
  PAGE-LOCATION=BOTTOM,
$
TYPE=REPORT,
  GRID=OFF,
  FONT='ARIAL',
  SIZE=12,
  STYLE=NORMAL,
  SQUEEZE=ON,
  TOPGAP=0.05,
  BOTTOMGAP=0.05,
  BORDER-COLOR=RGB(219 219 219),
  TITLELINE=SKIP,
  TOPMARGIN=.75,
  LEFTMARGIN=.5,
$
TYPE=TITLE,
  COLOR=RGB(51 51 51),
  STYLE=-UNDERLINE +BOLD,
$
TYPE=DATA,
  BORDER-TOP=LIGHT,
  BORDER-TOP-COLOR=RGB(219 219 219),
$
TYPE=SUBTOTAL,
  STYLE=BOLD,
  BORDER-TOP=LIGHT,
  BORDER-TOP-COLOR=RGB(219 219 219),
$
TYPE=TABHEADING,
  SIZE=14,
  JUSTIFY=LEFT,
$
TYPE=TABHEADING,
  IMAGE=smplogo1.gif,
  POSITION=(+4.500000 +0.000000),
$
TYPE=TABFOOTING,
  SIZE=10,
$
TYPE=SUBHEAD,
  BACKCOLOR=RGB(246 246 246),
  BORDER-TOP=LIGHT,
  BORDER-TOP-COLOR=RGB(219 219 219),
$
TYPE=SUBHEAD,
  BY=1,
  BORDER-TOP=LIGHT,
  BORDER-TOP-COLOR=RGB(102 102 102),
$
TYPE=SUBHEAD,
  OBJECT=FIELD,
  STYLE=BOLD,
$
TYPE=SUBFOOT,
  SIZE=9,
  BORDER-TOP=LIGHT,
  BORDER-TOP-COLOR=RGB(219 219 219),
$
TYPE=TABFOOTING,
  IMAGE=smplogo1.gif,
  POSITION=(+4.500000 +0.000000),
$
TYPE=HEADING,
  SIZE=12,
$
TYPE=HEADING,
  IMAGE=poweredbyibi.gif,
  POSITION=(+4.500000 +0.000000),
$
TYPE=FOOTING,
  SIZE=10,
$
TYPE=FOOTING,
  STYLE=BOLD,
  JUSTIFY=LEFT,
  IMAGE=poweredbyibi.gif,
  POSITION=(+4.500000 +0.000000),
$
TYPE=SUBFOOT,
  SIZE=10,
$
TYPE=SUBFOOT,
  IMAGE=webfocus1.gif,
  POSITION=(+4.500000 +0.000000),
  SIZE=(1.000000 0.500000),
$
ENDSTYLE
END
The output is:

Example: Inserting Images in the Data Cells of a Report
The following request inserts images in the data cells of a report.
APP PATH IBISAMP IBIDEMO
TABLE FILE GGSALES
SUM DOLLARS/D17M AS 'Revenue'
COMPUTE Surplus/A15 = IF DOLLARS GE 4000000 THEN 'g1.gif' ELSE 'r1.gif';
BY REGION
BY ST
ON TABLE SUBHEAD
"Current Year Revenue"
FOOTING
"Revenue in excess of 4 million"
"Revenue less than 4 million"
ON TABLE SET PAGE-NUM NOLEAD
ON TABLE PCHOLD FORMAT PPTX
ON TABLE SET SQUEEZE ON
ON TABLE SET STYLE *
TYPE=REPORT,
     GRID=OFF,
     FONT='ARIAL',
     SIZE=14,
     STYLE=NORMAL,
     SQUEEZE=ON,
     TOPGAP=0.05,
     BOTTOMGAP=0.05,
     BORDER-COLOR=RGB(219 219 219),
     TITLELINE=SKIP,
     ORIENTATION = LANDSCAPE,TOPMARGIN=1,LEFTMARGIN=1,
$
TYPE=DATA, COLUMN=Surplus, IMAGE=(Surplus), SIZE=(.2 .2),$
TYPE=FOOTING,IMAGE=g1.gif, position=(.122 .055), SIZE=(.2 .2 ),$
TYPE=FOOTING,line=1,item=1,position=.5,$
TYPE=FOOTING,IMAGE='r1.gif', position=(.122 .33), SIZE=(.2 .2),$
TYPE=FOOTING,line=2,item=1, position=.5,$
TYPE=DATA,
     BORDER-TOP=LIGHT,
     BORDER-TOP-COLOR=RGB(219 219 219),
$
TYPE=TITLE,
COLOR=RGB(51 51 51),
STYLE=-UNDERLINE +BOLD,
$
TYPE=TABHEADING,
SIZE=18,
JUSTIFY=LEFT,
$
TYPE=TABFOOTING,
SIZE=10,
$
TYPE=HEADING,
JUSTIFY=LEFT,
SIZE=12,
$
TYPE=SUBHEAD,
BACKCOLOR=RGB(246 246 246),
BORDER-TOP=LIGHT,
BORDER-TOP-COLOR=RGB(219 219 219),
$
TYPE=SUBHEAD,
BY=1,
BORDER-TOP=LIGHT,
BORDER-TOP-COLOR=RGB(102 102 102),
$
TYPE=SUBHEAD,
OBJECT=FIELD,
STYLE=BOLD,
$
TYPE=SUBFOOT,
SIZE=9,
BORDER-TOP=LIGHT,
BORDER-TOP-COLOR=RGB(219 219 219),
$
END
The report output is as follows:

Displaying PPTX Charts in PNG Image Format
|
How to: |
The PPTXGRAPHTYPE attribute enhances the quality of charts embedded into PowerPoint (PPTX) slides. As of Release 8.2.01M, you can use the PNG output format to enhance the image and text quality and support transparency.
This is useful for a number of important scenarios, including use of templates with background color and for overlapping a chart with other components and drawing objects.
Syntax: How to Display PPTX Charts in PNG Image Format
SET PPTXGRAPHTYPE={PNG|PNG_NOSCALE|JPEG}where:
- PNG
-
Scales the PNG image to twice its dimensions to get significantly improved quality. This may cause problems if you have non-scalable items in the chart, such as text with absolute point sizes (including embedded scales headings). The output file is also larger due to the larger bitmap. Text within the chart is noticeable sharper than the legacy JPEG format.
PNG preserves font sizes in the chart when it is internally rescaled for increased resolution. It converts absolute font sizes set in the stylesheet (*GRAPH_SCRIPT) to sizes expressed in virtual coordinates (which are relative to the dimensions of the chart) and generates font sizes for embedded headings and footings in virtual coordinates.
- PNG_NOSCALE
-
Renders in PNG, but does not scale. This produces slightly better quality than JPEG. Going from JPEG to PNG_NOSCALE makes the chart sharper, but has only a slight effect on the text.
- JPEG
-
Indicates legacy format. This is the default value.
Example: Displaying a PNG Chart With Transparency
Transparency enables greater control over how components and drawing objects can be placed together on a slide. The following report contains a text box, report, and chart that can be intertwined on the page because the background of the chart does not cover the contents of the other objects.
SET PPTXGRAPHTYPE=PNG

COMPOUND LAYOUT PCHOLD FORMAT PPTX
UNITS=IN, $
SECTION=section1, LAYOUT=ON, MERGE=OFF, ORIENTATION=LANDSCAPE,
PAGESIZE=PPT Slide, $
PAGELAYOUT=1, NAME='Page layout 1', text='Page layout 1',
BOTTOMMARGIN=0.5, TOPMARGIN=0.5, $
COMPONENT='report1', TEXT='report1', POSITION=(5.088 1.375),
DIMENSION=(2.260 2.500), $
COMPONENT='chart2', TEXT='chart2', POSITION=(0.815 1.351),
DIMENSION=(5.104 2.917), COMPONENT-TYPE=GRAPH,  $
OBJECT=STRING, NAME='text1', TEXT='<left>PNG charts can be defined with
transparency to allow the background to show through and allow for
overlapping components to optimize the use of space on the slide.
</left>',
POSITION=(0.500 0.979), MARKUP=ON, WRAP=ON, DIMENSION=(4.635 0.729),
font='TREBUCHET MS', color=RGB(0 0 0), size=10, $
END
SET COMPONENT='report1'
TABLE FILE GGSALES
SUM
   GGSALES.SALES01.DOLLARS
BY GGSALES.SALES01.REGION
ACROSS LOWEST GGSALES.SALES01.CATEGORY
ON TABLE SET PAGE-NUM NOLEAD
ON TABLE NOTOTAL
ON TABLE PCHOLD FORMAT PPTX
ON TABLE SET STYLE *
INCLUDE=IBFS:/FILE/IBI_HTML_DIR/ibi_themes/Warm.sty,$
$
ENDSTYLE
END
SET COMPONENT='chart2'
GRAPH FILE ggsales
SUM GGSALES.SALES01.DOLLARS
BY GGSALES.SALES01.CATEGORY
ACROSS GGSALES.SALES01.REGION
ON GRAPH PCHOLD FORMAT HTML
ON GRAPH SET VZERO OFF
ON GRAPH SET HTMLENCODE ON
ON GRAPH SET GRAPHDEFAULT OFF
ON GRAPH SET EMBEDHEADING ON
ON GRAPH SET GRWIDTH 1
ON GRAPH SET UNITS 'PIXELS'
ON GRAPH SET HAXIS 770.0
ON GRAPH SET VAXIS 405.0
ON GRAPH SET GRMERGE ADVANCED
ON GRAPH SET GRMULTIGRAPH 0
ON GRAPH SET GRLEGEND 1
ON GRAPH SET GRXAXIS 1
ON GRAPH SET LOOKGRAPH HBAR
ON GRAPH SET STYLE *
*GRAPH_SCRIPT
setPieDepth(0);
setPieTilt(0);
setDepthRadius(0);
setPlace(true);
setCurveFitEquationDisplay(false);
*END
INCLUDE=IBFS:/FILE/IBI_HTML_DIR/ibi_themes/Warm.sty,$
TYPE=REPORT, TITLETEXT='WebFOCUS Report', $
*GRAPH_SCRIPT
setFillColor(getChartBackground(),new Color(255,255,255,0));
setLegendPosition(4);
*GRAPH_JS_FINAL
"blaProperties": {
    "orientation": "horizontal"
},
"agnosticSettings": {
    "chartTypeFullName": "Bar_Clustered_Horizontal"
}
*END
ENDSTYLE
END
-RUN

COMPOUND END
The output is:

Example: Displaying a PNG Image With Transparency in a Designated Template
The following compound report places a chart defined with transparency on a slide from the designated template that contains background colors and patterns.
SET PPTXGRAPHTYPE=PNG

COMPOUND LAYOUT PCHOLD FORMAT PPTX
UNITS=IN, $
SECTION=section1, LAYOUT=ON, MERGE=OFF, ORIENTATION=LANDSCAPE,
PAGESIZE=Letter, $
PAGELAYOUT=1, NAME='Page layout 1', text='Page layout 1', $
COMPONENT='ppt_template', $
COMPONENT='chart1', TEXT='chart1', POSITION=(0.500 2.10),
DIMENSION=(9.336 3.437),
COMPONENT-TYPE=GRAPH, ARREPORTSIZE=DIMENSION, $
END

SET COMPONENT='ppt_template'
TABLE FILE SYSCOLUM
SUM TBNAME NOPRINT
IF READLIMIT EQ 1
ON TABLE PCHOLD FORMAT PPTX TEMPLATE 'golden.potx' SLIDENUMBER 1
END
SET COMPONENT='chart1'
GRAPH FILE ggsales
SUM GGSALES.SALES01.DOLLARS
BY GGSALES.SALES01.CATEGORY
BY GGSALES.SALES01.REGION
BY GGSALES.SALES01.ST
ON GRAPH PCHOLD FORMAT HTML
ON GRAPH SET EMBEDHEADING ON
ON GRAPH SET GRWIDTH 1
ON GRAPH SET UNITS PIXELS
ON GRAPH SET HAXIS 770.0
ON GRAPH SET VAXIS 405.0
ON GRAPH SET GRMERGE ADVANCED
ON GRAPH SET GRMULTIGRAPH 1
ON GRAPH SET GRLEGEND 0
ON GRAPH SET GRXAXIS 2
ON GRAPH SET LOOKGRAPH VBAR
ON GRAPH SET STYLE *
*GRAPH_SCRIPT
setPieDepth(0);
setPieTilt(0);
setDepthRadius(0);
setCurveFitEquationDisplay(false);
setPlace(true);
*END
INCLUDE=IBFS:/FILE/IBI_HTML_DIR/ibi_themes/Warm.sty,$
TYPE=REPORT, TITLETEXT='WebFOCUS Report', $
*GRAPH_SCRIPT
setFillType(getChartBackground(),2);
setGradientNumPins(getChartBackground(),2);
setFillColor(getChartBackground(),new Color(255,255,255,0));
setFillType(getChartBackground(),1);
*END
ENDSTYLE
END
-RUN
COMPOUND END
The output is:

Drill Down From Microsoft PowerPoint
Two types of drill downs are supported:
- WebFOCUS content
- External URL
When working in the WebFOCUS Repository or Content environment, drill-down hyperlinks in PPTX reports will not work when Microsoft PowerPoint opens in a PowerPoint application window instead of in a browser. The current security context and any previously established session-related cookies are not retained and this changes user authorization. The recommendation is to configure one of the three security models described below, to allow successful drill down from reports displayed in a Microsoft PowerPoint application.
The Remember Me Security Model
The Remember Me Security model is a method of user authentication that enables WebFOCUS to store a trusted sign-in cookie locally, on the workstation, for a default period of 14 days. WebFOCUS does not however, store the user password in the sign-in cookie. Enable the Remember Me feature on the Sign-in page. If the end-user uses the Remember Me feature, a persistent cookie is used.
Public Access
Public Access is useful for procedures that are available to everyone within an organization or the general public and do not require authentication. Set up WebFOCUS security such that the PUBLIC user has the necessary permissions to drill down to reports.
Integrated Windows Authentication
Integrated Windows Authentication (IWA) is enabled by configuring the browser. Use SSO with IIS/Tomcat Integrated Windows Authentication. Renegotiation occurs automatically and the PowerPoint formatted reports display correctly.
Refer to the WebFOCUS Security and Administration manual for details on these authentication models.
Example: Drilling Down to an External URL
The following request places a reference to an external URL on the grand total line tag.
TABLE FILE GGSALES
SUM
  GGSALES.SALES01.BUDDOLLARS/D12CM
  GGSALES.SALES01.DOLLARS/D12CM
BY GGSALES.SALES01.REGION
BY GGSALES.SALES01.CATEGORY
BY GGSALES.SALES01.PRODUCT
HEADING
"REVENUE BY REGION "
ON GGSALES.SALES01.REGION SUBTOTAL AS '*TOTAL'
WHERE GGSALES.SALES01.CATEGORY NE 'Gifts';
ON TABLE SET PAGE-NUM NOLEAD
ON TABLE COLUMN-TOTAL AS 'TOTAL'
ON TABLE PCHOLD FORMAT PPTX
ON TABLE SET STYLE *
PAGESIZE='PPT Slide',
  ORIENTATION=LANDSCAPE,
$
TYPE=REPORT,
  OBJECT=STATUS-AREA,
  JUSTIFY=LEFT,
  PAGE-LOCATION=BOTTOM,
$
TYPE=REPORT,
  GRID=OFF,
  FONT='ARIAL',
  SIZE=12,
  STYLE=NORMAL,
  SQUEEZE=ON,
  TOPGAP=0.05,
  BOTTOMGAP=0.05,
  BORDER-COLOR=RGB(219 219 219),
  TITLELINE=SKIP,
  TOPMARGIN=1,
  LEFTMARGIN=1,
$
TYPE=TITLE,
  COLOR=RGB(51 51 51),
  STYLE=-UNDERLINE +BOLD,
$
TYPE=DATA,
  BORDER-TOP=LIGHT,
  BORDER-TOP-COLOR=RGB(219 219 219),
$
TYPE=HEADING,
  JUSTIFY=LEFT,
  SIZE=14,
$
TYPE=SUBTOTAL,
  STYLE=BOLD,
  BORDER-TOP=LIGHT,
  BORDER-TOP-COLOR=RGB(219 219 219),
$
TYPE=GRANDTOTAL,
  OBJECT=TAG,
  URL=http://www.ibi.com,
$
TYPE=REPORT,
  OBJECT=STATUS-AREA,
  JUSTIFY=LEFT,
  PAGE-LOCATION=BOTTOM,
$
TYPE=GRANDTOTAL,
  COLOR=RGB(51 51 51),
  STYLE=BOLD,
  BORDER-TOP=LIGHT,
  BORDER-TOP-COLOR=RGB(102 102 102),
$
ENDSTYLE
END
The output is:

PowerPoint PPTX Presentations Using Templates
PPTX report output can be generated based on PowerPoint templates. This feature allows for the integration of WebFOCUS reports into presentations containing multiple slides. Any native PowerPoint template can be used to generate a new presentation containing a WebFOCUS report.
The following PowerPoint file types can be used as template files to generate PPTX presentations.
|
Template File Type |
Presentation Output Generated |
|---|---|
|
Template (.potx) |
Presentation (.pptx) |
|
Macro-Enabled Template (.potm) |
Macro-Enabled presentation (.pptm) |
|
Presentation (.pptx) |
Presentation (.pptx) |
|
Macro-Enabled presentation (.pptm) |
Macro-Enabled presentation (.pptm) |
Note: For more information on working with active content in macro-enabled templates, see the Microsoft webpage: https://support.office.com/en-nz/article/Enable-or-disable-macros-in-Office-documents-7b4fdd2e-174f-47e2-9611-9efe4f860b12
Example: Using Standard PowerPoint Templates (POTX)
In the following request, the report occupies multiple slides. The designated slide is replaced by as many slides as are needed to display the report output.
TABLE FILE TRAINING
SUM
TRAINING.TRAINING.EXPENSES/D12CM
BY TRAINING.TRAINING.LOCATION
BY TRAINING.TRAINING.PIN
BY LOWEST TRAINING.TRAINING.COURSECODE
BY TRAINING.TRAINING.COURSESTART
BY TRAINING.TRAINING.GRADE
ON TRAINING.TRAINING.LOCATION SUBTOTAL AS 'TOTAL EXPENSES FOR'
ON TRAINING.TRAINING.LOCATION PAGE-BREAK
HEADING
"MONTHLY EXPENSES BY STATE"
" "
ON TABLE SET ASNAMES ON
ON TABLE NOTOTAL
ON TABLE PCHOLD FORMAT PPTX TEMPLATE 'ibi_template.potx' SLIDENUMBER 2
ON TABLE SET STYLE *
PAGESIZE='PPT Slide',
  ORIENTATION=LANDSCAPE,
$
TYPE=REPORT,
  OBJECT=STATUS-AREA,
  JUSTIFY=LEFT,
  PAGE-LOCATION=BOTTOM,
$
TYPE=REPORT,
  GRID=OFF,
  FONT='ARIAL',
  SIZE=14,
  STYLE=NORMAL,
  SQUEEZE=ON,
  TOPGAP=0.05,
  BOTTOMGAP=0.05,
  BORDER-COLOR=RGB(219 219 219),
  TITLELINE=SKIP,
  TOPMARGIN=.1,
  LEFTMARGIN=1.5,
$
TYPE=TITLE,
  COLOR=RGB(51 51 51),
  STYLE=-UNDERLINE +BOLD,
$
TYPE=DATA,
  BORDER-TOP=LIGHT,
  BORDER-TOP-COLOR=RGB(219 219 219),
$
TYPE=HEADING,
  JUSTIFY=LEFT,
  SIZE=16,
$
TYPE=SUBTOTAL,
  STYLE=BOLD,
  BORDER-TOP=LIGHT,
  BORDER-TOP-COLOR=RGB(219 219 219),
$
ENDSTYLE
END
The output is:

Example: Using a Multi-Report Request to Populate Designated Slides in a Template
The following request is a technique for inserting different components across multiple slides.
-* Replace Slide #2
TABLE FILE GGSALES
HEADING
"FIRST SLIDE"
SUM
DOLLARS/D12CM UNITS
BY REGION AS 'My Field'
BY CATEGORY
ON TABLE COLUMN-TOTAL
ON TABLE HOLD AS SLIDE_A FORMAT PPTX TEMPLATE 'ibi_template.potx' SLIDENUMBER 2
ON TABLE SET STYLE *
TYPE=REPORT,
  OBJECT=STATUS-AREA,
  JUSTIFY=LEFT,
  PAGE-LOCATION=BOTTOM,
$
TYPE=REPORT,
  GRID=OFF,
  FONT='ARIAL',
  SIZE=14,
  STYLE=NORMAL,
  SQUEEZE=ON,
  TOPGAP=0.05,
  BOTTOMGAP=0.05,
  BORDER-COLOR=RGB(219 219 219),
  TITLELINE=SKIP,
  ORIENTATION = LANDSCAPE,
  TOPMARGIN=.1,
  LEFTMARGIN=1.5,
$
TYPE=TITLE,
  COLOR=RGB(51 51 51),
  STYLE=-UNDERLINE +BOLD,
$
TYPE=DATA,
  BORDER-TOP=LIGHT,
  BORDER-TOP-COLOR=RGB(219 219 219),
$
TYPE=HEADING,
  JUSTIFY=LEFT,
  SIZE=16,
$
TYPE=DATA,
  COLUMN=DOLLARS,
  COLOR=BLUE,
$
TYPE=REPORT,
  COLUMN=REGION,
  COLOR=RED,
$
TYPE=REPORT,
  COLUMN=CATEGORY,
  COLOR=GREEN,
$
TYPE=GRANDTOTAL,
  COLOR=RGB(51 51 51),
  STYLE=BOLD,
  BORDER-TOP=LIGHT,
  BORDER-TOP-COLOR=RGB(102 102 102),
$
END
-* Replace Slide #3
TABLE FILE GGSALES HEADING
"SECOND SLIDE"
SUM DOLLARS/D12CM UNITS
BY REGION AS 'My Field'
BY CATEGORY
ON TABLE COLUMN-TOTAL
ON TABLE HOLD AS SLIDE_1 FORMAT PPTX TEMPLATE 'slide_a.pptx' SLIDENUMBER 3
ON TABLE COLUMN-TOTAL
ON TABLE SET STYLE *
$
TYPE=REPORT,
  OBJECT=STATUS-AREA,
  JUSTIFY=LEFT,
  PAGE-LOCATION=BOTTOM,
$
TYPE=REPORT,
  GRID=OFF,
  FONT='ARIAL',
  SIZE=14,
  STYLE=NORMAL,
  SQUEEZE=ON,
  TOPGAP=0.05,
  BOTTOMGAP=0.05,
  BORDER-COLOR=RGB(219 219 219),
  TITLELINE=SKIP,
  ORIENTATION = LANDSCAPE,
  TOPMARGIN=.1,
  LEFTMARGIN=1.5,
$
TYPE=TITLE,
  COLOR=RGB(51 51 51),
  STYLE=-UNDERLINE +BOLD,
$
TYPE=DATA,
  BORDER-TOP=LIGHT,
  BORDER-TOP-COLOR=RGB(219 219 219),
$
TYPE=HEADING,
  JUSTIFY=LEFT,
  SIZE=16,
$
TYPE=DATA,
  COLUMN=DOLLARS,
  COLOR=BLUE,
$
TYPE=REPORT,
  COLUMN=REGION,
  COLOR=RED,
$
TYPE=REPORT,
  COLUMN=CATEGORY,
  COLOR=GREEN,
$
TYPE=GRANDTOTAL,
  COLOR=RGB(51 51 51),
  STYLE=BOLD,
  BORDER-TOP=LIGHT,
  BORDER-TOP-COLOR=RGB(102 102 102),
$
END
-* Replace Slide #4
TABLE FILE GGSALES
HEADING
"THIRD SLIDE"
SUM
DOLLARS/D12CM
UNITS
BY REGION AS 'My Field'
BY CATEGORY
ON TABLE COLUMN-TOTAL
ON TABLE PCHOLD AS THRID_SLIDE FORMAT PPTX TEMPLATE 'SLIDE_1.pptx' SLIDENUMBER 4
ON TABLE SET STYLE *
TYPE=REPORT,
  OBJECT=STATUS-AREA,
  JUSTIFY=LEFT,
  PAGE-LOCATION=BOTTOM,
$
TYPE=REPORT,
  GRID=OFF,
  FONT='ARIAL',
  SIZE=14,
  STYLE=NORMAL,
  SQUEEZE=ON,
  TOPGAP=0.05,
  BOTTOMGAP=0.05,
  BORDER-COLOR=RGB(219 219 219),
  TITLELINE=SKIP,
  ORIENTATION = LANDSCAPE,
  TOPMARGIN=.1,
  LEFTMARGIN=1.5,
$
TYPE=TITLE,
  COLOR=RGB(51 51 51),
  STYLE=-UNDERLINE +BOLD,
$
TYPE=DATA,
  BORDER-TOP=LIGHT,
  BORDER-TOP-COLOR=RGB(219 219 219),
$
TYPE=HEADING,
  JUSTIFY=LEFT,
  SIZE=16,
$
TYPE=DATA,
  COLUMN=DOLLARS,
  COLOR=BLUE,
$
TYPE=REPORT,
  COLUMN=REGION,
  COLOR=RED,
$
TYPE=REPORT,
  COLUMN=CATEGORY,
  COLOR=GREEN,
$
TYPE=GRANDTOTAL,
  COLOR=RGB(51 51 51),
  STYLE=BOLD,
  BORDER-TOP=LIGHT,
  BORDER-TOP-COLOR=RGB(102 102 102),
$
END
The output is:

PowerPoint PPTX Compound Syntax
PowerPoint Compound Documents generate presentations that may contain multiple slides. The components of a PowerPoint Compound Document can include standard tables and charts.
Example: Generating a Compound Document
The following request creates a slide deck, which presents the selected information in standard tables and charts.
SET HTMLARCHIVE=ON
COMPOUND LAYOUT PCHOLD FORMAT PPTX
UNITS=IN, $
SECTION=section1, LAYOUT=ON, MERGE=OFF,
ORIENTATION=LANDSCAPE, PAGESIZE=PPT Slide, SHOW_GLOBALFILTER=OFF, $
PAGELAYOUT=1, NAME='Page layout 1', text='Page layout 1',
BOTTOMMARGIN=0.2, TOPMARGIN=0.5, LEFTMARGIN=2.0, $
COMPONENT='chart1', TEXT='chart1', POSITION=(0.707 0.520),
DIMENSION=(8.750 2.917), COMPONENT-TYPE=GRAPH, $
COMPONENT='report1', TEXT='report1', POSITION=(0.500 3.542),
DIMENSION=(9.271 3.646), $
END
SET COMPONENT='chart1'
ENGINE INT CACHE SET ON
-DEFAULTH &WF_STYLE_UNITS='PIXELS';
-DEFAULTH &WF_STYLE_HEIGHT='405.0';
-DEFAULTH &WF_STYLE_WIDTH='770.0';
-DEFAULTH &WF_TITLE='WebFOCUS Report';
GRAPH FILE ibisamp/ggsales
SUM GGSALES.SALES01.DOLLARS
BY GGSALES.SALES01.REGION
BY TOTAL HIGHEST GGSALES.SALES01.DOLLARS NOPRINT
BY GGSALES.SALES01.ST
ON GRAPH PCHOLD FORMAT PPTX
ON GRAPH SET HTMLENCODE ON
ON GRAPH SET GRAPHDEFAULT OFF
ON GRAPH SET ARGRAPHENGIN JSCHART
ON GRAPH SET EMBEDHEADING ON
ON GRAPH SET VZERO OFF
ON GRAPH SET GRWIDTH 1
ON GRAPH SET UNITS &WF_STYLE_UNITS
ON GRAPH SET HAXIS &WF_STYLE_WIDTH
ON GRAPH SET VAXIS &WF_STYLE_HEIGHT
ON GRAPH SET GRMERGE ADVANCED
ON GRAPH SET GRMULTIGRAPH 1
ON GRAPH SET GRLEGEND 0
ON GRAPH SET GRXAXIS 2
ON GRAPH SET LOOKGRAPH VBAR
ON GRAPH SET STYLE *
*GRAPH_SCRIPT
setPieDepth(0);
setPieTilt(0);
setDepthRadius(0);
setCurveFitEquationDisplay(false);
setPlace(true);
setPieFeelerTextDisplay(1);
setUseSeriesShapes(true);
setMarkerSizeDefault(50);
*END
INCLUDE=IBFS:/FILE/IBI_HTML_DIR/javaassist/intl/EN/combine_templates/warm.sty,$
TYPE=REPORT, TITLETEXT=&WF_TITLE.QUOTEDSTRING, $
*GRAPH_SCRIPT
setReportParsingErrors(false);
setSelectionEnableMove(false);
setFillType(getSeries(0),2);
setGradientPinLeftColor0(getSeries(0),new Color(0,127,192));
setGradientPinRightColor0(getSeries(0),new Color(0,127,192));
setGradientPinLeftColor2(getSeries(0),new Color(0,127,192));
setGradientPinRightColor2(getSeries(0),new Color(0,127,192));
setGradientPinLeftColor1(getSeries(0),new Color(0,64,128));
setGradientPinRightColor1(getSeries(0),new Color(0,64,128));
setGradientPinPosition0(getSeries(0),0.0);
setGradientPinPosition1(getSeries(0),1.0);
setPieTilt(0);
setPieDepth(0);
setDepthRadius(0);
setDepthAngle(0);
setFillType(getSeries(7),2);
setGradientPinPosition0(getSeries(7),0.0);
setGradientPinPosition1(getSeries(7),1.0);
setFillType(getSeries(9),2);
setGradientDirection(getSeries(9),16);
setGradientPinPosition0(getSeries(9),0.0);
setGradientPinPosition1(getSeries(9),1.0);
*END
ENDSTYLE
END
-RUN
SET COMPONENT='report1'
TABLE FILE IBISAMP/GGSALES
SUM
  GGSALES.SALES01.BUDDOLLARS/D12CM
  GGSALES.SALES01.DOLLARS/D12CM
  GGSALES.SALES01.BUDUNITS/D12C
  GGSALES.SALES01.UNITS/D12C
BY GGSALES.SALES01.REGION
BY GGSALES.SALES01.PRODUCT
ON GGSALES.SALES01.REGION SUBTOTAL AS 'TOTAL FOR:'
ON GGSALES.SALES01.REGION PAGE-BREAK
HEADING
"Q3 SALES REPORT BY REGION"
WHERE GGSALES.SALES01.PRODUCT NE 'Coffee Pot' OR 'Mug' OR 'Thermos';
ON TABLE SET PAGE-NUM NOLEAD
ON TABLE SET ASNAMES ON
ON TABLE NOTOTAL
ON TABLE PCHOLD FORMAT PPTX
ON TABLE SET STYLE *
  PAGESIZE='PPT Slide',
  LEFTMARGIN=1.000000,
  TOPMARGIN=0.500000,
  BOTTOMMARGIN=0.000000,
  SQUEEZE=ON,
  ORIENTATION=LANDSCAPE,
$
TYPE=REPORT,
  BORDER-TOP-COLOR=RGB(219 219 219),
  BORDER-BOTTOM-COLOR=RGB(219 219 219),
  BORDER-LEFT-COLOR=RGB(219 219 219),
  BORDER-RIGHT-COLOR=RGB(219 219 219),
  FONT='ARIAL',
  SIZE=12,
    TITLELINE=SKIP,
  STYLE=NORMAL,
  TOPGAP=0.041667,
$
TYPE=DATA,
  BORDER-TOP=LIGHT,
  BORDER-TOP-COLOR=RGB(219 219 219),
$
TYPE=TITLE, COLOR=RGB(51 51 51), STYLE=-UNDERLINE+BOLD, $ TYPE=HEADING, SIZE=14, JUSTIFY=LEFT, $ TYPE=SUBTOTAL, BORDER-TOP=LIGHT, BORDER-TOP-COLOR=RGB(219 219 219), STYLE=BOLD, $ TYPE=REPORT, OBJECT=STATUS-AREA, JUSTIFY=LEFT, PAGE-LOCATION=BOTTOM, $ ENDSTYLE END COMPOUND END
The resulting Compound Document output is:

Coordinated Compound Layout Reports
A Coordinated Compound Layout report is coordinated so that all reports and graphs that contain a common sort field are burst into separate page layouts. Pages are generated for each value of the common sort field, with every component displaying the data it retrieved for that value on that page. You create a Coordinated Compound Layout report by specifying MERGE=ON in the SECTION declaration for the Compound Layout report.
In a Coordinated Compound Layout report, if at least one component contains data for a specific sort field value, a page is generated for that value even though some of the components may be missing.
While the length of the report will always include all of the rows of data generated by the query, the width of the report is limited by the size of the defined component container. This means that paneling is not supported for Compound Reports, although it is for non-Compound PPTX Reports.
If the width of the report data is wider than the defined page size, a panel (or horizontal overflow page) is automatically generated.
In legacy compound syntax, if one of the component reports is too large to fit within the defined page width, execution is halted and the user is presented with an error message stating that paneling is not supported.
In Compound Layout syntax, if a component is too wide to fit within the defined container, the report wraps the contents within the container. The container size is defined through a combination of the POSITION and DIMENSIONS parameters for the component within the compound syntax.
Example: Generating a Coordinated Compound Layout Report
The following request generates a Coordinated Compound Layout report. This Compound Report is coordinated by Region, so that individual slides are generated for each value of the primary Key, Region.
SET HTMLARCHIVE=ON
*-HOLD_SOURCE
COMPOUND LAYOUT PCHOLD FORMAT PPTX
UNITS=IN, $
SECTION=section1, LAYOUT=ON, MERGE=ON, ORIENTATION=LANDSCAPE,
PAGESIZE=PPT Slide, SHOW_GLOBALFILTER=OFF,$
PAGELAYOUT=1, NAME='Page layout 1', text='Page layout 1', BOTTOMMARGIN=0.5,
TOPMARGIN=0.5, $
COMPONENT='report1', TEXT='report1', POSITION=(0.500 0.625),
DIMENSION=(* *), $
COMPONENT='report2', TEXT='report2', POSITION=(0.712 0.771),
DIMENSION=(* *), $
COMPONENT='report3', TEXT='report3', POSITION=(5.702 0.759),
DIMENSION=(* *), $
END
SET COMPONENT='report1'
TABLE FILE WF_RETAIL
BY WF_RETAIL.WF_RETAIL_GEOGRAPHY_CUSTOMER.BUSINESS_REGION NOPRINT
HEADING
"PROFIT REPORTS FOR <WF_RETAIL.WF_RETAIL_GEOGRAPHY_CUSTOMER.BUSINESS_REGION
<+15>
DISCOUNTS APPLIED: <WF_RETAIL.WF_RETAIL_GEOGRAPHY_CUSTOMER.BUSINESS_REGION"
" "
ON TABLE SET ASNAMES ON
ON TABLE NOTOTAL
ON TABLE PCHOLD FORMAT PPTX
ON TABLE SET STYLE *
TYPE=REPORT,
  GRID=OFF,
  FONT='ARIAL',
  SIZE=9,
  STYLE=NORMAL,
  SQUEEZE=ON,
  TOPGAP=0.05,
  BOTTOMGAP=0.05,
  PAGECOLOR='WHITE',
  BORDER-COLOR=RGB(219 219 219),
  TITLELINE=SKIP,
    TOPMARGIN=.5,
    LEFTMARGIN=.15,
$
TYPE=HEADING,
  JUSTIFY=LEFT,
  SIZE=14,
$
ENDSTYLE
END
SET COMPONENT='report2'
TABLE FILE WF_RETAIL
SUM
WF_RETAIL.WF_RETAIL_SALES.COGS_US
WF_RETAIL.WF_RETAIL_SALES.GROSS_PROFIT_US
BY WF_RETAIL.WF_RETAIL_GEOGRAPHY_CUSTOMER.BUSINESS_REGION NOPRINT
BY WF_RETAIL.WF_RETAIL_PRODUCT.PRODUCT_CATEGORY
ON WF_RETAIL.WF_RETAIL_GEOGRAPHY_CUSTOMER.BUSINESS_REGION SUBTOTAL AS 'TOTAL FOR'
ON TABLE SET ASNAMES ON
ON TABLE NOTOTAL
ON TABLE PCHOLD FORMAT PPTX
ON TABLE SET STYLE *
PAGESIZE='PPT Slide',
  ORIENTATION=LANDSCAPE,
$
TYPE=REPORT,
  OBJECT=STATUS-AREA,
  JUSTIFY=LEFT,
  PAGE-LOCATION=BOTTOM,
$
TYPE=REPORT,
GRID=OFF,
FONT='ARIAL',
SIZE=14,
STYLE=NORMAL,
SQUEEZE=ON,
TOPGAP=0.05,
BOTTOMGAP=0.05,
PAGECOLOR='WHITE',
BORDER-COLOR=RGB(219 219 219),
TITLELINE=SKIP,
TOPMARGIN=.5,
LEFTMARGIN=.15,
$
TYPE=DATA,
BORDER-TOP=LIGHT,
BORDER-TOP-COLOR=RGB(219 219 219),
$
TYPE=TITLE,
COLOR=RGB(51 51 51),
STYLE=-UNDERLINE +BOLD,
$
TYPE=DATA,
COLUMN=ROWTOTAL(*),
STYLE=BOLD,
$
TYPE=TITLE,
COLUMN=ROWTOTAL(*),
COLOR=RGB(51 51 51),
STYLE=-UNDERLINE +BOLD,
$
TYPE=SUBTOTAL,
STYLE=BOLD,
BORDER-TOP=LIGHT,
BORDER-TOP-COLOR=RGB(219 219 219),
$
ENDSTYLE
END
SET COMPONENT='report3'
TABLE FILE WF_RETAIL
SUM
WF_RETAIL.WF_RETAIL_SALES.DISCOUNT_US
BY WF_RETAIL.WF_RETAIL_GEOGRAPHY_CUSTOMER.BUSINESS_REGION NOPRINT
BY WF_RETAIL.WF_RETAIL_PRODUCT.PRODUCT_CATEGORY
ON WF_RETAIL.WF_RETAIL_GEOGRAPHY_CUSTOMER.BUSINESS_REGION SUBTOTAL
AS 'TOTAL FOR'ON TABLE SET ASNAMES ON ON TABLE NOTOTAL ON TABLE PCHOLD FORMAT PPTX ON TABLE SET STYLE * PAGESIZE='PPT Slide', ORIENTATION=LANDSCAPE, $ TYPE=REPORT, OBJECT=STATUS-AREA, JUSTIFY=LEFT, PAGE-LOCATION=BOTTOM, $ TYPE=REPORT, GRID=OFF, FONT='ARIAL', SIZE=14, STYLE=NORMAL, SQUEEZE=ON, TOPGAP=0.05, BOTTOMGAP=0.05, PAGECOLOR='WHITE', BORDER-COLOR=RGB(219 219 219), TITLELINE=SKIP, $ TYPE=DATA, BORDER-TOP=LIGHT, BORDER-TOP-COLOR=RGB(219 219 219), $ TYPE=TITLE, COLOR=RGB(51 51 51), STYLE=-UNDERLINE +BOLD, $ TYPE=DATA, COLUMN=ROWTOTAL(*), STYLE=BOLD, $
TYPE=TITLE,
  COLUMN=ROWTOTAL(*),
  COLOR=RGB(51 51 51),
  STYLE=-UNDERLINE +BOLD,
$
TYPE=SUBTOTAL,
  STYLE=BOLD,
  BORDER-TOP=LIGHT,
  BORDER-TOP-COLOR=RGB(219 219 219),
$
ENDSTYLE
END
COMPOUND END
The output is:

Templates for Compound Reports
For Compound Reports, the template is defined in the first component report. For compound reports with Page Masters, this table will be the default table used to substantiate the page layout. For uncoordinated standard compound reports, this default component can be created using the system table, as shown in the following request.
SET COMPONENT='ppt_template'
TABLE FILE SYSCOLUM
SUM TBNAME NOPRINT
IF READLIMIT EQ 1
ON TABLE PCHOLD FORMAT PPTX TEMPLATE 'template_plus.potx' SLIDENUMBER 1
END
For Coordinated Compound Reports, this table must contain the same primary key as the other components in the report. This includes any preprocessing of the data to define the universe of available primary key values including JOINS and DEFINES.
SET COMPONENT='ppt_template'
TABLE FILE GGSALES
BY REGION NOPRINT
IF READLIMIT EQ 1
ON TABLE PCHOLD FORMAT PPTX TEMPLATE 'template_plus.potx' SLIDENUMBER 1
END
Adding Images to a Compound Request
Images may be inserted on the Page Master, Page Layout, and PowerPoint template (POTX) to enhance the Compound Document. Images inserted on the Page Master will be visible on every Page Layout within the Compound Document. Images on a Page Layout will be displayed only on that page. If the Document is to be displayed on a PowerPoint Template, images may be saved on the Template so that they will be displayed as positioned on the individual slides.
Important: Compound Layout syntax cannot contain hidden carriage return or line feed characters. For purposes of presenting this example, line feed characters have been added so that the sample code wraps to fit within the printed page. To run this example in your environment, copy the code into a text editor and delete any line feed characters within the Compound Layout syntax by going to the end of each line and pressing the Delete key.
Example: Adding Images to a Compound Request
The following compound syntax creates a Document with images in the Page Master, the Page Layout, and that is displayed on a PowerPoint template on which an image has been inserted.
SET HTMLARCHIVE=ON
*-HOLD_SOURCE
COMPOUND LAYOUT PCHOLD FORMAT PPTX
UNITS=IN, $
SECTION=section1, LAYOUT=ON, MERGE=OFF,
ORIENTATION=LANDSCAPE, PAGESIZE=PPT Slide, SHOW_GLOBALFILTER=OFF, $
PAGELAYOUT=ALL, NAME='Page Master', $
COMPONENT='ppt_template', $
OBJECT=BOX, NAME='line1', POSITION=(0.052 0.500), DIMENSION=(10.000 0.031),
BACKCOLOR=RGB(176 196 222), BORDER-COLOR=RGB(176 196 222), $
OBJECT=BOX, NAME='line2', POSITION=(-12.000 -10.000), DIMENSION=(0.000 0.000), BACKCOLOR=BLACK, BORDER-COLOR=BLACK, $
OBJECT=BOX, NAME='line3', POSITION=(0.479 0.000), DIMENSION=(0.025 7.600),
BACKCOLOR=RGB(176 196 222), BORDER-COLOR=RGB(176 196 222), $
OBJECT=IMAGE, NAME='image1', IMAGE=webfocus1.gif, ALT='',
POSITION=(0.601 6.700), DIMENSION=(1.248 0.436), $
PAGELAYOUT=1, NAME='Page layout 1', text='Page layout 1',
BOTTOMMARGIN=0.15, TOPMARGIN=0.5, $
COMPONENT='report1', TEXT='report1', POSITION=(1.853 1.289),
DIMENSION=(6.458 5.417), $
OBJECT=IMAGE, NAME='image2', IMAGE=analyst_logo.gif, ALT='',
POSITION=(0.499 0.509), DIMENSION=(2.081 0.477), $
END
SET COMPONENT='ppt_template'
TABLE FILE SYSCOLUM
SUM TBNAME NOPRINT
IF READLIMIT EQ 1
ON TABLE PCHOLD FORMAT PPTX TEMPLATE '_ibi_template.potx' SLIDENUMBER 2
END
SET COMPONENT='report1'
TABLE FILE IBISAMP/EMPDATA
SUM
  EMPDATA.EMPDATA.SALARY
BY LOWEST EMPDATA.EMPDATA.DEPT
BY EMPDATA.EMPDATA.LASTNAME
ON EMPDATA.EMPDATA.DEPT SUBFOOT
"Subfoot"
" "
ON EMPDATA.EMPDATA.DEPT PAGE-BREAK
ON TABLE SUBHEAD
"Report Heading "
" "
" "
HEADING
"Page Heading "
" "
FOOTING
"Page Footing"
" "
ON TABLE SUBFOOT
"Report Footing"
WHERE EMPDATA.EMPDATA.SALARY GE 40900;
ON TABLE SET PAGE-NUM NOLEAD
ON TABLE SET ASNAMES ON
ON TABLE NOTOTAL
ON TABLE PCHOLD FORMAT PPTX
ON TABLE SET STYLE *
  PAGESIZE='PPT Slide',
    ORIENTATION=LANDSCAPE,
$
TYPE=REPORT,
  OBJECT=STATUS-AREA,
  JUSTIFY=LEFT,
  PAGE-LOCATION=BOTTOM,
$
TYPE=REPORT, GRID=OFF, FONT='ARIAL', SIZE=14, STYLE=NORMAL, SQUEEZE=ON, TOPGAP=0.05, BOTTOMGAP=0.05, BORDER-COLOR=RGB(219 219 219), TITLELINE=SKIP, TOPMARGIN=.25, LEFTMARGIN=2, BOTTOMMARGIN=0.05, $ TYPE=TITLE, COLOR=RGB(51 51 51), STYLE=-UNDERLINE +BOLD, $ TYPE=DATA, BORDER-TOP=LIGHT, BORDER-TOP-COLOR=RGB(219 219 219), $ TYPE=HEADING, JUSTIFY=LEFT, SIZE=16, $ TYPE=HEADING, IMAGE=smplogo1.gif, POSITION=(+4.500000 +0.000000), $ TYPE=TABFOOTING, IMAGE=smplogo1.gif, POSITION=(+4.500000 +0.000000), $ TYPE=TABFOOTING, SIZE=10, $ TYPE=FOOTING, SIZE=10, $ TYPE=FOOTING, IMAGE=smplogo1.gif, POSITION=(+4.500000 +0.000000), $
TYPE=SUBFOOT,
  SIZE=9,
  BORDER-TOP=LIGHT,
  BORDER-TOP-COLOR=RGB(219 219 219),
$
TYPE=SUBFOOT,
  BY=1,
  IMAGE=smplogo1.gif,
  POSITION=(+4.500000 +0.000000),
$
ENDSTYLE
END
COMPOUND END
The output is:

Template Masters and Slide Layouts
|
Topics: |
|
How to: |
A Microsoft PPTX 2007 and higher template can contain one or more Slide Masters, defining a variety of different Slide Layouts.
A Slide Master is the top slide in a hierarchy of slides that stores information about the theme and Slide Layouts of a presentation, including the background, color, fonts, effects, placeholder sizes, and positioning.
You can incorporate two or more different styles or themes, such as backgrounds, color schemes, fonts, and effects, by inserting an individual Slide Master into the template for each different theme.
Note: Additional information on Microsoft PowerPoint Slide Layouts is available in an article titled What is a slide layout? on the Microsoft support site.
By default, the first Slide Layout in the first Slide Master is applied to slides on which WebFOCUS data is displayed.
With this new feature, WebFOCUS enables the developer to select any Slide Layout in any Slide Master in a PowerPoint template (POTX/POTM) or Presentation file (PPTX/PPTM). One Slide Layout may be applied to a slide or slides, displaying the output of a standard report, while one or different Slide Layouts may be applied to each Page Layout in a PPTX formatted Compound Document. The WebFOCUS generated ouput is placed on top of the styling on the selected Slide Layout.
Identifying Slide Master Attributes in PowerPoint
|
How to: |
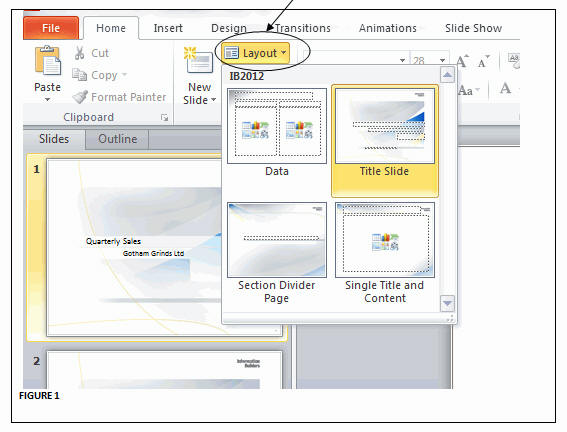
To identify Slide Masters and Slide Layouts in a template, open the file in the PowerPoint application, select the Home tab, and click the Layout button on the ribbon.
A context menu displays all Slide Layouts with labels, as shown in the following image.
To view the Slide Master, select the View tab, and in the Master Views group on the ribbon, click the Slide Master button, as shown in the following image.

The Master View opens to show the Slide Master and its associated Slide Layouts, as shown in the following image.

The following image shows the Slide Master view of the template used in this example. It contains two Slide Masters: (1) Trek and (2) Oriel. Within each Master, the image displays the layouts selected for the report generation. Notice that the Slide Master and Layout names can be identified by hovering over the slide image. Use the name without the Slide Master or Slide Layout suffixes.

Syntax: How to Identify Slide Master Attributes in PowerPoint
For single reports:
TYPE=REPORT,SLIDE-MASTER='slidemaster_name',SLIDE-LAYOUT='layout_name', $
For Compound syntax:
PAGELAYOUT=n, NAME='Page layout (n)', SLIDE-MASTER='slidemaster_name', SLIDE-LAYOUT='layout_name', $
Note: Slide Masters and Slide Layouts can be defined on the Page Master within the Section syntax or on any Page Layout.
Example: Compound Report Accessing Multiple Masters
The following syntax creates a full PPTX presentation based on a template with two Slide Masters and four individual Slide Layouts. Each of the five individual procedures (.fex) shown in this example need to be copied to a separate file.
COMPOUND LAYOUT PCHOLD FORMAT PPTX
UNITS=IN, $
SECTION=section1, LAYOUT=ON, SLIDE-MASTER='TREK',
SLIDE-LAYOUT='Title and Content',
MERGE=OFF, ORIENTATION=LANDSCAPE,
PAGESIZE=PPT Slide, SHOW_GLOBALFILTER=OFF, $
PAGELAYOUT=1, NAME='Page layout 1', SLIDE-MASTER='TREK',
SLIDE-LAYOUT='Title Slide', text='Page layout 1',
BOTTOMMARGIN=0.5, TOPMARGIN=0.5, $
COMPONENT='ppt_template', $
OBJECT=STRING, NAME='text1', TEXT='Gotham Grinds Sales Summary',
POSITION=(1.083 3.117), MARKUP=OFF, WRAP=ON, DIMENSION=(6.799 0.620),
font='TREBUCHET MS', color=RGB(0 0 0), size=36, $
OBJECT=STRING, NAME='text2', TEXT='Profit By Category',
POSITION=(1.100 3.733), MARKUP=OFF, WRAP=ON, DIMENSION=(6.833 0.500),
font='TREBUCHET MS', color=RGB(0 0 0), size=18, $
OBJECT=STRING, NAME='text3', TEXT='Prepared By:<br><br>Anne T Jones,
EVP of Sales<br>Joe F Smith, VP of Sales<br><br>&DATEtrMDYY',
POSITION=(5.683 5.433), MARKUP=ON, WRAP=ON, DIMENSION=(4.049 1.721),
font='TREBUCHET MS', color=RGB(0 0 0), size=18, $
PAGELAYOUT=2, NAME='Page layout 2', text='Page layout 2',
BOTTOMMARGIN=0.025, TOPMARGIN=4.8, $
OBJECT=STRING, NAME='pl2_text2', TEXT='Sales By Region',
POSITION=(0.5 0.325), MARKUP=ON, WRAP=ON, DIMENSION=(4.146 0.609),
font='TREBUCHET MS', color=RGB(0 0 0), style=bold, size=24, $
OBJECT=STRING, NAME='pl2_text3', TEXT=' ', POSITION=(0.5 .725), MARKUP=ON,
WRAP=ON, DIMENSION=(4.146 0.609), font='TREBUCHET MS', color=RGB(0 0 0),
style=bold, size=20, $
COMPONENT='report1', TEXT='report1', POSITION=(2.2 4.8),
DIMENSION=(* *), $
COMPONENT='chart1', TEXT='chart1', POSITION=(0.733 1.25),
DIMENSION=(8.680 3.10), COMPONENT-TYPE=GRAPH, $
PAGELAYOUT=5, NAME='Page layout 5', SLIDE-MASTER='ORIEL',
SLIDE-LAYOUT='Section Header', text='Page layout 3',
BOTTOMMARGIN=0.5, TOPMARGIN=0.5, $
OBJECT=STRING, NAME='pl3text1', TEXT='Sales Performance Regional Breakdowns', POSITION=(1.0 3.35), MARKUP=OFF, WRAP=ON,
DIMENSION=(6.799 0.620), font='TREBUCHET MS', color=RGB(0 0 0), size=24,$
COMPONENT='DfltCmpt2_3', POSITION=(0 0), DIMENSION=(0 0), $
PAGELAYOUT=6, NAME='Page layout 2', text='Page layout 4',
SLIDE-MASTER='ORIEL', SLIDE-LAYOUT='Title and Content',
BOTTOMMARGIN=0.025, TOPMARGIN=4.8, $
OBJECT=STRING, NAME='pl4_text2', TEXT='Sales By Category',
POSITION=(0.5 0.325), MARKUP=ON, WRAP=ON, DIMENSION=(4.146 0.609),
font='TREBUCHET MS', color=RGB(0 0 0), style=bold, size=24, $
OBJECT=STRING, NAME='pl4_text3', TEXT=' ', POSITION=(0.5 .725), MARKUP=ON,
WRAP=ON, DIMENSION=(4.146 0.609), font='TREBUCHET MS', color=RGB(0 0 0),
style=bold, size=20, $
COMPONENT='report2_2', TEXT='report2', POSITION=(2.2 4.8),
DIMENSION=(* *), $
COMPONENT='chart2_2', TEXT='chart2', POSITION=(0.733 1.25),
DIMENSION=(8.680 3.10), COMPONENT-TYPE=GRAPH, $
COMPONENT='report2_3', TEXT='report3', POSITION=(0.5 .725),
DIMENSION=(3 3), $
PAGELAYOUT=9, NAME='Page layout 9', SLIDE-MASTER='TREK',
SLIDE-LAYOUT='Thank You', text='Page layout 3',
BOTTOMMARGIN=0.5, TOPMARGIN=0.5, $
COMPONENT='DfltCmpt9', POSITION=(0 0), DIMENSION=(0 0), $
END

SET COMPONENT='ppt_template'
TABLE FILE SYSCOLUM
SUM TBNAME NOPRINT
IF READLIMIT EQ 1
ON TABLE PCHOLD FORMAT PPTX TEMPLATE 'template_plus.potx' SLIDENUMBER 1
END
SET COMPONENT='report1'
-INCLUDE GG_RPT1

SET COMPONENT='chart1'
-INCLUDE GG_CHART1

SET COMPONENT='DfltCmpt2_3'
TABLE FILE SYSCOLUM
" "
SUM TBNAME NOPRINT
IF READLIMIT EQ 1
ON TABLE SET PAGE-NUM NOLEAD
ON TABLE PCHOLD FORMAT PPTX
ON TABLE SET STYLE *
END

SET COMPONENT='report2_2'
-INCLUDE GG_RPT2
SET COMPONENT='chart2_2'
-INCLUDE GG_CHART2
SET COMPONENT='report2_3'
-INCLUDE GG_RPT3

SET COMPONENT='DfltCmpt9'
TABLE FILE SYSCOLUM
" "
SUM TBNAME NOPRINT
IF READLIMIT EQ 1
ON TABLE SET PAGE-NUM NOLEAD
ON TABLE PCHOLD FORMAT PPTX
ON TABLE SET STYLE *
END

COMPOUND END
-*gg_rpt1.fex
TABLE FILE GGSALES
SUM DOLLARS/D12CM BUDDOLLARS/D12CM UNITS/D12 BUDUNITS/D12
BY REGION
ON TABLE SET PAGE-NUM NOLEAD
ON TABLE PCHOLD FORMAT PPTX
ON TABLE SET STYLE *
     INCLUDE = warm,
$
ENDSTYLE
END
-*gg_rpt2.fex
TABLE FILE GGSALES
SUM DOLLARS/D12CM BUDDOLLARS/D12CM UNITS/D12 BUDUNITS/D12
BY REGION NOPRINT
BY CATEGORY
ON REGION PAGE-BREAK
ON TABLE SET PAGE-NUM NOLEAD
ON TABLE PCHOLD FORMAT PPTX
ON TABLE SET STYLE *
INCLUDE = warm,
$
ENDSTYLE
END-*gg_chart1.fex
ENGINE INT CACHE SET ON
-DEFAULTH &WF_STYLE_UNITS='INCHES';
-DEFAULTH &WF_STYLE_HEIGHT='4.21875';
-DEFAULTH &WF_STYLE_WIDTH='8.020833';
-DEFAULTH &WF_TITLE='WebFOCUS Report';
GRAPH FILE GGSALES
SUM DOLLARS UNITS
BY REGION NOPRINT
ON GRAPH PCHOLD FORMAT PPTX
ON GRAPH SET HTMLENCODE ON
ON GRAPH SET GRAPHDEFAULT OFF
ON GRAPH SET ARGRAPHENGIN JSCHART
ON GRAPH SET VZERO OFF
ON GRAPH SET GRWIDTH 1
ON GRAPH SET UNITS &WF_STYLE_UNITS
ON GRAPH SET HAXIS &WF_STYLE_WIDTH
ON GRAPH SET VAXIS &WF_STYLE_HEIGHT
ON GRAPH SET GRMERGE ADVANCED
ON GRAPH SET GRMULTIGRAPH 0
ON GRAPH SET GRLEGEND 1
ON GRAPH SET GRXAXIS 0
ON GRAPH SET LOOKGRAPH VBAR
ON GRAPH SET STYLE *
*GRAPH_SCRIPT
setPieDepth(0);
setPieTilt(0);
setDepthRadius(0);
setCurveFitEquationDisplay(false);
setPlace(true);
*ENDINCLUDE = warm,$ TYPE=REPORT, TITLETEXT=&WF_TITLE.QUOTEDSTRING, $ *GRAPH_SCRIPT setReportParsingErrors(false); setSelectionEnableMove(false); setTransparentBorderColor(getChartBackground(),true); setTransparentFillColor(getFrameSide(),true); setTransparentBorderColor(getFrameSide(),true); setTransparentFillColor(getFrameBottom(),true); setTransparentBorderColor(getFrameBottom(),true); *GRAPH_SCRIPT -* Make the chart background, borders, etc. transparent: setTransparentFillColor(getChartBackground(),true); setFillColor(getChartBackground(),new Color(255,255,255,0)); setTransparentBorderColor(getChartBackground(),true); setTransparentFillColor(getFrameSide(),true); setTransparentBorderColor(getFrameSide(),true); setTransparentFillColor(getFrameBottom(),true); setTransparentBorderColor(getFrameBottom(),true); setPlace(true); *END ENDSTYLE END -RUN
-*gg_chart2.fex
-DEFAULTH &WF_STYLE_UNITS='INCHES';
-DEFAULTH &WF_STYLE_HEIGHT='4.21875';
-DEFAULTH &WF_STYLE_WIDTH='8.020833';
-DEFAULTH &WF_TITLE='WebFOCUS Report';
GRAPH FILE GGSALES
SUM DOLLARS UNITS
BY REGION NOPRINT
BY CATEGORY
ON GRAPH PCHOLD FORMAT PPTX
ON GRAPH SET HTMLENCODE ON
ON GRAPH SET GRAPHDEFAULT OFF
ON GRAPH SET ARGRAPHENGIN JSCHART
ON GRAPH SET VZERO OFF
ON GRAPH SET GRWIDTH 1
ON GRAPH SET UNITS &WF_STYLE_UNITS
ON GRAPH SET HAXIS &WF_STYLE_WIDTH
ON GRAPH SET VAXIS &WF_STYLE_HEIGHT
ON GRAPH SET GRMERGE ADVANCED
ON GRAPH SET GRMULTIGRAPH 1
ON GRAPH SET GRLEGEND 1
ON GRAPH SET GRXAXIS 0
ON GRAPH SET LOOKGRAPH VBAR
ON GRAPH SET STYLE *
*GRAPH_SCRIPT setPieDepth(0); setPieTilt(0); setDepthRadius(0); setCurveFitEquationDisplay(false); setPlace(true); *END INCLUDE = warm,$ TYPE=REPORT, TITLETEXT=&WF_TITLE.QUOTEDSTRING, $ *GRAPH_SCRIPT setReportParsingErrors(false); setSelectionEnableMove(false); setTransparentBorderColor(getChartBackground(),true); setTransparentFillColor(getFrameSide(),true); setTransparentBorderColor(getFrameSide(),true); setTransparentFillColor(getFrameBottom(),true); setTransparentBorderColor(getFrameBottom(),true); *GRAPH_SCRIPT -* Make the chart background, borders, etc. transparent: setTransparentFillColor(getChartBackground(),true); setFillColor(getChartBackground(),new Color(255,255,255,0)); setTransparentBorderColor(getChartBackground(),true); setTransparentFillColor(getFrameSide(),true); setTransparentBorderColor(getFrameSide(),true); setTransparentFillColor(getFrameBottom(),true); setTransparentBorderColor(getFrameBottom(),true); setPlace(true); *END ENDSTYLE END -RUN
-*gg_rpt3.fex
TABLE FILE GGSALES
BY REGION PAGE-BREAK NOPRINT
HEADING
"<REGION"
ON TABLE SET PAGE-NUM NOLEAD
ON TABLE PCHOLD FORMAT PPTX
ON TABLE SET STYLE *
     INCLUDE = warm,
$
TYPE=HEADING, SIZE=20,
$
ENDSTYLE
END
The output is:

ReportCaster Distribution and ReportCaster Bursting
ReportCaster Distribution is supported for simple reports, reports with images, PPTX Templates, Coordinated Compound Reports, and graphs. Bursting is supported for simple reports, reports with images, PPTX Templates, and Coordinated Compound Reports, but not for graphs. For more information, see the ReportCaster manual.
PPTX Limitations
The following are limitations when using PPTX output format:
- ReportCaster bursting of graphs.
- Justification of images in report elements.
In Compound syntax, the following are limitations when using PPTX output format:
- Paneled reports.
- Nested syntax.
- Multi-pane reports or reports with multiple columns.
- OPEN, CLOSE, or NOBREAK command.
Related Information
For related information on these topics, see the following WebFOCUS manuals:
- Describing Data With WebFOCUS Language
- Developing Reporting Applications
- Using Functions
- ReportCaster
| WebFOCUS | |
|
Feedback |