Customizing the SQL Server Analysis Services Environment
|
Topics: |
The Adapter for SQL Server Analysis Services provides several parameters for customizing the environment and optimizing performance. This topic provides an overview of customization options.
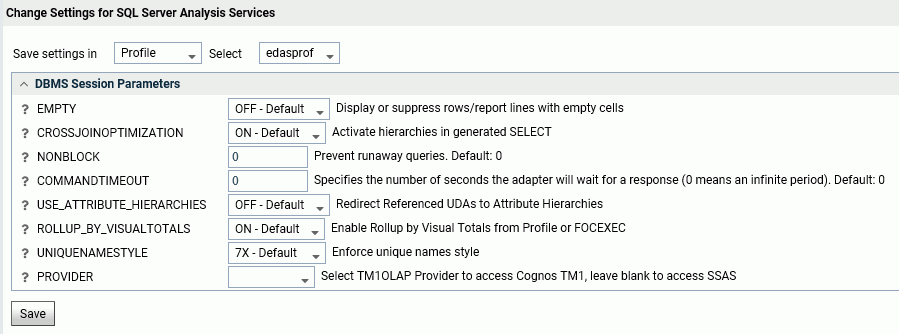
You can change these settings from the Web Console on the Adapters tab, right-clicking the name of a configured adapter, and choosing Change Settings from the menu. The Change Settings pane opens, as shown in the following image.

You can change the following parameters.
- EMPTY
-
Displays or suppresses rows, or report lines, where all the selected measure columns have empty values. OFF displays the empty values. ON suppresses empty values. OFF is the default value.
- CROSSJOINOPTIMIZATION
-
ON Optimizes queries by generating an MDX statement with CROSSJOINs of the sets of members of referenced dimensions on the ROWS axis instead of generating an MDX statement with each dimension on a separate axis. OFF suppresses CROSSJOIN optimization. This is provided for performance comparison and tuning purposes. ON is the default value.
When the EMPTY parameter is OFF (the default), this technique reduces the amount of data passed from the SQL Analysis Services client to the adapter by delegating the screening of empty tuples of data to the Analysis Services engine. The reduction is especially dramatic when low dimension levels on many dimensions are involved. (If EMPTY is ON, this option will not reduce the amount of data passed from the client to the adapter.)
- NONBLOCK
-
NONBLOCK prevents runaway queries by specifying the polling period in seconds. This enables the user to cancel the request if necessary. The default value is 0. The Adapter for SQL Server Analysis Services uses non-blocking protocol for query execution.
- COMMANDTIMEOUT
-
Specifies the number of seconds the adapter will wait for a response after it issues a request to SQL Server Analysis Services. The default value is 30. The value 0 represents an unlimited wait for a response.
Note: If you do not specify a COMMANDTIMEOUT value, the current SQL Server Analysis Services default timeout setting is used.
- USE_ATTRIBUTE_HIERARCHIES
-
Controls whether the adapter automatically interprets references to UDA fields as references to the corresponding attribute hierarchies. OFF includes fields only for those hierarchies flagged as user-defined. ON includes fields for all hierarchies. OFF is the default value.
- ROLLUP_BY_VISUALTOTALS
-
Controls whether values from the cube are recalculated so that the displayed values are determined by the report selection criteria, or are displayed as stored in the cube. ON uses the MDX VISUALTOTALS function to recalculate measure values based on the selection criteria, OFF displays the values as stored in the cube. ON is the default value.
All hierarchies within all synonyms inherit the default ROLLUP_BY_VISUALTOTALS value set in the server profile. However, in the Synonym Editor, you right-click a synonym, dimension or hierarchy to set a ROLLUP_BY_VISUALTOTALS value for:
- All hierarchies within all dimensions in a selected synonym.
- All hierarchies within selected dimensions in a selected synonym.
- Specific hierarchies within selected dimensions in a selected synonym.
- UNIQUENAMESTYLE
-
Controls the MDX unique names style for SSAS and allows users to choose the way of forming member unique names. Valid values are 7X, NAMEPATH, or KEYPATH. The default value is 7X.
- PROVIDER
-
Select TM1OLAP to access Cognos TM1 data. Leave blank otherwise.
Enabling Automatic Recognition of Date Patterns
The following SET command controls whether the adapter scans dimension members and automatically recognizes date and time patterns in the data. Recognized date/time patterns are described with USAGE formats and DATEPATTERN values for the corresponding fields in the generated synonym. The syntax is:
ENGINE SSAS SET DATEPATTERN_SCAN {ALL|DT|OFF}where:
- ALL
-
Specifies scanning data for all of the cube hierarchy levels.
- DT
-
Specifies scanning for attributes with date- or time-related types (assigned using SQL Server Data Tools).
- OFF
-
Specifies no scanning. This is the default behavior compatible with prior releases of the adapter.
Adapter Functionality
The Adapter for SQL Server Analysis Services (SSAS) supports:
- JOIN commands. The Adapter for SQL Server Analysis Services (SSAS) supports direct JOINs from or to a cube.
- SUM and PRINT commands with Measures dimensions. When using these commands in a request, the verb used against the Adapter for SQL Server Analysis Services (SSAS) does not affect the output, which is always the value found in the cube.
Example: Using SUM and PRINT Commands in a Report Request
In the following request, the PRINT verb is used, and SUM is the aggregator for Store_Cost. However, the value displayed is always the value stored in the cube or the specified measure at the intersection of the dimension values, regardless of the verb used in the request.
TABLE FILE sales_mixed_case
PRINT Store_Cost
BY City
END
The correct request produces the same report output:
TABLE FILE sales_mixed_case
SUM Store_Cost
BY City
END
The partial output is:
City          Store Cost
----          ----------
Albany        5,593.28
Altadena      2,239.71
Anacortes     641.93
Arcadia       2,045.73
Ballard       2,169.51
| WebFOCUS | |
|
Feedback |