Managing Metadata for Excel (via Direct Retrieval)
|
Topics: |
When the server accesses a data source, it needs to know how to interpret the data stored there. For each data source the server will access, you create a synonym that describes the structure of the data source and the server mapping of the data types.
Creating Synonyms
|
How to: |
Synonyms define unique names (or aliases) for each Excel worksheet that is accessible from the server. Synonyms are useful because they hide the underlying data source location and identity from client applications. They also provide support for extended metadata features of the server, such as virtual fields and additional security mechanisms.
Using synonyms allows an object to be moved or renamed while allowing client applications to continue functioning without modification. The only modification required is a redefinition of the synonym on the server. The result of creating a synonym is a Master File that represents the server metadata.
Note that certain settings can affect synonym creation. For more information on the adapter settings, see Changing Adapter Settings.
Procedure: How to Create a Synonym
To create a synonym, you must have previously configured the adapter. You can create a synonym from the Applications or Adapters pages of the Web Console.
- From the Web Console sidebar, click Connect to Data.
The Adapters page opens.
- Right-click a connection and click Show Files.
A file picker dialog box opens.
- Navigate to the application and Excel file for which you want to create the synonym and Click OK.
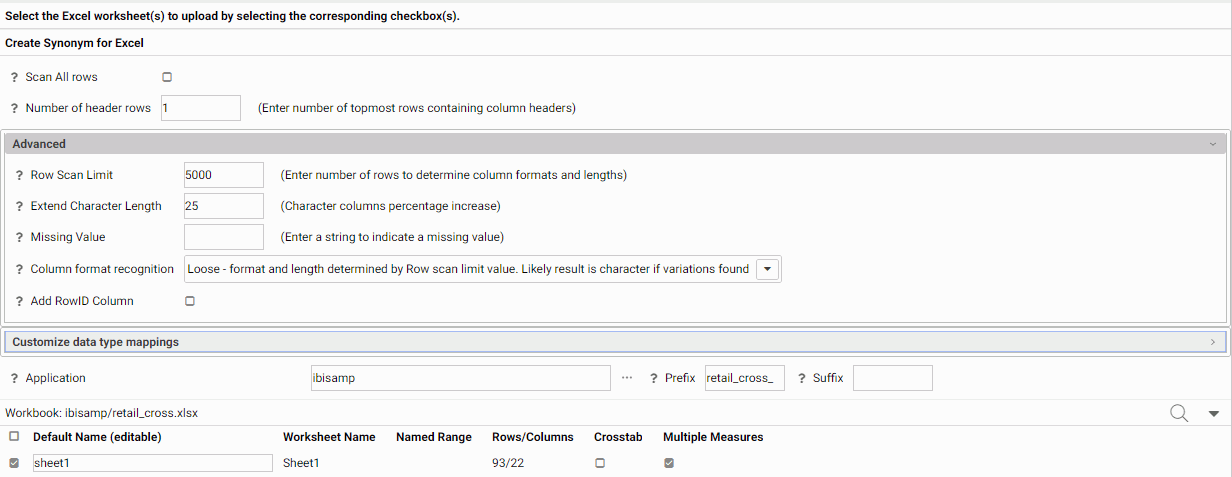
The Select Excel Worksheets page opens, as shown in the following image.

- Enter or select values for the following parameters.
- Scan All Rows
-
If checked, scans all rows to determine data types and lengths.
- Row Scan Limit
-
Specifies the maximum number of rows to scan to determine data types and lengths. The default value is 5000.
- Extend Character Length
-
Is a percentage to add to the characters lengths to compensate for a partial scan. The default value is 25.
- Missing Value
-
Enter a string to indicate a missing value.
- Column format recognition
-
Can be Loose, to use the row scan limit to determine types and lengths, or Strict, to determine data type using the first row and the lengths using the row scan limit. The default value is Loose.
- Number of header rows
-
Enter the number of header rows containing column names. The default value is 1.
- Add RowID Column
-
If checked, adds a row number for each spreadsheet row.
- Customize data type mappings
-
If expanded, opens additional fields for decomposing date fields, adding geographic roles, and selecting the data type for numeric fields and for alphanumeric fields.
- Application
-
Enter an application name or click the ellipsis (...) to navigate to the application for the synonym.
- Prefix
-
Assign a prefix to the synonym names.
- Suffix
-
Assign a suffix to the synonym names.
- Workbook
-
Select the workbooks for which synonyms are to be created. You can change the synonym name by selecting the default name and typing a new name.
- Crosstab
-
When selected, the header rows, up to the number specified, are un-pivoted to become data values.
- Multiple Measures
-
Check Multiple Measures if there is more than one numeric value for the titles in the last header row.
- Click the Create Base Synonyms button on the ribbon.
Example: Creating a Crosstabbed Synonym
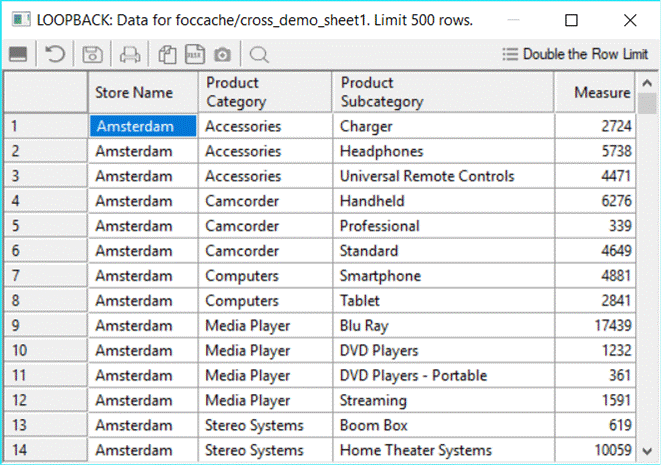
The following shows a partial Excel Spreadsheet open in the Data Management Console. The headers include Product Category, a value for Product Category, Product Subcategory, and a value for Product Subcategory.

With Crosstab not checked, the resulting Master File has a field for column on the Spreadsheet. The following is a partial list of fields for the Spreadsheet:
FIELDNAME=PRODUCT_CATEGORY_ACCESSORIES_PRODUCT_SUBCATEGORY, ALIAS='Product,Category_Accessories_Product,Subcategory', USAGE=A8V, ACTUAL=A8V,
      MISSING=ON,
      TITLE='Product,Category_Accessories_Product,Subcategory', $
    FIELDNAME=FIELD_3, ALIAS=FIELD_3, USAGE=A12V, ACTUAL=A12V,
      MISSING=ON,
      TITLE='FIELD_3', $
    FIELDNAME=FIELD_4, ALIAS=FIELD_4, USAGE=A31V, ACTUAL=A31V,
      MISSING=ON,
      TITLE='FIELD_4', $
    FIELDNAME=CAMCORDER, ALIAS=Camcorder, USAGE=A10V, ACTUAL=A10V,
      MISSING=ON,
      TITLE='Camcorder', $
    FIELDNAME=FIELD_6, ALIAS=FIELD_6, USAGE=A15V, ACTUAL=A15V,
      MISSING=ON,
      TITLE='FIELD_6', $
    FIELDNAME=FIELD_7, ALIAS=FIELD_7, USAGE=A10V, ACTUAL=A10V,
      MISSING=ON,
      TITLE='FIELD_7', $
    FIELDNAME=COMPUTERS, ALIAS=Computers, USAGE=A12V, ACTUAL=A12V,
      MISSING=ON,
      TITLE='Computers', $
    FIELDNAME=FIELD_9, ALIAS=FIELD_9, USAGE=A7V, ACTUAL=A7V,
      MISSING=ON,
      TITLE='FIELD_9', $
    FIELDNAME=MEDIA_PLAYER, ALIAS='Media Player', USAGE=A8V, ACTUAL=A8V,
      MISSING=ON,
      TITLE='Media Player', $
With Crosstab checked, multiple measures unchecked, and five header rows specified, PRODUCT_CATEGORY becomes one dimension field, PRODUCT_SUBCATEGORY becomes a second dimension field, and the numeric values in the Spreadsheet become a measure field. The first column (containing store names) becomes an alphanumeric field. For example:

The resulting Master File follows:
FILENAME=RETAIL_CROSS_CROSS_ON, SUFFIX=DIREXCEL,
 DATASET=ibisamp/retail_cross.xlsx, BV_NAMESPACE=OFF, $
  SEGMENT=RETAIL_CROSS_CROSS_ON, SEGTYPE=S0, $
    FIELDNAME=DHL1, ALIAS=DHL1, USAGE=A20V, ACTUAL=A20V,
      MISSING=ON,
      TITLE='DHL1', $
    FIELDNAME=DVL1_PRODUCT_CATEGORY, ALIAS='Product,Category',
      USAGE=A20V, ACTUAL=A20V,
      MISSING=ON,
      TITLE='Product,Category', $
    FIELDNAME=DVL2_PRODUCT_SUBCATEGORY, ALIAS='Product,Subcategory',
      USAGE=A31V, ACTUAL=A31V,
      MISSING=ON,
      TITLE='Product,Subcategory', $
    FIELDNAME=REPORT_RETAIL_WF_RETAIL_LITE_RPT_FEX,
      ALIAS='Report retail/wf_retail_lite_rpt.fex',
      USAGE=I9, ACTUAL=A11V,
      MISSING=ON,
      TITLE='Report retail/wf_retail_lite_rpt.fex', $
  FOLDER=MG_RETAIL_CROSS_CROSS_ON, PARENT=.,
    DV_ROLE=MEASURE,
    DESCRIPTION='Measure Groups', $
  FOLDER=RETAIL_CROSS_CROSS_ON, PARENT=MG_RETAIL_CROSS_CROSS_ON,
    DESCRIPTION='Retail_cross_cross_on', $
    FIELDNAME=REPORT_RETAIL_WF_RETAIL_LITE_RPT_FEX,
      BELONGS_TO_SEGMENT=RETAIL_CROSS_CROSS_ON, $
  FOLDER=DIM_RETAIL_CROSS_CROSS_ON, PARENT=.,
    DV_ROLE=DIMENSION,
    DESCRIPTION='Dimensions', $
  FOLDER=RETAIL_CROSS_CROSS_ON1, PARENT=DIM_RETAIL_CROSS_CROSS_ON,
    DESCRIPTION='Retail_cross_cross_on', $
    FIELDNAME=DHL1, BELONGS_TO_SEGMENT=RETAIL_CROSS_CROSS_ON, $
  FOLDER=DVL, PARENT=RETAIL_CROSS_CROSS_ON1,
    DESCRIPTION='DVL', $
    FIELDNAME=DVL1_PRODUCT_CATEGORY,
      BELONGS_TO_SEGMENT=RETAIL_CROSS_CROSS_ON,
      DV_ROLE=LEVEL,  $
    FIELDNAME=DVL2_PRODUCT_SUBCATEGORY,
      BELONGS_TO_SEGMENT=RETAIL_CROSS_CROSS_ON,
      DV_ROLE=LEVEL,  $
You can now issue a request similar to the following:
TABLE FILE RETAIL_CROSS_CROSS_ON
PRINT REPORT_RETAIL_WF_RETAIL_LITE_RPT_FEX AS Measure
BY DHL1 AS Store
BY DVL1_PRODUCT_CATEGORY AS Category
BY DVL2_PRODUCT_SUBCATEGORY AS Subcategory
ON TABLE SET PAGE NOLEAD
ON TABLE SET STYLE *
GRID=OFF,$
ENDSTYLE
END
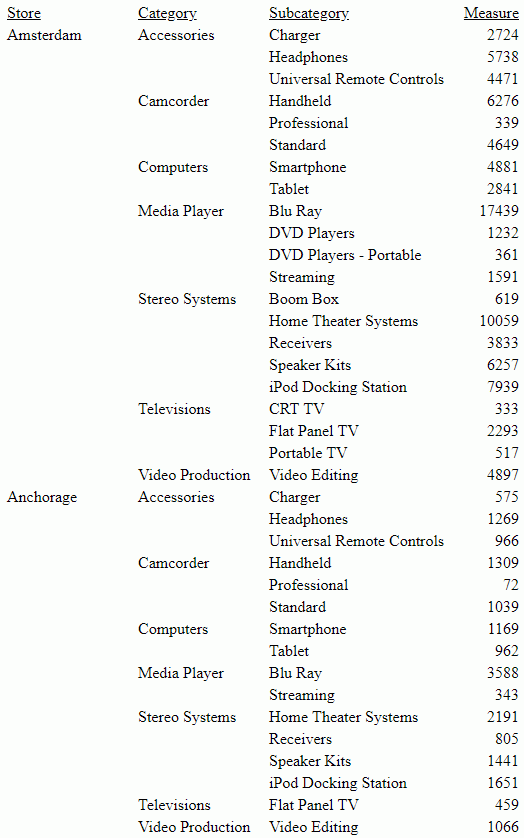
Partial output is shown in the following image.

| WebFOCUS | |
|
Feedback |