Waterfall Chart Properties (waterfallProperties)
Waterfall charts graphically illustrate the cumulative effect of sequentially introducing positive or negative values to an initial value. The initial and final (or total) values are represented by whole columns drawn from the ordinal axis baseline. Intermediate positive and negative values are drawn as floating columns.
These properties control the general layout of a waterfall chart.
The following code segment shows the default settings:
"waterfallProperties":
{
   "appendTotalRiser": true,
   "totalLabel: "Total",
   "positiveRiserColor": "#77b39a",
   "negativeRiserColor": "#e2675b",
   "zeroRiserColor": "#7593bd",
   "totalRiserColor: "#7593bd",
   "otherRiserColor": "#aaaaaa",
   "subtotalRisers": [],
   "otherRisers": [],
   "subtotalFormat":
   {
      "bold": undefined,
      "color": undefined,
      "numberFormat": undefined,
      "dataLabelPosition": undefined,
      "dividerLine":
        {
         "width": 0,
         "color": "black",
         "dash": ""
         }
    },
  "firstLastFormat":
  {
    "color": undefined,
    "border":
     {
      "width": 0,
      "color": undefined,
      "dash": ""
     }
  },
   "connectorLine":
     {
      "width": 1,
      "color": "black",
      "dash": ""
      }
},
Appending a Total Riser in a Waterfall Chart
|
How to: |
This property generates a total riser as the last riser in a waterfall chart.
Syntax: How to Append a Total Riser in a Waterfall Chart
"waterfallProperties": {
   "appendTotalRiser": boolean   },
where:
- "appendTotalRiser": boolean
-
Valid values are:
- true, which draws a total riser. This is the default value.
- false, which does not draw a total riser.
Example: Appending a Total Riser in a Waterfall Chart
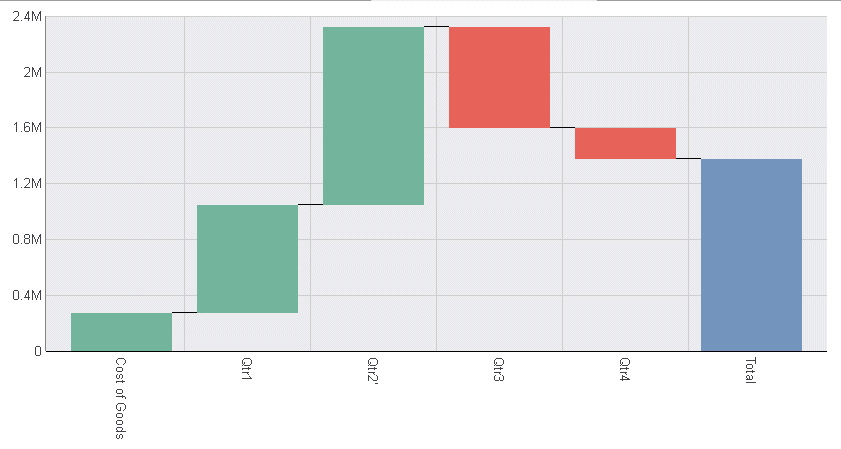
The following request generates a waterfall chart with a total riser (the default):
DEFINE FILE WF_RETAIL_LITE
INCR1 = COGS_US + 500;
INCR2 = COGS_US +1000;
DECR1 = (COGS_US - 1000);
DECR2 = (COGS_US -500);
END
GRAPH FILE WF_RETAIL_LITE
SUM COGS_US
INCR1 AS 'Qtr1'
INCR2 AS 'Qtr2'
DECR1  AS 'Qtr3'
DECR2 AS 'Qtr4'
ON GRAPH PCHOLD FORMAT JSCHART
ON GRAPH SET LOOKGRAPH VWATERFL
ON GRAPH SET STYLE *
INCLUDE=IBFS:/FILE/IBI_HTML_DIR/javaassist/intl/EN/ENIADefault_combine.sty,$
*GRAPH_JS
"legend": {"visible": false},
"waterfallProperties": {"appendTotalRiser": true}
*END
ENDSTYLE
END
The output is:
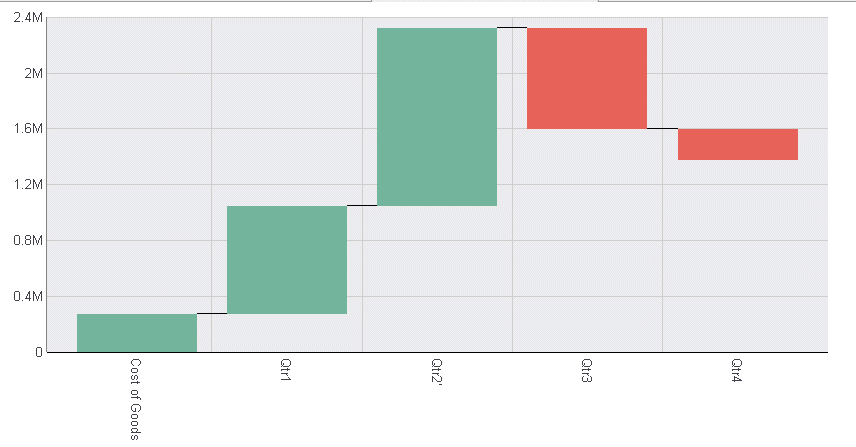
Changing appendTotalRiser to false generates the following chart:
Providing a Custom Label for the Total Riser
|
How to: |
When you generate a total riser in a waterfall chart, this property enables you to customize the label for the total riser.
Syntax: How to Customize the Total Riser Label
"waterfallProperties": {
   "appendTotalRiser": true,
   "totalLabel": "string"   },
where:
- "appendTotalRiser": true
-
Must be true in order to generate a total label. This is the default value, so this property can be omitted.
- "totalLabel": "string"
-
Is a string to use as the label for the total riser. The default label is Total.
Example: Customizing the Total Riser Label
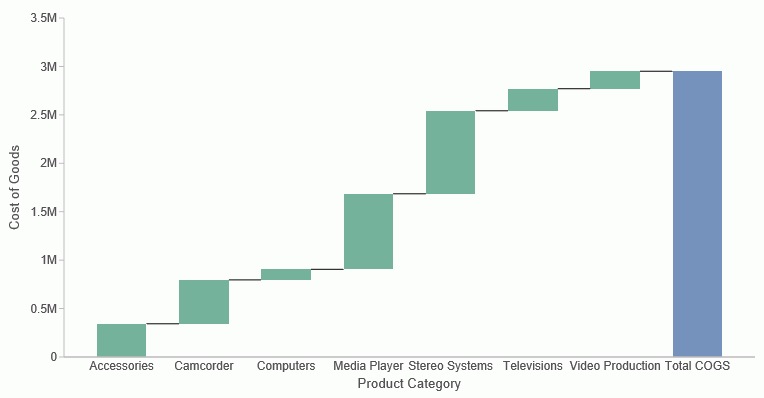
The following request generates a total riser and customizes the label on the x-axis to Total COGS.
GRAPH FILE WF_RETAIL_LITE
SUM COGS_US
BY PRODUCT_CATEGORY
ON GRAPH PCHOLD FORMAT JSCHART
ON GRAPH SET LOOKGRAPH WATERFALL
ON GRAPH SET STYLE *
INCLUDE=IBFS:/FILE/IBI_HTML_DIR/ibi_themes/Warm.sty,$
*GRAPH_JS
"waterfallProperties":
{
"appendTotalRiser": true,
"totalLabel": "Total COGS",
}
*END
ENDSTYLE
END
The output is shown in the following image.
Formatting Connector Lines in a Waterfall Chart
|
How to: |
These properties control the appearance of connector lines between risers in a waterfall chart.
Syntax: How to Format Connector Lines in a Waterfall Chart
"waterfallProperties": {
   "connectorLine": {
      "width": number,
      "color": "string",
      "dash": "string"
   }
   },
where:
- "width": number
-
Is the width of the connector line in pixels. The default value is 1.
- "color": "string"
-
Is a color name or numeric specification string. The default value is "black".
- "dash": "string"
-
Is a string that defines the dash style of the connector lines. The default value is "", which produces a solid line. Use a string of numbers that specifies the width of a dash followed by the width of the gap between dashes (for example, dash: "1 1" draws a dotted line).
Example: Formatting Waterfall Chart Connector Lines
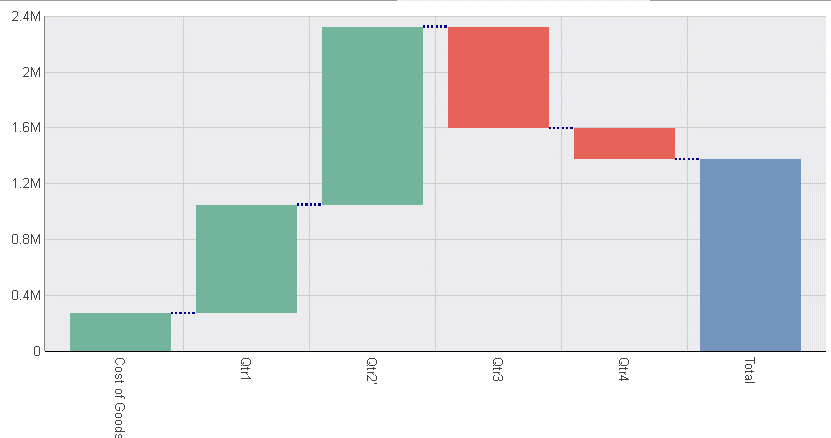
The following request generates a waterfall chart in which the connector lines are 2 pixels wide, dark blue, and dashed:
DEFINE FILE WF_RETAIL_LITE
INCR1 = COGS_US + 500;
INCR2 = COGS_US +1000;
DECR1 = (COGS_US - 1000);
DECR2 = (COGS_US -500);
END
GRAPH FILE WF_RETAIL_LITE
SUM COGS_US
INCR1 AS 'Qtr1'
INCR2 AS 'Qtr2'
DECR1  AS 'Qtr3'
DECR2 AS 'Qtr4'
ON GRAPH PCHOLD FORMAT JSCHART
ON GRAPH SET LOOKGRAPH VWATERFL
ON GRAPH SET STYLE *
INCLUDE=IBFS:/FILE/IBI_HTML_DIR/javaassist/intl/EN/ENIADefault_combine.sty,$
*GRAPH_JS
"legend": {"visible": false},
"waterfallProperties": {
	"connectorLine": {"width": 2, "color": "darkblue", "dash": "2 2"}}
*END
ENDSTYLE
END
The output is:
Controlling the Color of Negative Risers in a Waterfall Chart
|
How to: |
This property controls the color of risers that represent negative values in a waterfall chart.
Note: You can use series-specific properties to format risers individually, by specifying a color for each group under series 0.
Syntax: How to Color Negative Risers in a Waterfall Chart
"waterfallProperties": {
   "negativeRiserColor": "color"   },
where:
- "negativeRiserColor": "color"
-
Defines the negative riser color. Valid values are:
- A color string, enclosed in double quotation marks ("), that defines a color by name, numeric specification string, or gradient definition string. The default value is "#e2675b".
- A JSON object that defines a gradient.
For information about specifying colors and gradients, see Colors and Gradients.
Example: Setting the Waterfall Chart Negative Riser Color
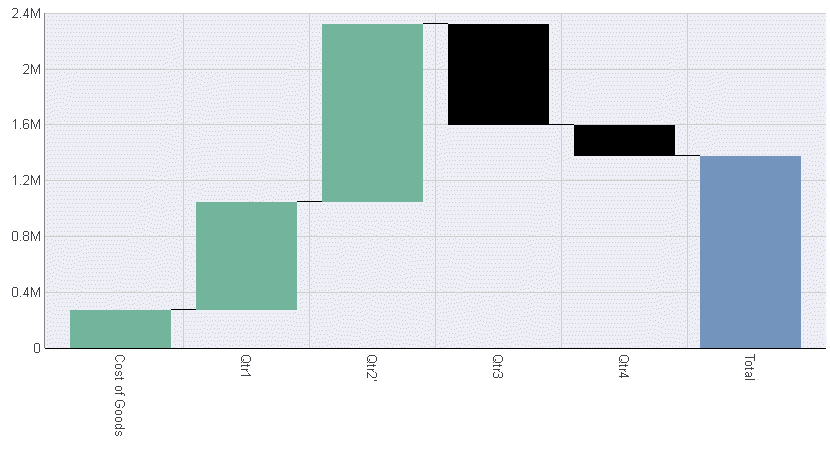
The following request generates a waterfall chart in which the risers for negative values are black:
DEFINE FILE WF_RETAIL_LITE
INCR1 = COGS_US + 500;
INCR2 = COGS_US +1000;
DECR1 = (COGS_US - 1000);
DECR2 = (COGS_US -500);
END
GRAPH FILE WF_RETAIL_LITE
SUM COGS_US
INCR1 AS 'Qtr1'
INCR2 AS 'Qtr2'
DECR1  AS 'Qtr3'
DECR2 AS 'Qtr4'
ON GRAPH PCHOLD FORMAT JSCHART
ON GRAPH SET LOOKGRAPH VWATERFL
ON GRAPH SET STYLE *
INCLUDE=IBFS:/FILE/IBI_HTML_DIR/javaassist/intl/EN/ENIADefault_combine.sty,$
*GRAPH_JS
"legend": {"visible": false},
"waterfallProperties": {"negativeRiserColor": "black"}
*END
ENDSTYLE
END
The output is:
DEFINE FILE WF_RETAIL_LITE
INCR1 = COGS_US + 500;
INCR2 = COGS_US +1000;
DECR1 = (COGS_US - 1000);
DECR2 = (COGS_US -500);
END
GRAPH FILE WF_RETAIL_LITE
SUM COGS_US
INCR1 AS 'Qtr1'
INCR2 AS 'Qtr2'
DECR1  AS 'Qtr3'
DECR2 AS 'Qtr4'
ON GRAPH PCHOLD FORMAT JSCHART
ON GRAPH SET LOOKGRAPH VWATERFL
ON GRAPH SET STYLE *
INCLUDE=IBFS:/FILE/IBI_HTML_DIR/javaassist/intl/EN/ENIADefault_combine.sty,$
*GRAPH_JS
"legend": {"visible": false},
"series": [
	{"series": 0, "group": 0, "color": "#7593bd"},
	{"series": 0, "group": 1, "color": "#77b39a"},
	{"series": 0, "group": 2, "color": "#77b39a"},
	{"series": 0, "group": 3, "color": "#7593bd"},
	{"series": 0, "group": 4, "color": "coral"},
	{"series": 0, "group": 5, "color": "pink"}]
*END
ENDSTYLE
END
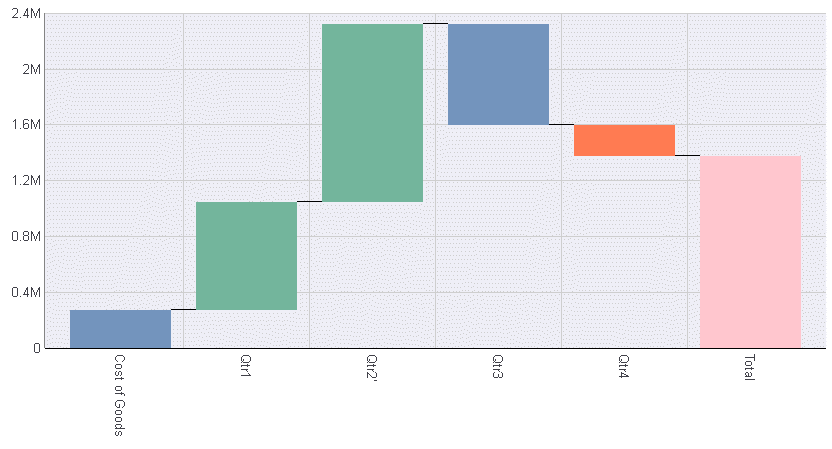
On the output, each riser has the color specified for that group:
Specifying a Waterfall Chart Other Riser Color
|
How to: |
The otherRiserColor property controls the color of risers that represent other values (if any) in a waterfall chart. Other values are defined in the otherRisers array.
Syntax: How to Specify a Waterfall Chart Other Riser Color
"waterfallProperties": {
   "otherRiserColor": "color"   },
where:
- "otherRiserColor": "color"
-
Specifies a color for the other risers . Valid values are:
- A color string, enclosed in double quotation marks ("), that defines a color by name, by a numeric specification string, or by a gradient definition string. The default value is "#aaaaaa".
- A JSON object that defines a gradient.
For information about specifying colors and gradients, see Colors and Gradients.
Example: Specifying a Waterfall Chart Other Riser Color
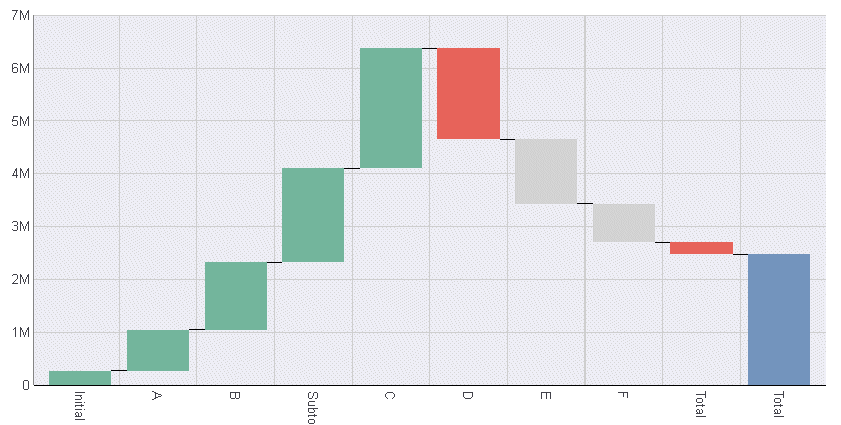
The following request generates a waterfall chart in which the other risers are colored light grey:
DEFINE FILE WF_RETAIL_LITE
INCR1 = COGS_US + 500;
INCR2 = COGS_US +1000;
INCR3 = COGS_US +1500;
INCR4 = COGS_US +2000;
DECR1 = (COGS_US - 2000);
DECR2 = (COGS_US -1500);
DECR3 = (COGS_US -1000);
DECR4 = (COGS_US -500);
END
GRAPH FILE WF_RETAIL_LITE
SUM COGS_US
INCR1 INCR2 INCR3 INCR4
DECR1 DECR2 DECR3 DECR4
ON GRAPH PCHOLD FORMAT JSCHART
ON GRAPH SET LOOKGRAPH VWATERFL
ON GRAPH SET STYLE *
INCLUDE=IBFS:/FILE/IBI_HTML_DIR/javaassist/intl/EN/ENIADefault_combine.sty,$
*GRAPH_JS
"legend": {"visible": false},
"groupLabels": ["Initial", "A", "B", "Subtotal", "C", "D", "E", "F", "Total"],
"waterfallProperties": {
	"otherRiserColor": "lightgrey", "otherRisers": ["E", "F"]}
*END
ENDSTYLE
END
The output is:
Note: You can also use series-specific properties to format risers individually. For an example, see Controlling the Color of Negative Risers in a Waterfall Chart.
Specifying Other Risers
|
How to: |
The otherRisers property defines one or more groups or values to be interpreted as other values. Risers representing these values will be assigned the color defined by the otherRiserColor property.
Syntax: How to Specify Other Risers
"waterfallProperties": {
   "otherRisers": [array]
   },
where:
- "otherRisers": [array]
-
Can be an array of:
- numbers, that specify group indices.
- strings, enclosed in double quotation marks ("), that specify group names.
Example: Specifying Other Risers
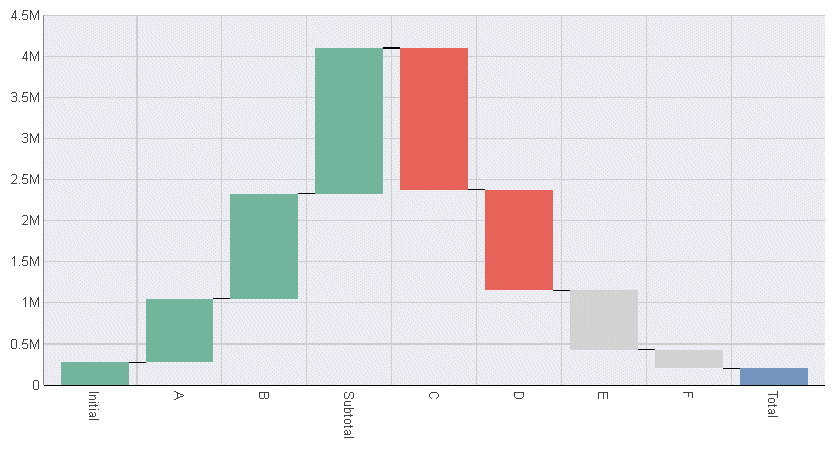
The following request generates a waterfall chart. The groupLabels object assigns group label names to each group, and the waterfallProperties otherRisers property assigns groups E and F to the other risers category:
DEFINE FILE WF_RETAIL_LITE
INCR1 = COGS_US + 500;
INCR2 = COGS_US +1000;
INCR3 = COGS_US +1500;
DECR1 = (COGS_US - 2000);
DECR2 = (COGS_US -1500);
DECR3 = (COGS_US -1000);
DECR4 = (COGS_US -500);
END
GRAPH FILE WF_RETAIL_LITE
SUM COGS_US
INCR1 INCR2 INCR3
DECR1  DECR2 DECR3 DECR4
ON GRAPH PCHOLD FORMAT JSCHART
ON GRAPH SET LOOKGRAPH VWATERFL
ON GRAPH SET STYLE *
INCLUDE=IBFS:/FILE/IBI_HTML_DIR/javaassist/intl/EN/ENIADefault_combine.sty,$
*GRAPH_JS
"legend": {"visible": false},
"groupLabels": ["Initial", "A", "B", "Subtotal", "C", "D", "E", "F", "Total"],
"waterfallProperties": {
	"otherRiserColor": "lightgrey", "otherRisers": ["E", "F"]}
*END
ENDSTYLE
END
On the chart output, the other risers are drawn in light grey, the color assigned by the otherRiserColor property:
Specifying a Waterfall Chart Positive Riser Color
|
How to: |
The positiveRiserColor property controls the color of risers that represent positive values in a waterfall chart.
Syntax: How to Color Waterfall Chart Positive Risers
"waterfallProperties": {
   "positiveRiserColor": "color"   },
where:
- "positiveRiserColor": "color"
-
Defines a color for the positive risers. Valid values are:
- A color string, enclosed in double quotation marks ("), that defines a color by name, by a numeric specification string, or by a gradient definition string. The default value is "#77b39a".
- A JSON object that defines a gradient.
For information about specifying colors and gradients, see Colors and Gradients.
Example: Specifying a Waterfall Chart Positive Riser Color
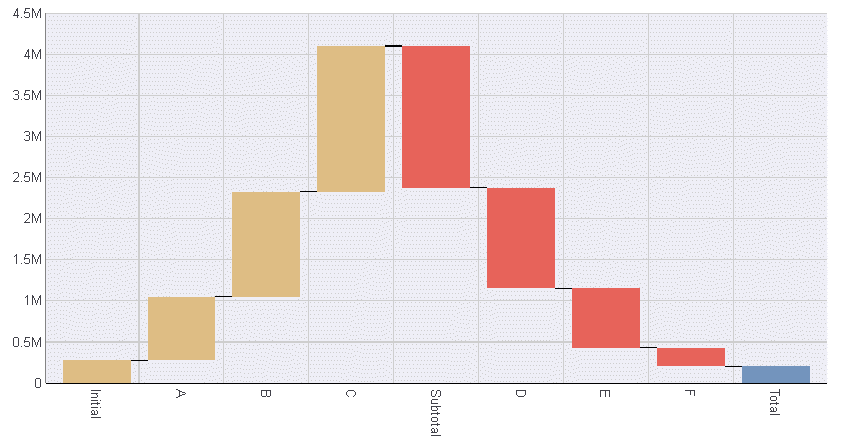
The following request generates a waterfall chart in which the risers for positive values are the color burlywood:
DEFINE FILE WF_RETAIL_LITE
INCR1 = COGS_US + 500;
INCR2 = COGS_US +1000;
INCR3 = COGS_US +1500;
DECR1 = (COGS_US - 2000);
DECR2 = (COGS_US -1500);
DECR3 = (COGS_US -1000);
DECR4 = (COGS_US -500);
END
GRAPH FILE WF_RETAIL_LITE
SUM COGS_US
INCR1 INCR2 INCR3
DECR1  DECR2 DECR3 DECR4
ON GRAPH PCHOLD FORMAT JSCHART
ON GRAPH SET LOOKGRAPH VWATERFL
ON GRAPH SET STYLE *
INCLUDE=IBFS:/FILE/IBI_HTML_DIR/javaassist/intl/EN/ENIADefault_combine.sty,$
*GRAPH_JS
"legend": {"visible": false},
"groupLabels": ["Initial", "A", "B", "C", "Subtotal", "D", "E", "F", "Total"],
"waterfallProperties": {"positiveRiserColor": "burlywood"}
*END
ENDSTYLE
END
The output is:
Note: You can also use series-specific properties to format risers individually. For an example, see Controlling the Color of Negative Risers in a Waterfall Chart.
Specifying Subtotal Values
|
How to: |
This property defines one or more groups or values to be interpreted as subtotal values.
Syntax: How to Assign Subtotal Values
"waterfallProperties": {
   "subtotalRisers": [array]
   },
where:
- "subtotalRisers": [array]
-
Can be an array of:
- numbers, that specify group indices.
- strings, enclosed in double quotation marks ("), that specify group names.
Example: Specifying Subtotal Risers
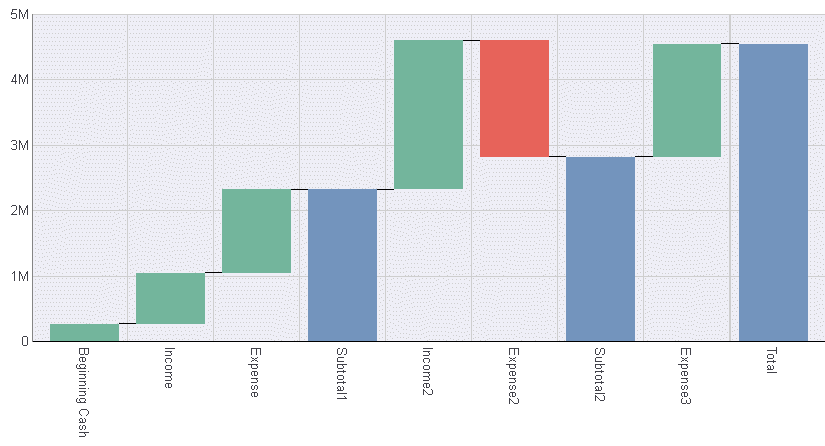
The following generates a waterfall chart with two subtotal risers. The groupLabels object assigns names to each riser, and the subtotalRisers object specifies those names in its array:
DEFINE FILE WF_RETAIL_LITE
INCR1 = COGS_US + 500;
INCR2 = COGS_US +1000;
INCR3 = COGS_US +INCR1 +INCR2;
INCR4 = COGS_US +2000;
DECR1 = -(INCR4- 500);
DECR2 = INCR3 +500;
DECR3 = -(COGS_US-2000);
END
GRAPH FILE WF_RETAIL_LITE
SUM COGS_US
INCR1 INCR2 INCR3 INCR4
DECR1 DECR2  DECR3
ON GRAPH PCHOLD FORMAT JSCHART
ON GRAPH SET LOOKGRAPH VWATERFL
ON GRAPH SET STYLE *
INCLUDE=IBFS:/FILE/IBI_HTML_DIR/javaassist/intl/EN/ENIADefault_combine.sty,$
*GRAPH_JS
"legend": {"visible": false},
"groupLabels": ["Beginning Cash", "Income", "Expense", "Subtotal1",
	"Income2", "Expense2", "Subtotal2", "Expense3", "TOTAL"],
"waterfallProperties": {"subtotalRisers": ["Subtotal1", "Subtotal2"]}
*END
ENDSTYLE
END
The output is:
Specifying the Color of Waterfall Chart Subtotal and Total Risers
|
How to: |
The zeroRiserColor property controls the color of any riser placed in the subtotal array and the riser that represents the total value in a waterfall chart.
Syntax: How to Color Waterfall Chart Initial Value, Subtotal, and Total Risers
"waterfallProperties": {
   "zeroRiserColor": "color"   },
where:
- "zeroRiserColor": "color"
-
Specifies the color for any riser placed in the subtotal array and the riser representing the total value. Valid values are:
- A color string, enclosed in double quotation marks ("), that defines a color by name, by a numeric specification string, or by a gradient definition string. The default value is "#7593bd".
- A JSON object that defines a gradient.
For information about specifying colors and gradients, see Colors and Gradients.
Example: Setting the Waterfall Chart zeroRiserColor Property
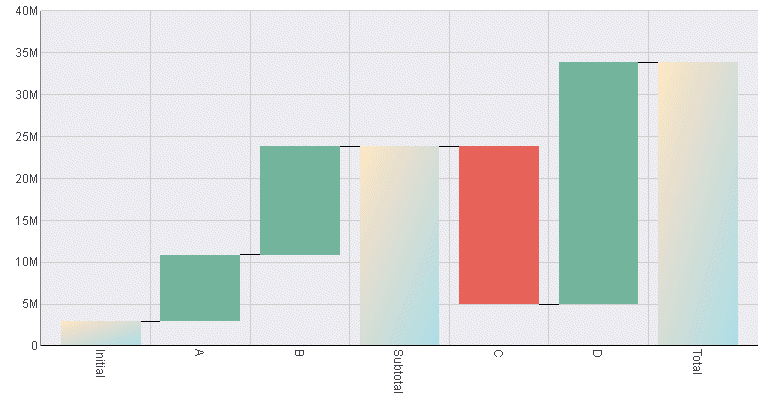
The following request generates a waterfall chart and sets the zeroRiserColor property to a linear gradient that transitions from bisque to light blue. It adds the initial value riser to the subtotal array, so the initial value riser also displays using the specified gradient:
DEFINE FILE WF_RETAIL_LITE
INCR1 = COGS_US + 500;
INCR2 = COGS_US +1000;
INCR3 = COGS_US +INCR1 +INCR2;
DECR1 = -(INCR3- 500);
DECR2 = INCR3 +500;
END
GRAPH FILE WF_RETAIL_LITE
SUM COGS_US
INCR1 INCR2 INCR3
DECR1 DECR2
ON GRAPH PCHOLD FORMAT JSCHART
ON GRAPH SET LOOKGRAPH VWATERFL
ON GRAPH SET STYLE *
INCLUDE=IBFS:/FILE/IBI_HTML_DIR/javaassist/intl/EN/ENIADefault_combine.sty,$
*GRAPH_JS
"legend": {"visible": false},
"groupLabels": ["Initial", "A", "B", "Subtotal", "C", "D", "Total"],
"waterfallProperties": {
	"subtotalRisers": ["Initial", "Subtotal"],
	"zeroRiserColor": {
		"type": "linear",
		"start": {"x": "0%", "y": "0%"},
		"end": {"x": "100%", "y": "100%"},
		"stops": [[0, "bisque"], [1, "lightblue"]]}}
*END
ENDSTYLE
END
The output is:
Note: You can also use series-specific properties to format risers individually. For an example, see Controlling the Color of Negative Risers in a Waterfall Chart.
Formatting Axis and Data Label Properties of Subtotal Risers
|
How to: |
The subtotalFormat properties enable you to customize the axis labels, data labels, and divider lines for subtotal risers.
Syntax: How to Format Axis and Data Label Properties of Subtotal Risers
"waterfallProperties":
{
  "subtotalFormat":
     {
        "bold": boolean,
        "color": "string",
        "numberFormat": format,
        "dataLabelPosition": "string",
        "dividerLine":
          {
           "width": number,
           "color": "string",
           "dash": "string"
           }
      }
}
where:
- "bold": boolean
-
Can be one of the following values.
- true, which makes the axis labels of subtotal risers bold.
- false, which does not bold the axis labels of subtotal risers.
The default value is undefined.
- "color": "string"
-
Is a color specification string for the data labels of subtotal risers. The default value is undefined.
- "numberFormat": format
-
Is a number format string or JSON object that defines the number format of data labels for subtotal risers. For information, see Introduction to JSON Properties for HTML5 Charts.
The default value is undefined.
- "dataLabelPosition": "string"
-
Is a string that defines the position of the data labels for subtotal risers. For information, see Showing and Formatting Data Text Labels.
The default value is undefined.
- "dividerLine"
-
Defines the properties of an optional divider line that can be drawn before each subtotal riser.
- "width": number
-
Is the width of the divider lines, in pixels. The default value is 0 (zero).
- "color": "string"
-
Is a color specification string for the divider lines. The default value is "black".
- "dash": "string"
-
Is a string that defines the dash style of the divider lines. The default value is "" (a solid line). Use a string of numbers that defines the width of a dash in pixels followed by the width of the gap between dashes in pixels (for example, "dash": "1 1" draws a dotted line).
Example: Formatting Axis and Data Label Properties of Subtotal Risers
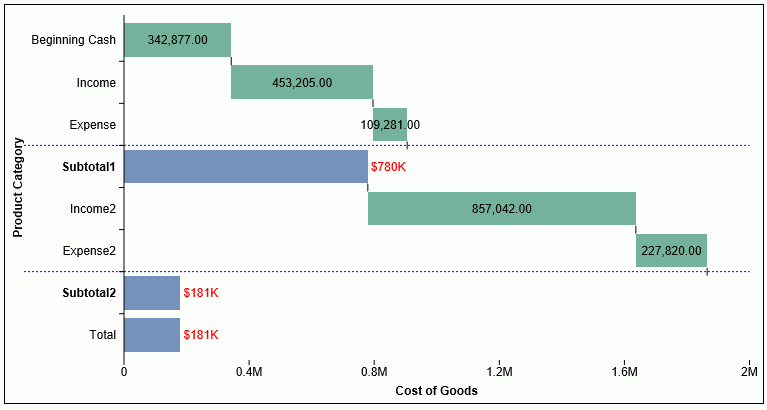
The following request makes the axis labels of subtotal risers bold, generates blue dashed divider lines, and formats the data labels to be red, to be placed above the risers, and to have a number format defined by a JSON object.
GRAPH FILE WF_RETAIL_LITE
SUM COGS_US

BY PRODUCT_CATEGORY
ON GRAPH PCHOLD FORMAT JSCHART
ON GRAPH SET LOOKGRAPH WATERFALL
ON GRAPH SET STYLE *
*GRAPH_JS
"series": [{"series":0, "dataLabels": {"visible":true}}],
"groupLabels": ["Beginning Cash", "Income", "Expense", "Subtotal1",
	"Income2", "Expense2", "Subtotal2", "Expense3", "TOTAL"],
"waterfallProperties":
{
"subtotalRisers": ["Subtotal1", "Subtotal2"],
"subtotalFormat":
   {
    "bold": true,
    "color": "red",
    "numberFormat": {"mode": "currency", "decimalPlaces": 0,
                     "grouping": "K"},
    "dataLabelPosition": "top",
    "dividerLine":
      {
       "width": 1,
       "color": "blue",
       "dash": "2 2"
       }
   }
}
*END
ENDSTYLE
END
The output is shown in the following image.
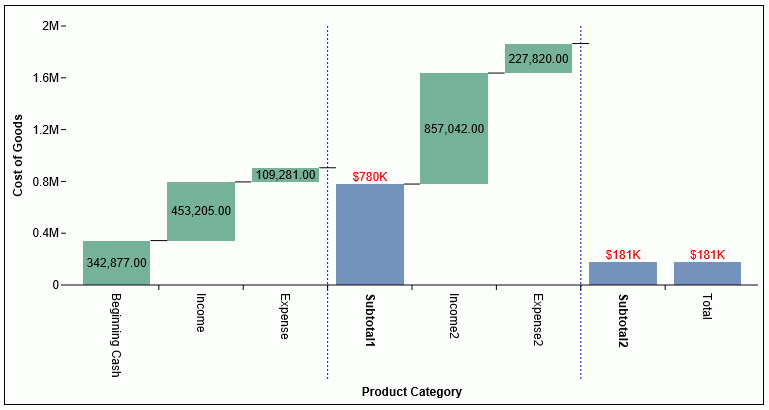
Changing the LOOKGRAPH value to HWATERFL produces the following horizontal waterfall chart output.
Formatting the First and Last Risers in a Waterfall Chart
|
How to: |
The firstLastFormat properties enable you to customize the formats of the first and last risers in a waterfall chart.
Syntax: How to Format the First and Last Risers in a Waterfall Chart
"firstLastFormat":
 {
   "color": color,
   "border":
     {
      "width": number,
      "color": "string",
      "dash": "string"
     }
 }
where:
- "color": color
-
Specifies the color for the first and last risers. The default value is undefined, which does not distinguish the first and last risers from the other risers. Valid values are:
- A color string, enclosed in double quotation marks ("), that defines a color by name, by a numeric specification string, or by a gradient definition string.
- A JSON object that defines a gradient.
For information about specifying colors and gradients, see Colors and Gradients.
- "border"
-
Defines the properties of the border of the first and last risers.
- "width": number
-
Is the width of the border line in pixels. The default value is 0.
- "color": "string"
-
Is a color name or numeric specification string. The default value is undefined.
- "dash": "string"
-
Is a string that defines the dash style of the border. The default value is "", which produces a solid line. Use a string of numbers that specifies the width of a dash followed by the width of the gap between dashes (for example, dash: "1 1" draws a dotted line).
Example: Formatting the First and Last Risers
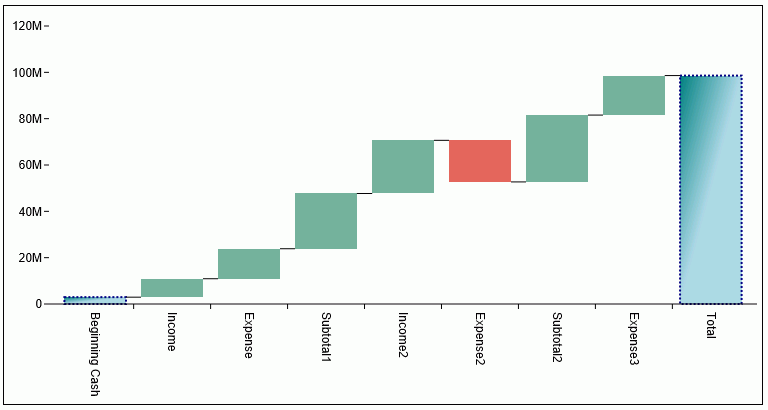
The following request formats the first and last risers have a gradient fill that transitions from teal to light blue, and to have a navy dashed border.
DEFINE FILE WF_RETAIL_LITE
INCR1 = COGS_US + 500;
INCR2 = COGS_US +1000;
INCR3 = COGS_US +INCR1 +INCR2;
INCR4 = COGS_US +2000;
DECR1 = -(INCR4- 500);
DECR2 = INCR3 +500;
DECR3 = -(COGS_US-2000);
END
GRAPH FILE WF_RETAIL_LITE
SUM COGS_US
INCR1 INCR2 INCR3 INCR4
DECR1 DECR2  DECR3
ON GRAPH PCHOLD FORMAT JSCHART
ON GRAPH SET LOOKGRAPH VWATERFL
ON GRAPH SET STYLE *
*GRAPH_JS
"legend": {"visible": false},
"groupLabels": ["Beginning Cash", "Income", "Expense", "Subtotal1",
	"Income2", "Expense2", "Subtotal2", "Expense3", "TOTAL"],
"waterfallProperties":
{
  "firstLastFormat":
  {
   "color":
      {"type": "linear",
		     "start": {"x": "0%", "y": "0%"},
		     "end": {"x": "100%", "y": "100%"},
		     "stops": [[0, "teal"], [0.5, "lightblue"]]},
    "border":
      {
       "width": 2,
       "color": "navy",
       "dash": "2 2"
      }
    }
}
*END
ENDSTYLE
END
The output is shown in the following image.
| WebFOCUS | |
|
Feedback |