Accessing Features With the Ribbon
|
Topics: |
The App Studio ribbon replaces traditional toolbars with a single command bar that organizes commands and controls into a series of static and contextual tabs. From the ribbon, you can also access the WebFOCUS Administration menu, the Style menu, and the Help menu.
The default ribbon is shown in the following image.

Each tab on the ribbon, whether static or contextual, contains commands and controls that are organized into groups, according to their function or relationship. All tabs are named and all groups are labeled. Icons are used to represent the commands or controls in each group. By default, all icons are labeled. There are a few styling icons in the Style group that are not labeled. Rest your pointer over an icon to view the tooltip that identifies it. An example of this is shown in the following image.
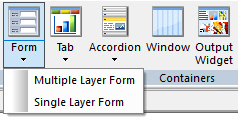
In addition to single-click commands, some commands on the ribbon contain a submenu of options that opens when you click the arrow associated with the command. These arrows can appear below or next to a label. An example of this is the DataForm command, which opens a submenu of options, as shown in the following image.
Note: There is no default ribbon size. As your monitor or application window size changes, the commands and controls on the ribbon resize themselves to fit the available space. Large monitors or application windows will display larger icons and entire groups. Smaller monitors or application windows may display groups as a single, labeled icon that opens a submenu.
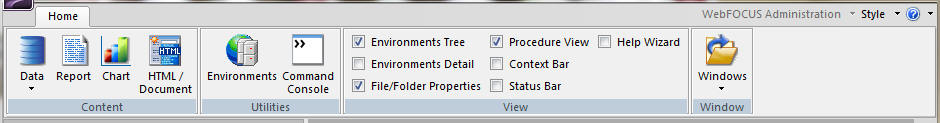
Building an Application Using the Home Tab
The Home tab enables you to access the features and functions necessary to build an application, create new components, open existing components, run existing components, and edit components. The Home tab contains the Data & Metadata, Content, UtilitiesConfigure, and ViewView, and Window groups. The Home tab is always available and is static. It is located in the upper-left corner of the App Studio interface, below the Quick Access Toolbar, as shown in the following image.
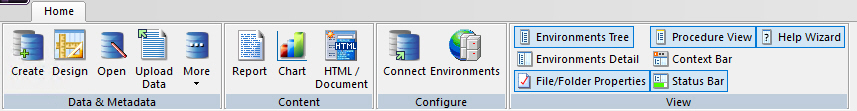
Note: The Home tab is the only static tab in App Studio.
Managing Data Using the Data & Metadata Group
|
Topics: |
The Data & Metadata group includes tools that you can use to connect to data, upload data, edit metadata, and manage data access. The Data & Metadata group is shown in the following image.
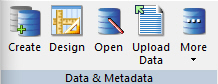
The commands in the Data & Metadata group are:
- Create
-
If you click Create, the Select Server Node dialog box opens. Navigate to the application folder where you want to create your synonym and click Select. After the location of the synonym is determined, the Select Adapter dialog box opens. Double-click the adapter connection that you want to use. You will then be able to select tables and other objects to create synonyms for.
- Design
-
Allows you to create a new synonym using the Metadata canvas. Navigate to the location where you want to create the new synonym and click Select.
- Open
-
Allows you to edit an existing synonym using the Metadata canvas. Navigate to the synonym that you want to edit and click OK.
- Upload Data
-
Allows you to upload data from a file on your machine, such as a delimited, Excel, JSON, or XML file. Select the type of file that you want to upload, then select a file and edit the metadata for the resulting synonym.
- More
-
Contains the following options:
- Passwords. The Password dialog box opens. You can enter the password for the data source you have selected in your Environments Tree panel.
- Rebuild a Connection. The Rebuild dialog box opens. You can rebuild a disorganized file, index a specific field from a file, or check the integrity of a file.
- Command Console. Opens a command tab for editing and enables you to send commands directly to a server from App Studio. For more information on creating, viewing, and editing source syntax, see Creating, Viewing, and Editing Source Syntax in WebFOCUS App Studio.
Sending Commands to the Server Using the Command Console
|
Topics: |
The Command Console enables you to send commands directly to a server from App Studio. This benefits users who have worked with Information Builders products and are already familiar with the command syntax.
The Command Console sends output to your web browser or App Studio Viewer. Output can include error messages, responses to query commands, and report output. The Command Console can also serve as a troubleshooting and debugging tool.
The following are a set of rules that you should follow when entering commands in the command console.
- The Console is case sensitive. Therefore, you must enter text in the case required for processing. For example, keywords must be entered in uppercase characters.
- The Command Console is not interactive. Therefore, you must enter all required commands in sequence and execute them as an entire process. For example, you must enter all steps required to execute the WebFOCUS REBUILD command. The Console does not prompt you for information.
- You can copy or cut text from the Command Console or an outside window, and paste it in the Command Console.
- You can drag command syntax within the Command Console.
The following groups are available in the Command Console Ribbon tab.
Listing the Available Paths Using the Execution Path Group
The Execution Path group contains a list of paths that are available for you to use when you execute commands. The Execution Path group is shown in the following image.
The command is:
- Execution Path List
-
Contains a list of available paths for you to execute commands.
The list of available execution paths is determined by the selected nodes in the Environments Tree panel. When you open App Studio for the first time, you must expand and select a node from the Environments Tree panel to populate the Execution Path List.
When you run the content of the console, it will be executed using the selected execution path and the Reporting Server associated with that selected path.
Loading Commands Using the Edit Group
The Edit group allows you to load commands, clear the console, and clear the input stack. The input stack is a series of commands that you enter using the Command console. The Edit group is shown in the following image.
The commands are:
- Back
-
Loads the previous command from the input stack.
- Forward
-
Loads the next command from the input stack.
- Clear Console
-
Clears the current commands from the console.
- Clear Input Stack
-
Clears the previously entered commands from saved memory. This option is unavailable if you do not have previously entered commands available for recall.
- Auto Clear Console
-
When selected, automatically clears the console after your commands are executed.
Note: The Command Console tab shares the following groups with the Text Editor tab: Find, Bookmarks, Position, Case/Comment, and Options. For more information on these remaining groups, see Creating, Viewing, and Editing Source Syntax in WebFOCUS App Studio.
Creating an Application Using the Content Group
The Content group contains the components or tools that you can use to create an application. These include: Data, Report, Chart, and HTML/Document. The Content group is shown in the following image.
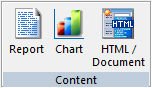
The commands in the Content group are:
- Data
-
Contains the Synonym via Metadata Canvas, Synonym, Manage Adapters, Data Source Password, and Rebuild Data Source commands. These provide you the options you need to create and edit synonyms for existing adapters, configure a new adapter, or add a remote server.
If you click Synonym via Metadata Canvas, the Data Source Definition Wizard opens. Navigate to the location of the data source you want to create or edit and click OK.
If you click Synonym, the Select Server Node dialog box opens. Navigate to the application folder where you want to create your synonym and click OK. After the location of the synonym is determined, the Select Adapter dialog box opens. Select the adapter you want to use and click OK. You will then be able to edit the synonym details.
If you click Manage Adapters, the Select Server Node dialog box opens. Navigate to a valid server location to begin configuring a new adapter or edit the settings of an existing adapter.
If you click Data Source Password, the Password Dialog box opens. You can enter the password for the data source you have selected in your Environments Tree panel.
If you click Rebuild Data Source, the Rebuild dialog box opens. You can rebuild a disorganized file, index a specific field from a file, or check the integrity of a file.
Note: To index a specific field from a file, the field must have FIELDTYPE=I, specified in the Master File. You can do this from the Metadata canvas using the FIELDTYPE property, I-Index check box.
- Report
-
Opens the Report canvas in report mode after you enter a procedure name and select a location for your report from the Report Wizard.
In report mode, you can create and style simple or complex reports, add data to the Report canvas, and style that data creating a graphical representation of the report page. This allows you to view how the report displays at run time.
Using report mode, you can:
- Display and sort data.
- Select records.
- Include totals, subtotals, column calculations, headings, footings, and images.
- Format columns.
- Style fonts, colors, and grids.
- Add drill downs to detailed reports and URLs.
- Save output in many types of formats for display and reuse.
- Create active reportsHTML Analytic Documents.
- Perform predictive analysis (an RStat license is required).
- Chart
-
Opens the Chart canvas after you enter a procedure name and select a location for your chart from the Chart Wizard.
In chart mode, you can easily transform almost any type of data into effective custom charts. You can create a variety of charts, such as bar charts, line charts, scatter charts, or pie charts, to help users analyze data in a different way. You can include selection criteria by defining parameters for your data. Additionally, you can apply drill-down capabilities and conditional styling to highlight specific data on a chart.
The Chart canvas contains a ribbon of features and options that allow you to add and style the data in your chart. Contextual tabs open within the Chart canvas, rather than on the App Studio ribbon.
- HTML/Document
-
Opens the HTML/Document Wizard. You can choose the type of page that you want to create from the following options: HTML Page, Guided Report Page, or Document. Depending on your selection, the corresponding canvas will open.
HTML mode provides the features you need to create HTML pages so that end users can interact with your data. You can build and customize an HTML page in the HTML canvas, using the contextual tabs on the ribbon to add objects to the page. HTML mode is fully integrated with JavaScript and cascading style sheets (CSS).
In the HTML canvas, you can:
- Build an HTML launch page.
- Add push buttons, hyperlinks, and other controls to launch WebFOCUS reports in your application.
- Create a launch page for one or more reports that contain parameters.
- Create a complete HTML page by adding multiple reports and charts.
- Create an advanced report layout by including images, frames, and other web objects.
- Modify the location, size, and properties of all objects in your page layout.
- Set background, font, and other page properties.
In the Document canvas, you can coordinate and distribute layouts made up of multiple reports and charts in a single document. You can position reports and charts anywhere on a single page or combine a series of layouts within a single document. When creating compound reports in the Document canvas, PDF, HTML, active reportsHTML and PDF Analytic Documents, PowerPoint, and Excel are available as output formats.
Creating a New Environment and Accessing the Command Console Using the Utilities Group
The Utilities group enables you to create a new environment and to access the Command Console, where you can send commands to the server. The Utilities group is shown in the following image.
The commands in the Utilities group are:
- Environments
-
Opens the Environments List dialog box. A WebFOCUS environment consists of a web server, a WebFOCUS Client, and a Reporting Server. Adding WebFOCUS environments allows you to create and manage multiple environments, such as development, test, and production instances. You can set a new development environment, add a new environment, edit an existing environment, or remove an environment.
- Command Console
-
Opens a command tab for editing and enables you to send commands directly to a server from App Studio. For more information on creating, viewing, and editing source syntax, see Creating, Viewing, and Editing Source Syntax in WebFOCUS App Studio.
Creating a New Environment and Configuring an Adapter Connection Using the Configure Group
The Configure group enables you to create a new environment and to configure an adapter. The Configure group is shown in the following image.
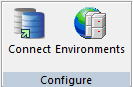
The commands in the Configure group are:
- Connect
-
The Select Server Node dialog box opens. Navigate to a valid server location to begin configuring a new adapter or edit the settings of an existing adapter.
- Environments
-
Opens the Environments List dialog box. A WebFOCUS environment consists of a web server, a WebFOCUS Client, and a Reporting Server. Adding WebFOCUS environments allows you to create and manage multiple environments, such as development, test, and production instances. You can set a new development environment, add a new environment, edit an existing environment, or remove an environment.
Sending Commands to the Server Using the Command Console
|
Topics: |
The Command Console enables you to send commands directly to a server from App Studio. This benefits users who have worked with Information Builders products and are already familiar with the command syntax.
The Command Console sends output to your web browser or App Studio Viewer. Output can include error messages, responses to query commands, and report output. The Command Console can also serve as a troubleshooting and debugging tool.
The following are a set of rules that you should follow when entering commands in the command console.
- The Console is case sensitive. Therefore, you must enter text in the case required for processing. For example, keywords must be entered in uppercase characters.
- The Command Console is not interactive. Therefore, you must enter all required commands in sequence and execute them as an entire process. For example, you must enter all steps required to execute the WebFOCUS REBUILD command. The Console does not prompt you for information.
- You can copy or cut text from the Command Console or an outside window, and paste it in the Command Console.
- You can drag command syntax within the Command Console.
The following groups are available in the Command Console Ribbon tab.
Listing the Available Paths Using the Execution Path Group
The Execution Path group contains a list of paths that are available for you to use when you execute commands. The Execution Path group is shown in the following image.
The command is:
- Execution Path List
-
Contains a list of available paths for you to execute commands.
The list of available execution paths is determined by the selected nodes in the Environments Tree panel. When you open App Studio for the first time, you must expand and select a node from the Environments Tree panel to populate the Execution Path List.
When you run the content of the console, it will be executed using the selected execution path and the Reporting Server associated with that selected path.
Loading Commands Using the Edit Group
The Edit group allows you to load commands, clear the console, and clear the input stack. The input stack is a series of commands that you enter using the Command console. The Edit group is shown in the following image.
The commands are:
- Back
-
Loads the previous command from the input stack.
- Forward
-
Loads the next command from the input stack.
- Clear Console
-
Clears the current commands from the console.
- Clear Input Stack
-
Clears the previously entered commands from saved memory. This option is unavailable if you do not have previously entered commands available for recall.
- Auto Clear Console
-
When selected, automatically clears the console after your commands are executed.
Note: The Command Console tab shares the following groups with the Text Editor tab: Find, Bookmarks, Position, Case/Comment, and Options. For more information on these remaining groups, see Creating, Viewing, and Editing Source Syntax in WebFOCUS App Studio.
Deploying an RStat Scoring Routine Using the Modeling Group
The Modeling Group is only available when RStat is installed. You can deploy an RStat scoring routine or estimate future values based on selected data.
WebFOCUS RStat is a statistical modeling workbench embedded in App Studio. It allows you to perform common statistical and data mining tasks, and develop models that can be deployed as scoring applications on every platform. RStat enables data miners and Business Intelligence developers to collaborate with the same tools used to access, manipulate, or transform data, develop predictive models, and create and deploy scoring applications along with associated reports to any worker within their organization. The Modeling group is shown in the following image.
The commands in the Modeling Group are:
- Model Deployment
-
Opens the Model Deployment dialog box. This functionality enables you to deploy existing, stored routines.
You can deploy an RStat scoring routine in any application directory within your app path on any WebFOCUS server. The process of deployment includes compiling the routine and placing the executable file in a location that can be accessed by a WebFOCUS scoring application.
- Predictive Modeling
-
Opens RStat, a statistical modeling workbench that is embedded in App Studio. When you select the Predictive Modeling command, the RGui window is opened and the R Console and RStat are activated.
You use RStat to derive expected and predicted values from data observations. Decision trees, regression, and the other algorithms are used to generate estimates. For example, you can estimate whether a prospect is a good target for a particular marketing campaign, or you can estimate the expected sales revenues for different stores in order to determine whether store layout and product mix have an impact on sales.
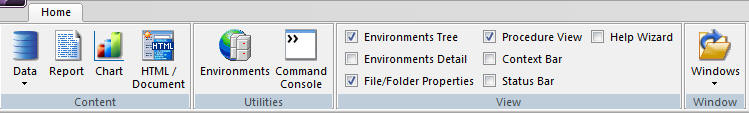
Controlling the Display of the Screen Using the View Group
The View Group enables you to control what displays on your screen. For example, you can choose whether to display or hide the Environments Tree or Help Wizard. The View group is shown in the following image.
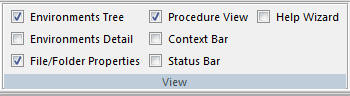
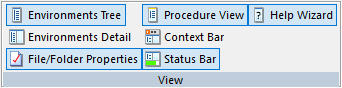
The commands in the View group are:
- Environments Tree
-
Displays or hides the Environments Tree panel, which displays on the left side of the screen and displays environment information.
- Environments Detail
-
Displays or hides the Environments Detail panel.
- File/Folder Properties
-
Displays or hides the File/Folder Properties panel.
- Procedure View
-
Displays or hides the Procedure View panel.
- Context Bar
-
Displays or hides the Context Bar. The Context Bar displays under the ribbon.
- Status Bar
-
Displays or hides the Status Bar. The Status Bar displays along the bottom of the screen.
- Help Wizard
-
Displays or hides the Help Wizard. By default, the Help Wizard panel opens in the bottom-right corner of the interface. The Help Wizard content dynamically changes, depending on where you are in the interface.
Viewing and Manipulating Windows Using the Window Group
You can view and manipulate all opened windows. The Window group is shown in the following image.

The commands in the Window group are:
- New Window
-
Opens another view of the same document, enabling you to have multiple canvas views of the same document. You can edit in any one of multiple views, each reflecting the changes made to the document. This option is only available when using the Text Editor. This option is not enabled for all other canvas tools.
- Windows
-
Manipulates all opened windows. You can view and manipulate the windows using the Windows dialog box. The Windows dialog box enables you to Activate or Save an open window.
Using the WebFOCUS Administration Menu
From the WebFOCUS Administration menu, you can access the WebFOCUS Administration Console, the Reporting Server Console, the Security Center, the WebFOCUS Home PageBI Portal, the Deferred Status console, the ReportCaster Console, and the Session Viewer. You can also create deferred status reports from this menu. The WebFOCUS Administration menu is shown in the following image.
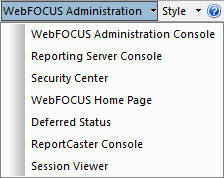
The WebFOCUS Administration menu is only available when you select an environment in the Environments Tree panel. The options available to you change, depending on the development area that you select in the Environments Tree panel. Deferred Status is only available when you select a Domains node in the Environments Tree panel. The Reporting Server Console is only available when you select a Web Applications node in the Environments Tree panel.
Note: App Studio always uses Microsoft Internet Explorer for all the tools available on the WebFOCUS Administration menu. This is the case even if you have selected another browser as the default viewer.
- WebFOCUS Administration Console
-
Opens the WebFOCUS Administration Console. Here, you can add remote Reporting Servers, configure application settings and client settings, and use WebFOCUS diagnostic tools.
- Reporting Server Console
-
Opens the Web Console. where a server user with the required metadata privileges can configure and manage adapters, add remote servers, and create synonyms, as an alternative to App Studio. In addition, many other configuration options are available through the Web Console.
For a full understanding of configuration options and server capabilities, see the Web Console Help system or the following manuals: Server Administration and Adapter Administration.
Note:
- The Reporting Server Console is sometimes referred to as the Web Console.
- For App Studio installations that allow stand-alone development, the local, default Reporting Server normally runs with security OFF, and the user who installed App Studio is the default administrator.
- Security Center
-
Opens the WebFOCUS Security canvas. Here, you can set user privileges and roles for users and groups.
- WebFOCUS Home Page
-
Opens the WebFOCUS Home Page. Here, you can create dynamic websites using the content you create in App Studio.
- Deferred Status
-
Opens the Deferred Report Status console. Here, you can defer running a report until a specified time. This option is only available in the Domains node.
- ReportCaster Console
-
Opens the ReportCaster Console. Here, you can schedule and distribute WebFOCUS reports, the content of URLs, and files.
- Session Viewer
-
Enables you to review system events that took place during recent work sessions and export them to system administrators or customer support staff. Traces of system events and error messages captured by the Session Viewer provide a clear picture of system operations, and enable you to investigate the causes of system disruptions or performance issues.
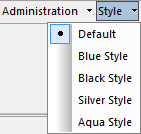
Customizing the Appearance of the Interface Using the Style Menu
You can customize the appearance of the App Studio interface from the Style menu. From this menu, you can select a theme with which to customize the App Studio interface. The themes available to you are determined by the themes that you have installed for Microsoft® Office. The Style menu is always available. It is located in the upper-right corner of the App Studio interface, as shown in the following image.
Note:
- When you close App Studio, the theme that you have selected is saved and used the next time you launch the product.
- When using a style other than Default, the drop-down arrow is removed from the panels. You can still access the menu by right-clicking the top frame of the panel.
Accessing App Studio Help Content
You can access the App Studio Help content, Focal Point Forums, App Studio licensing information, and other product options from the Help menu. The Help button is always available. It is located in the upper-right corner of the App Studio interface, as shown in the following image.
From the Help menu, you can do the following:
- Access the online Help system. Click Help Topics to open the App Studio Help window.
- Access the Focal Point community. Click Focal Point Forums to access our online developer center and more than a message board. It is an interactive network of developers from almost every profession and industry, collaborating on solutions and sharing tips and techniques.
- Reopen the Welcome screen after it has been closed. Click Display Welcome Screen to reopen the Welcome screen.
- Reset the interface layout. Click Reset Layout to return the App Studio interface settings, such as the ribbon, Quick Access Toolbar, panels, and styling, to their default. This change will not occur until App Studio is restarted.
- View license and product information. Click About to open the About WebFOCUS App Studio dialog box.
| WebFOCUS | |
|
Feedback |