Using Data Assist
|
Topics: |
Data Assist provides access to the Synonym Editor, which is an environment for managing and editing synonyms.
Introduction to Metadata
Metadata is data about data. Metadata describes the characteristics of your data sources and provides the information needed to access those data sources. This insulates you from the need to know how to optimally access the data, so that you can concentrate on using the data for reporting, charting, visualizations, and applications. Examples of metadata components are data type, data location, and data content and information about how to connect to it. Metadata can be generated whenever data is created, acquired, added to, deleted from, or updated in any data source within an enterprise.
Understanding Data Terminology
The smallest meaningful element of data in a data source is referred to as a column (for relational data sources) or a field (for non-relational data sources). Column and field are used interchangeably throughout this content. Every column or field has several characteristics, such as the data type (character, date, integer, or some other type) and length or scale. Field characteristics can also include output display options, such as comma inclusion, currency symbol, date display, and so on. For consistency, all fields should be included in the metadata, so all users get the same view of the data. However, you can create a logical view of the data in which only a subset of the fields are available.
Certain fields in a data source may have a one-to-one relationship with each other and describe a group of related characteristics. For example, each unique ID number represents only one employee. These fields can be grouped together into a segment or, in relational terms, a table. You can relate segments to each other by creating a multi-segment data source or by joining segments together. Segments are the building blocks of larger data structures.
Fields can be categorized as measures (facts), dimensions, hierarchy levels, or attributes.
A measure or fact is a numeric value, such as Gross Profit or Cost of Goods Sold, that you may want to aggregate. All numeric values that can logically be summed can be categorized as measures. Numeric fields that cannot be summed, such as product number and order ID, are not categorized as measures. Instead, they may be used in the same way as dimension fields to analyze measures. It is up to you to understand your data and determine whether each numeric field should be summed.
A dimension is a way to categorize data or sort output. You can use a dimension to analyze and compare measures. Generally, dimension fields are alphanumeric fields such as product. Certain dimension fields can be organized into hierarchies to define the relationships between the fields in the hierarchies and provide the information needed for the AUTODRILL feature. For example, a Geography hierarchy can contain the Continent, Country, State, and City fields. On report output, with AUTODRILL turned on, links will be provided on report or chart output that let you drill down the hierarchy levels to more detailed reports or charts. You can also define dimension fields that are not part of a dimension hierarchy.
An attribute is a field or collection of fields that add additional information about a dimension.
Using the Business View feature, you can create a view of the data that represents its business use by creating virtual segments called folders and adding fields to the folders. You can reuse fields in multiple folders. You can then categorize those folders and fields as measures (facts), dimensions, hierarchy levels, or attributes. Only the folder structure, not the real segments will be visible in the WebFOCUS tools and be available for use in requests.
Accessing Data
When WebFOCUS accesses data, it needs to know how to interpret the data that it finds. A Master File, which is the primary component of metadata, is a map of the segments in the data source and all of the fields in each segment. The Master File also identifies the name of the data source and the type of data source it is.
For some types of data sources, the Master File is supplemented by an Access File. An Access File includes additional information that completes the description of the data source. For example, it includes the full data source name and location. You require one Master File and, for some data sources, one Access File to describe a data source. These metadata files (Master File and Access File) are referred to as a synonym.
Synonyms are stored separately, apart from the associated data source. WebFOCUS uses a synonym to interpret a data source as follows:
- It identifies the data sources available and their respective fields.
- It examines the security rules, if Information Builders data source security (DBA) has been specified for the data source, and ensures that user access is allowed based on any DBA security specified.
- It identifies the Access File for the data source, if that data source requires an Access File.
The data source content is interpreted based on the information in the Master File and, if applicable, the Access File.
Working With Data Adapters
With the appropriate WebFOCUS Data Adapters configured, you can access data from many different sources, including the following:
- Relational data sources, such as Db2, Teradata, Oracle, and Sybase.
- Hierarchical data sources, such as IMS and FOCUS.
- Indexed data sources, such as ISAM and VSAM.
- Network data sources, such as CA-IDMS.
- Sequential data sources, both fixed-format and delimited format.
- Multi-dimensional data sources, such as SAP BW and Essbase.
- XML data sources.
Every adapter is specifically designed for the data source that it accesses, and, as a result, is able to translate between SQL or WebFOCUS and the data management language (DML) of the data source. The adapter manages the communication between the data interface and the data source and returns either answer sets or messages to the requestor. Adapters provide solutions to product variations, including product differences in syntax, functionality, schema, data types, catalogs, data representations, message processing, and answer set retrieval. It is the adapter that manages the synonym creation process.
The parameters required to configure supported adapters and to create synonyms for the corresponding data sources are described in detail in the Adapter Administration manual.
Generating Synonyms
Synonyms are useful because they insulate client applications from changes to the location and identity of a request. You can move or rename a request without modifying the client applications that use it. You need to make only one change, redefining the request synonym on the server. Synonyms provide support for the extended metadata features of the server, such as virtual fields and security mechanisms. Creating a synonym generates a Master File and an Access File.
Often, a synonym already exists on the server, and reporting can begin at once. However, if the synonym you require does not exist on the server, an authorized server or application administrator can create it directly using the Web Console, the Data Management Console (DMC), or the Metadata canvas in App Studio.
Although, you can use Data Assist to create a new synonym, the situations in which you need to do this are extremely rare. The Web Console, DMC, and Metadata Canvas provide automatic and error-free synonym creation tools.
Once you have generated a synonym, you can report against the synonym. In many instances, the configured adapter and the generated synonym are all you need to access your data and create reports and graphs.
However, you may wish to enhance the synonym in order to implement particular capabilities that are supported in the WebFOCUS data description language. To do this, you can use Data Assist or the Metadata canvas.
Enhancing a Synonym
The following are some of the attributes you might want to add to the synonym to enhance your data access and reporting capabilities. You can:
- Add virtual columns (DEFINE fields) and columns for aggregated values (COMPUTE fields).
- Add filters to specify data selection criteria.
- Add group definitions for data sources that support groups.
- Add meaningful titles and descriptions, including multilanguage variations.
- Change the format of fields (for example, the size of an alphanumeric field or the format of a date field).
- Create a cluster join view by linking available synonyms to create a multisegment (multitable) file for reporting.
- Create business views of the metadata in order to limit the fields available to any retrieval request that references the business view and to group fields together based on their roles in an application.
- Define parent and child hierarchies for cube data sources.
- Apply security rules for fields and values to ensure that user access is based on Information Builders data source security (DBA) specifications.
Opening the Synonym Editor
You open a synonym in the Synonym Editor by:
- Clicking New on the Applications ribbon or right-clicking an application folder and clicking Cluster Business View or Synonym. If you click Synonym, the Connect to Data page opens so you can upload a file or connect to an adapter and create a synonym for that file or connection.
- Double-clicking a synonym on the Applications page.
- Right-clicking a synonym on the Applications page and clicking Open.
- Uploading a file or right-clicking an adapter connection on the Connect to Data page.
The synonym opens in the Synonym Editor, as shown in the following image of a Cluster Business View open in the Synonym Editor.

The Join Editor is open showing the joins included in the cluster, with an Applications pane you can use to add tables to the cluster.
The Output pane is open to show sample data.
Note that each data item has an icon that indicates the data type of that item. For information about:
- The Synonym Editor ribbon and frames, see Understanding the Synonym Editor User Interface.
- The enhancements you can make to a synonym, see Enhancing a Synonym.
Understanding the Synonym Editor User Interface
|
Topics: |
|
Reference: |
The Synonym Editor user interface consists of a ribbon and frames used for viewing and enhancing a synonym. You can open multiple synonyms in the Synonym Editor.
The number of frames you actually see when you open a synonym depends on the environment from which you are accessing the Synonym Editor and the characteristics of the synonym you open.
Reference: Synonym Editor Ribbon
The Synonym Editor Ribbon is shown in the following image. The buttons that display depend on the environment from which you opened the synonym.

File Menu
Provides the following options.
- New
-
Enables you to create a new Cluster Business View, Connect to Data, Custom Copy, or Flow.
- Open
- Enables you to open a Synonym, Custom Copy, or Flow.
- Switch Files
-
Opens a list of files currently open in the Synonym Editor and lets you select one to switch to.
- Refresh from Disk
-
Reopens the saved version of the synonym.
- Save
-
Saves the file in the tab that currently has the focus.
- Save all Files
-
Saves the files open in all tabs.
- Save As
-
Opens the Save As dialog box to save the current file.
- Close
-
Closes the file that currently has the focus. If you have made changes and have not saved the file, a Close dialog box opens asking if you want to save changes.
- Exit all without saving
-
Exits without saving the changes to any open synonym.
- Close Tool Retaining Context
-
Closes Data Assist. If you reopen Data Assist, the tabs from the previous session will be intact.
Related Menu
Provides the following options.
- Open Base Synonym
-
This option will only be available if the current tab is for a cluster synonym. It provides a list of the synonyms referenced by the cluster. Select one or more to open them in new tabs.
- Custom Copy
-
Opens a Custom Copy window in a new tab.
- Cube Browser
-
Opens a Data Assist query tool for cubes.
- Undo
-
Undoes the most recent actions. You can set the number of undo actions supported using the Options menu. The default number of undo actions is 50.
- Redo
-
Redoes the most recent actions. You can set the number of redo actions supported using the Options menu. The default number of redo actions is 50.
Advanced Options Menu
Provides the following options.
- Options
-
Opens the Advanced Options dialog box for setting the following preferences.
- Synonym Editor
-
Includes the following options.
- Support extended options. Selections are Yes and No. The default value is No. This will add right-click options sort objects and styles to appropriate fields and folders.
- Column Management
-
Includes the following options.
- Name display strategy. Lets you select the type of metadata to display in the tree. Supported values are Name, Title, Description, Alias. The default value is Title.
- Function display strategy. Lets you select whether to display function syntax or a short description when you right-click a field and add a function. The default is a short description.
- Language Generation
-
Includes the following options.
- Use segment to qualify field reference. Defines how field references will be generated in requests. Selections are For duplicate fields and Always. The default value is For duplicate fields.
- Use application name to qualify synonym reference. Defines how synonym references will be generated in requests. Selections are Yes and No. The default value is No.
- Limits
-
Includes the following options.
- Maximum number of rows for test. Enter the maximum number of rows for test queries. The default value is 50.
- Maximum number of columns for test. Enter the maximum number of columns for test queries. The default value is 999999.
- Limit number of database reads for a filter. Enter a limit for the number of initial database reads for a filter if performance for filters is an issue. You will then be able to edit the filter or add additional values.
- Maximum number of identical error messages. Enter the maximum number of identical error messages that can be issued. The default value is 10.
- Random Sampling limit (in %). Enter the maximum sample size for data profiling, as a percent.
- Undo/Redo Limit. Enter the maximum number of undo/redo actions supported. The default value is 50.
- Omit missing (null) values in Data Profiling charts. Select Yes to omit missing values in the charts generates for data profiling. The default value is No, which includes missing values.
- DBA
-
Opens the DBA dialog box for adding security rules to the synonym. For more information, see Adding Data Source Security (DBA).
- AutoRun
-
Provides the following options.
- Off
-
Does not show sample output.
- On
-
Creates a tab in the output window with a sample of the current data. On is the default value.
- Data Preview
-
Can be Off or On. On shows sample values in the Table/Columns and Business View panes. Off does not show sample data values in the Tables/Columns and Business View panes. On is the default value.
- Sample Data
-
Lets you generate a sample data report of the current synonym in the output pane.
- Diagnostics
-
Provides the following options.
- View MFD
-
Opens a text view of the Master File in the Output pane.
- View AFD
-
Opens a text view of the Access File in the Output pane.
- MFD Info
-
Displays a report about the segments and fields in the Master File.
- Show Layout
-
Opens the layout window.
- Clear Undo History
-
Clears the history of undo actions.
Help Menu
The Help menu (? icon) on the right of the ribbon provides the following options.
- Contents and Search
-
Opens the Web Console help page.
- Tutorials
-
Provides a tutorial for using Upload/Connect to Data and Business View +.
- Version
-
Displays version information.
- Browser Support
-
Opens a window that shows supported browsers and browser versions.
- New Features
-
Opens a list of new feature manuals in PDF format for the various 77 server releases.
- Release Notes
-
Opens the Release Notes report for this version of the server.
- Quick Setup Guides
-
Opens installation and adapter prerequisites help files.
- Licenses
-
Enables you to open the Information Builders license terms or third party licenses, if any.
The sidebar has the following button.
- Table/Column
-
Opens the Table/Column pane, which shows the physical view of the segments and fields. This pane is hidden, by default.
Understanding Synonym Editor Frames
|
Reference: |
The Synonym Editor frames that you see by default depend on the environment from which you are opening a synonym and the characteristics of the synonym. The frames available in Synonym Editor are:
- Table/Column frame. This frame shows the physical structure (segments and fields) of the data source. It is hidden by default, but you can show it by clicking the Table/Column button on the sidebar.
- Business View frame. This pane shows the logical view of the data source.
- Filters/Groups frame. This frame shows any filters and groups defined in the synonym or view. It only shows when you create a filter or group.
- Output frame. This frame shows sample data and reports.
- Join frame. This frame shows the joins defined in the cluster synonym in modeling view. It also shows an Applications frame that you can use to add tables to the joins.
Each frame has a menu bar that offers options specific to that frame as well as options that are common to multiple frames.
Reference: Common Synonym Editor Options
The following menu bar options are common to multiple frames.
- The Find (magnifying glass) button is common to all multiple Synonym Editor frames. It toggles a text box for entering a search term.
After implementing a search, a cancel (undo) button becomes available to delete the search term.
- The Hover menu is common to all panes in the Web Console. You can open it by hovering the mouse on the top right of a pane.
It enables you to drag the pane to a different location on the page, maximize the pane, close the pane, and specify layout
options for the pane. The hover menu is shown above the Search icon on Business View frame in the following image.

In addition, there are common right-click menu options for fields in the Table/Column, Business View, and Output panes. Some of the options that show up are dependent on the data type of the field. For more information, see Right-Click Options for Fields in the Table/Column, Business View, and Output Panes.
Reference: Table/Column Frame
The Table/Column frame displays the physical characteristics of the underlying data sources represented in the synonym. You can use options on the menu bar, or use the context sensitive right-click menu options, to make changes to the physical synonym.
The Table/Column frame is shown in the following image.
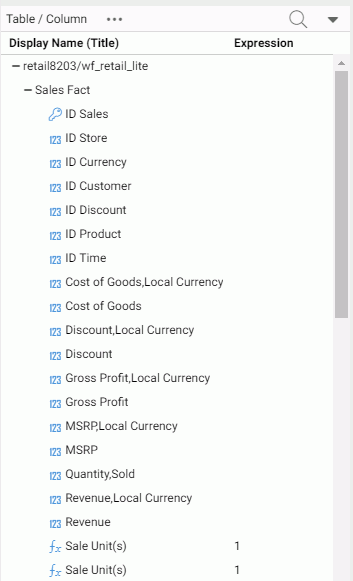
The icon next to each column identifies the data type of the column.
The menu bar at the top of the pane has the following options.
- The Display menu (...) at the top of the pane gives you the following display options for the synonym tree.
- Columns/Tables
-
Lists the segments and fields in the synonym with their data types and two data values. This is the default display.
- Tables
-
Displays the segments (tables) and their relationships in the form of a tree.
- Join Editor
-
Opens a frame that displays the Join Editor. You can edit the joins using menus and options at the top of the pane or right-click options. For more information, see Creating a Join.
- The View menu (down arrow) gives you the following options.
- Choose Columns ...
-
Opens a dialog box for selecting the metadata attributes and number of field values to display.
- Reset to Defaults
-
Resets the pane to the default view.
Options When Right-Clicking the Synonym Name
Properties. Opens a dialog box for editing the following properties. Click Apply when you have finished editing the properties.
- General Properties
-
The following general properties are available.
- SUFFIX
-
identifies the type of data source being accessed. This cannot be changed in this dialog box.
- MDF_PROFILE
-
Specifies a FOCEXEC to be run prior to any request that references the synonym.
- FDEFCENT
-
Defines the default century for handling cross-century dates. Cannot be changed in this dialog box.
- FYRTHRESH
-
Defines the year threshold for handling cross-century dates. Cannot be chnaged in this dialog box.
- REMARKS
-
Provides a description.
- Miscellaneous Properties
-
The following miscellaneous properties are available.
- BV_NAMESPACE
-
Can be one of the following values. Switching the value can invalidate field references in a request.
- OFF. Uses segment names to resolve field references. This is the default value.
- ON. Is only available for upward compatibility with synonyms from prior releases. It should not be used except in consultation with Customer Support Services.
- DV_INCLUDE
-
Can be one of the following values.
- YES. Inherit dimension view properties from base synonyms in the cluster. This is the default value.
- NO. Do not inherit dimension view properties from base synonyms in the cluster.
New Variable. Opens a dialog box for referencing a global or system variable in the synonym. Click Apply after entering or selecting values for the following properties.
- Variable Name
-
Enter the name of a global or system variable to be referenced in the synonym.
- Prompt Caption
-
Is descriptive text to replace the variable name in the prompt.
- Default Value
-
Enter a default value for the variable.
- Prompt Values
-
Select one of the following options.
- Input box. The user will enter a value in a text box.
- Static list of values. You define the list of values that the user can select from. Two additional fields open:
Select Type. Select Single selection, if the user can only select one value from the list, or Multiple selection, if the user can multi-select values from the list.
Values. Enter the list of values, enclosed in single quotation marks, and separated by the OR operator.
- Static list of values/captions. You define the list of values that the user can select from and descriptive text to display instead of the values. Two additional
fields open:
Select Type. Select Single selection, if the user can only select one value from the list, or Multiple selection, if the user can multi-select values from the list.
Caption/Value Pairs. Enter the list of captions and values, in the following form.
(<'cap1', 'val1'>,<'cap2', 'val2'>)
- Synonym based dynamic list of values. The user will select from a dynamic list of values found in a field in a server-accessible data source. Four additional fields
open:
Select Type. Select Single selection, if the user can only select one value from the list, or Multiple selection, if the user can multi-select values from the list.
Lookup Synonym. Enter the name of the synonym for the data source that contains the field values that will comprise the generated list of values, or click the ellipsis (...) to navigate to the synonym.
Lookup Field. Select the name of the field that contains the acceptable values for the generated list.
Lookup Display Field. Select the name of the field that contains the values to be displayed on the generated list.
- Procedure based dynamic list of values. The user will select from a dynamic list of values found in a WebFOCUS request. Five additional fields open:
Select Type. Select Single selection, if the user can only select one value from the list, or Multiple selection, if the user can multi-select values from the list.
Lookup Procedure. Enter the name of the procedure that contains the field values that will comprise the generated list of values, or click the ellipsis (...) to navigate to the procedure.
Lookup Procedure Parameters. Enter any parameters needed for running the procedure.
Lookup Field. Select the name of the field that contains the acceptable values for the generated list.
Lookup Display Field. Select the name of the field that contains the values to be displayed on the generated list.
- Quoted
-
Select this option to enclose the string in single quotation marks.
- Usage Format
-
Select from Integer, Character (fixed), or Decimal. Additional fields open to specify the length of the format and, for Decimal, the number of decimal places.
New Expression. Click Advanced Define to create a virtual field or Advanced Compute to create a calculated value. For information about creating expressions, see Using the Expression Calculator.
Data Profiling. Click Statistics, Count, or Key Analysis. For more information about data profiling reports, see Using Data Assist.
Sample Data. Click this option to generate sample data with the current version of the synonym.
Impact Analysis. Click this option to generate a report on where this synonym is used.
Reference: Business View Frame
The Business View (BV) frame shows the logical view of the synonym. You can drag fields from the Table/Column frame, use options on the menu bar, or use the context sensitive right-click menu options to make changes to the nodes or folders.
If you open an existing synonym, and it has a BV, that BV will be shown. If the synonym does not have an existing BV, th BV is not built, and just the top node is shown.
If you do not open an existing synonym, the icons at the top of the BV frame control what is generated:
- Create Default (
) creates a full populated structure.

- Create Template Folders (
) creates a DV structure that is not populated

If an existing synonym from a prior release has a BV structure, for upward compatibility it is still supported. However, it limits you to working with folders in the BV frame and requires procedures that use this synonym to use folder.field references instead of segment.field references.
The Business View frame is shown in the following image.

Note: if you need to drag a field to a location below the visible area of the screen, the frame will automatically scroll as you drag, so you can drop the field where you need to place it.
The menu bar at the top of the frame provides the following options. Note that certain options only appear when the view supports them.
- The Reset Default button resets the frame to the default view.
- The Flatten button removes child folders.
- The Create Template Folders button creates the pre-defined DV folders Filters, Measures, and Dimensions.
- The Display menu provides the following options for displaying the folder tree.
- Folders/Columns
-
Lists the folders and fields in the view with their data types and two data values. This is the default display.
- Folders
-
Displays the folders and their relationships in the form of a tree.
- Modeling View of Folders
-
Displays the modeling view of the synonym, a pictorial view of the filters, join, and variables.
- The View menu (down arrow) gives you the following options.
- Choose Columns ...
-
Opens a dialog box for selecting the metadata attributes and number of field values to display.
- Reset to Defaults
-
Resets the frame to the default view.
If you right-click the cluster synonym name and click Manage Folders, you can create a new folder.
Reference: Filters/Groups Frame
The Filters/Groups frame shows filters and groups defined in the synonym when you create a new filter of edit an existing one.
Each filter or group added is displayed in its own card (vertically tiled frame) within the Filters/Groups frame.
The Filters/Groups frame is shown in the following image.
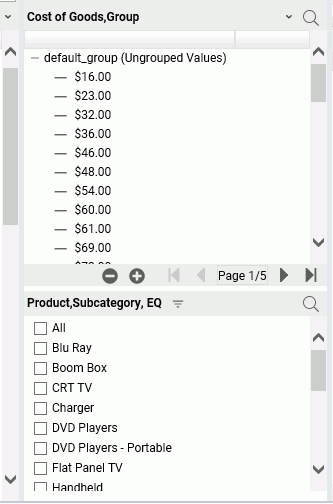
Each group card has an expand button on the menu bar, which expands the Filters/Groups frame. Once the frame is expanded, a Restore button appears for collapsing the frame.
The filter options menu provides the following options.
- Display Menu
-
Provides the following options for displaying and selecting the filter values.
- Dropdown List
-
Generates a dropdown list for filter values. When expanded, a check list of values.
- Check List
-
Lists the field values with a check box next to each, and a scroll bar, if needed to scroll through the values. This is the default display option for filters on alphanumeric and integer fields.
- Slider
-
Available for filters on non-integer numeric fields only. Displays a bar with two sliders for selecting From and To values. When you move the sliders, a Reset button displays that resets the range to the entire range of values. This is the default display option for filters on non-integer numeric fields.
- Text Box
-
Adds a text box in which to enter a character string or pattern that uses the wildcard characters supported with the LIKE operator. A percent symbol (%) in the pattern means that any number of characters in that position matches the pattern (added automatically at the end of the character string you enter). An underscore character (_) means that a single character in that position matches the pattern. A plus sign on the menu bar enables you to add additional values, and a check mark enables you to apply the filter.
- Double List
-
Shows two lists, one with available values and one with selected values. To add values to the Selected Values list, you can right-click a value or multi-selected values (if Multiple Values is enabled) and choose Select. You can also double-click a value or drag values. To remove values from the Selected Values list, you can right-click a value or multi-selected values and choose Unselect. You can also double-click a value or drag values.
Once you have added a value to the Selected Values list, an Unselect all button appears to make it easy to remove all selections.
- Multiple Values
-
Enables multiple selections. This is the default selection option.
- Single Value
-
Disables multiple selections.
- Plain
-
Displays a one-column list of values. This is the default display.
- Two columns (drop a field)
-
Enables you to drop a field that contains a caption (description) for each filter value in a second column.
- Relation Menu
-
Provides the following operators for the filter.
- EQ
-
Selects fields with values equal to a filter value. This is the default operator for alphanumeric and integer fields.
- NE
-
Selects fields with values not equal to any filter value.
- LT
-
Selects fields with values less than the filter value.
- GT
-
Selects fields with values greater than the filter value.
- LE
-
Selects fields with values less than or equal to the filter value.
- GE
-
Selects fields with values greater than or equal to the filter value.
- LIKE
-
Selects fields whose values match a pattern. This operator is available for alphanumeric fields where the display is a text box.
- RANGE
-
Selects fields whose values fall within a range. This operator is available for numeric fields. This is the default operator for non-integer numeric fields.
- Variables Menu
-
Supported for filters on alphanumeric fields. It lists all defined variables for selection and includes the default option to prompt for actual data.
- Values Menu
-
Supported for filters on alphanumeric fields. Provides the following options.
- Show Null
-
Shows null values on the list of selection values.
- Hide Nulls
-
Does not show null values on the list of selection values. This is the default option.
- Convert to &&-variable
-
Supported for a check box filter that uses the EQ or NE relation and has a limited number of values. Converts the filter to a global variable expression that improves performance.
- Lookup other file
-
Enables you to create a DB_INFILE expression that checks each value against values that exist in another file.
- Advanced Menu
-
Provides the following options.
- No delay, immediate update
-
Updates the filter as soon as you select a value. This is the default update option.
- Use Apply button
-
Does not update the filter until you click the Apply Filter button, which displays on the menu bar when you select this option.
- Show selected values on top
-
Moves selected values to the top of the list. This is the default option.
- Keep selected values in place
-
Does not move selected values to the top of the list.
- Delete Filter
-
Deletes the filter from the synonym and the Filters/Groups frame.
- Properties
-
Opens a dialog box showing filter properties in which you can change the title for the filter that appears on output.
Group Menu
The down arrow (menu) for a group provides the following options.
- Display Menu
-
Provides the following options for displaying groups.
- Double List
-
Shows two lists, one with input values and one with selected values. To add values to the Selected Values list, you can right-click a value or multi-selected values and choose Select. You can also double-click a value or drag values. To remove values from the Selected Values list, you can right-click a value or multi-selected values and choose Unselect. You can also double-click a value or drag values. If you right-click in the Input Values list and select Make a new group, the new group will be added in the Selected Values list. The added groups are named based on the values selected and contain the values selected.
- Single List
-
Shows a list of values, initially in one default group. Right-click menu options let you create a new group, copy and paste values, ungroup values, and edit the group name, and recreate groups based on like-sounding values.
- Add All
-
Adds all shown ungrouped values to a new group.
- Create a New Group
-
Creates a new group with no values in it.
- Recreate groups by Metaphone
-
Uses the Metaphone encoding algorithm to group alphanumeric values by pronunciation.
- Recreate groups by Soundex
-
Uses the Soundex encoding algorithm to group alphanumeric values by pronunciation.
- Ungroup All
-
Removes all groups except the default group.
- Edit properties
-
Opens the Edit properties dialog box. You can change the overall group name, title, and default value.
- Hide Group Card
-
Removes the group from the frame, but leaves it in the synonym. To reopen the group in the Filters/Groups frame, right-click the group in the synonym and select Edit Grouping.
Reference: Output Pane
The Output pane shows the results of changes to a synonym or view, sample data output, and output of sample data, impact analysis, and data profiling reports and charts.
Each new output can be added on a new tab in the Output pane or replace the existing tab, depending on your preferences. The following image shows the output pane with multiple tabs. If there are too many tabs to display in the window, left/right arrows (< >) display for scrolling.
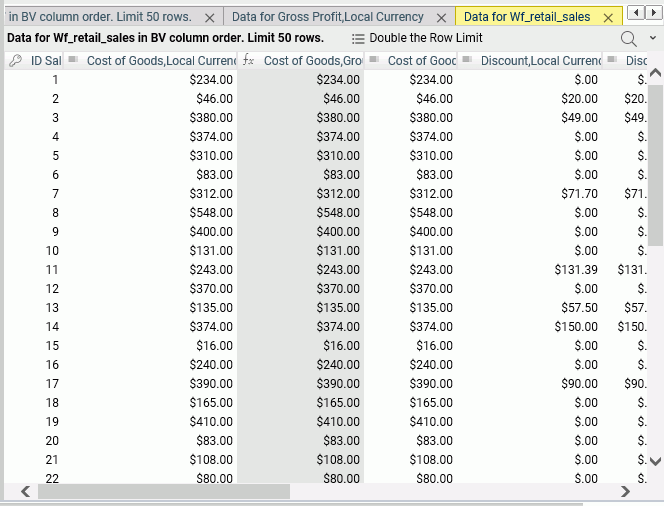
The menu bar at the top of the pane provides the following options.
- Double the row limit
-
Doubles the number of rows used for sample and changed data display.
The View menu (down arrow) provides the following options.
- Choose Columns ...
-
Opens a dialog box for selecting the metadata attributes and number of field values to display.
- Reset to Defaults
-
Resets the pane to the default view.
On each tab, each column title has a menu (opened using the down arrow) that has the same options as the right-click menu for the field in the Table/Column and Business View panes. For information, see Right-Click Options for Fields in the Table/Column, Business View, and Output Panes.
In addition, if you click a column heading, the sort order for that tab toggles between sort ascending, sort descending, and original order of the column in which you clicked.
Enhancing a Synonym
|
Topics: |
You can enhance a synonym by:
- Assigning DV roles. For information, see Assigning Dimension View (DV) Roles.
- Adding filters. For information, see Right-Click Options for Fields in the Table/Column, Business View, and Output Panes.
- Creating a virtual field. For information, see Creating a Virtual Field.
- Creating a calculated summary value. For information, see Creating a Calculated Value.
- Adding a global variable. For information, see Adding a Global Variable to a Synonym.
- Creating a join. For information, see Creating a Join.
- Adding security restrictions. For information, see Adding Data Source Security (DBA).
- Pivoting columns. For information, see Pivoting Columns.
Note: When you enhance a synonym, in most cases you can use the Business View frame to create the enhancement. However, since this frame gives you a logical view of the synonym, it does not give you full access to the features that are added. For example, you can hide a virtual field or calculated value so that it does not appear in the Business View, but that will not delete it from the synonym. To have full view of and access to synonym components, you must open the Table/Column frame, if it is not already open. To open the Table/Column frame, click Table/Column on the sidebar. This frame represents the physical view of the synonym and provides full access to all of its components.
Assigning Dimension View (DV) Roles
The Business View frame defines folders that function as segments to provide a view of the synonym and to define the accessible fields and their relationships. Folder relationships are the same as segment relationships, with parent folders, child folders, and sibling folders.
You can assign a DV role to a folder or field by right-clicking the folder or field and selecting a DV role, as shown in the following image.
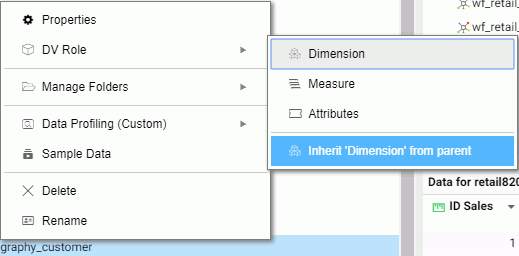
You can explicitly assign a DV role to a folder or field, or have it automatically inherit its role from its parent. If you explicitly assign a DV role, that role moves with the object if you drag it to another location within the structure. If you do not explicitly assign a DV role, the role changes as you move the object under a new parent, except if you drop it onto a field with the Drill Level role. If dropped onto a Drill Level field, the moved field inherits the Drill Level role.
The following DV roles can be assigned.
- Dimension. A dimension field, when double-clicked or dragged onto the report or chart canvas in the WebFOCUS tools, will automatically
be added to the request as a vertical (BY) sort field.
A folder can be assigned the role Dimension.
A field can be assigned the role Dimension (Standalone) or Dimension (Drill Level). When it is assigned the role Dimension (Drill Level), it will become part of a hierarchy where the levels depend on the order of the fields in the folder. Then, when AUTODRILL is turned on, automatic drill-downs will be created on the report or chart output.
For a folder assigned the DV role Dimension or a field assigned the DV role Dimension (Standalone), the following attribute is added to the folder or field declaration in the synonym.
DV_ROLE=DIMENSION
For a field assigned the DV role Dimension (Drill Level), the following attribute is added to the field declaration in the synonym.
DV_ROLE=LEVEL
A folder can contain only one drill level hierarchy. However, you can use the same fields in multiple hierarchies by placing each hierarchy in a separate folder. A folder with a drill level hierarchy is not limited to just the hierarchy. It can contain other fields with different DV_ROLEs, although this is not recommended.
- Measure. A measure field, when double-clicked or dragged onto the report or chart canvas in the WebFOCUS tools, will automatically
be added to the request as an aggregated value (SUM), if it is numeric. If it is alphanumeric, it will be added as a vertical
(BY) sort field. A folder or field can be assigned the role Measure.
For a folder or field assigned the DV role Measure, the following attribute is added to the folder or field declaration in the synonym.
DV_ROLE=MEASURE
- Attribute. An attribute field, when double-clicked or dragged onto the report or chart canvas in the WebFOCUS tools, will automatically
be added to the request as a vertical sort field (BY).
For a folder or field assigned the DV role Attribute, the following attribute is added to the folder or field declaration in the synonym.
DV_ROLE=ATTRIBUTE
- Folder. A folder is a virtual segment in a BV. It can be assigned the roles Dimension, Measure, Attribute, or Folder.
Note: When a folder is inserted as a child of a field, the attribute PARENT_FIELD describes this relationship. By default, such a folder and its fields will be assumed to have the Attribute role.
- None. If no role is assigned, the field or folder will inherit its role from its parent. If a role has been assigned, you can remove it by selecting the option to inherit its role from its parent.
Example: Sample Dimension Folder Declaration
The following declarations show sample folder and field definitions. Note that the declaration for each field in a folder specifies the real segment it actually belongs to.
The DV_ROLE for the PRODUCT folder is DIMENSION. The DV_ROLE for the PRODUCT_CATEGORY field is LEVEL.
 FOLDER=PRODUCT, PARENT=DIMENSIONS,
    DV_ROLE=DIMENSION,
    DESCRIPTION='Product', $
    FIELDNAME=PRODUCT_CATEGORY, BELONGS_TO_SEGMENT=WF_RETAIL_PRODUCT,
      DV_ROLE=LEVEL,  $
    FIELDNAME=PRODUCT_SUBCATEG, BELONGS_TO_SEGMENT=WF_RETAIL_PRODUCT,
      DV_ROLE=LEVEL,  $
    FIELDNAME=MODEL, BELONGS_TO_SEGMENT=WF_RETAIL_PRODUCT,
      DV_ROLE=LEVEL,  $
Creating a Virtual Field (DEFINE) or Calculated Value (COMPUTE)
A virtual field can be used in a request as though it is a real data source field. The calculation that determines the value of a virtual field is performed on each retrieved record that passes any screening conditions on real fields. The result of the expression is treated as though it were a real field stored in the data source. A virtual field defined in a synonym is available whenever the data source is used for reporting.
A calculated value is a temporary field that is evaluated after all the data that meets the selection criteria is retrieved, sorted, and summed.
Right-click a field, point to New Expression, and click:
- Apply Function, to apply a function to the field.
The Apply a Function dialog box opens, as shown in the following image.
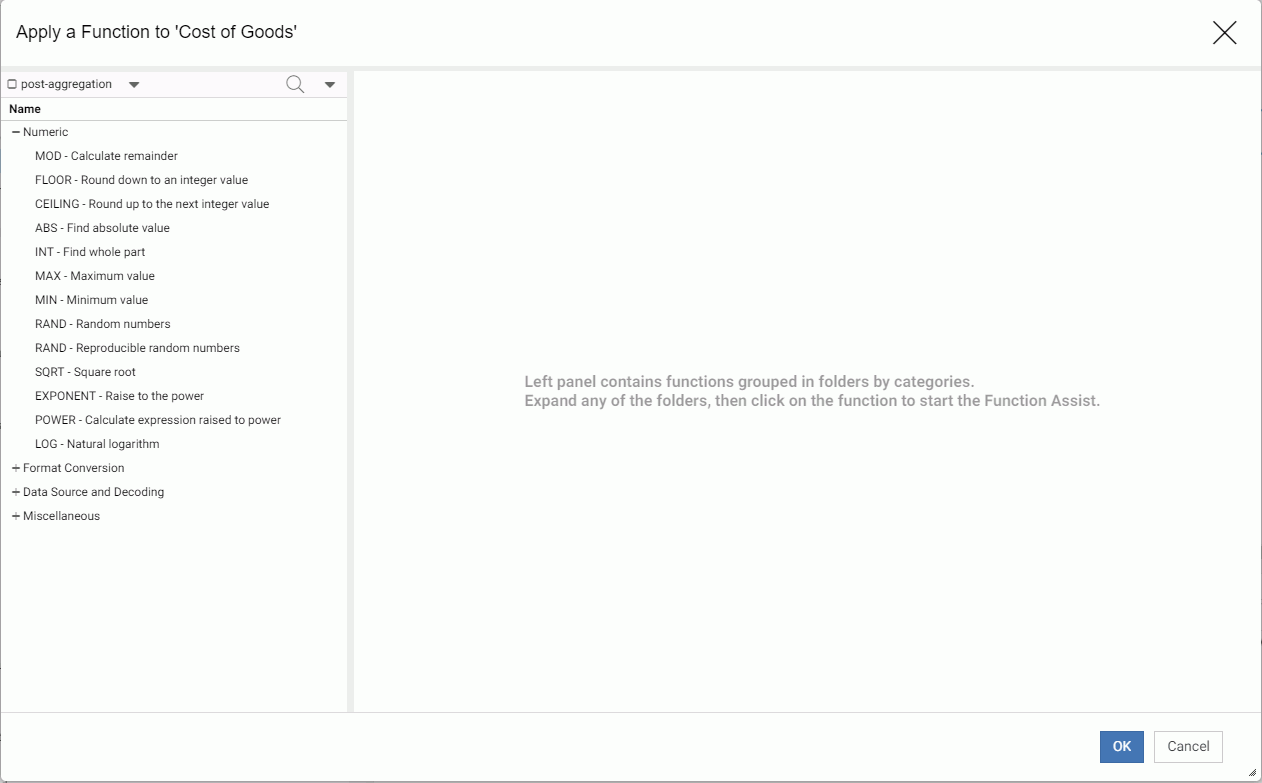
When you have entered the required information, click OK. For more information, see Using Data Assist.
- Advanced Expression to create a complex expression.
The Advanced Expression calculator opens, as shown in the following image.
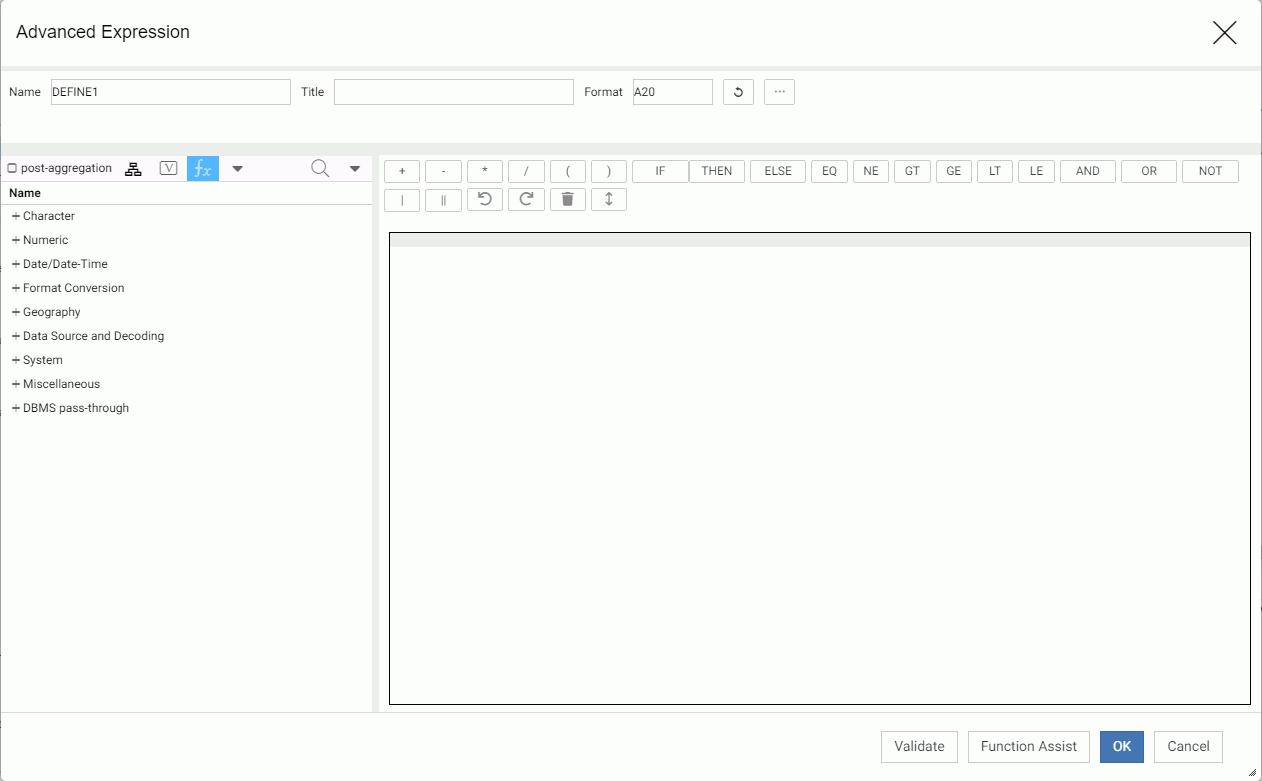
By default, the post-aggregation check box is not selected. This creates a DEFINE. If you click the check box, you will create a COMPUTE.
Create the Expression and click OK.
For more information about creating an expression see Using the Expression Calculator.
- Group and Replace or Phonetic Grouping. Opens the Filters/Groups frame and creates a group field using values of the selected field. For more information, see Filters/Groups Frame and Using Data Assist.
- Create Bins. Opens a wizard for dividing the data values in the field into a specified number of bins based on equal intervals, equal intervals using a formula, or quantiles. For more information, see Using Data Assist.
Creating a Calculated Value
A calculated value is a temporary field that is evaluated after all the data that meets the selection criteria is retrieved, sorted, and summed.
- Click the Expressions drop-down list on the Data Assist ribbon and click Summary Expression.
The Add Summary expression calculator opens, as shown in the following image.
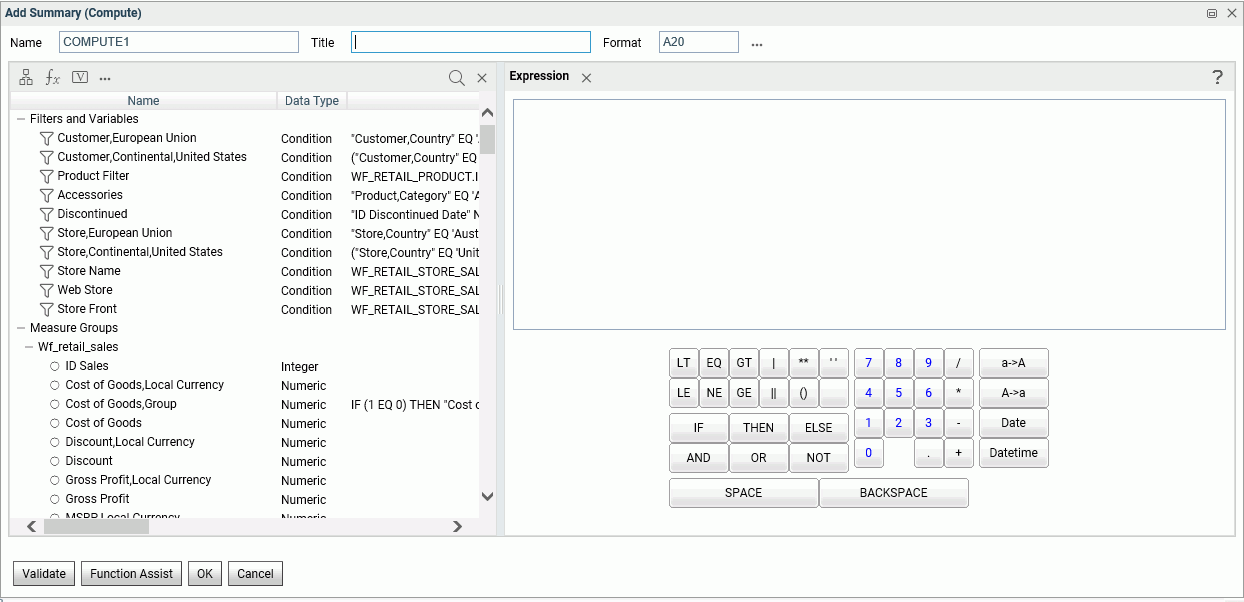
- Create the expression.
For more information about creating an expression see Using the Expression Calculator.
- Click OK.
Using the Expression Calculator
When you generate a virtual field or calculated value, the Expression Calculator opens with buttons and fields that contain all of the elements needed for generating any type of WebFOCUS expression.
The expression calculator is used for defining virtual fields (DEFINE) and creating calculated summary values (COMPUTE).
To open the Expression Calculator, right-click a field, point to New Expression, and click Advanced Expression on the context menu. The Expression Calculator is shown in the following image.
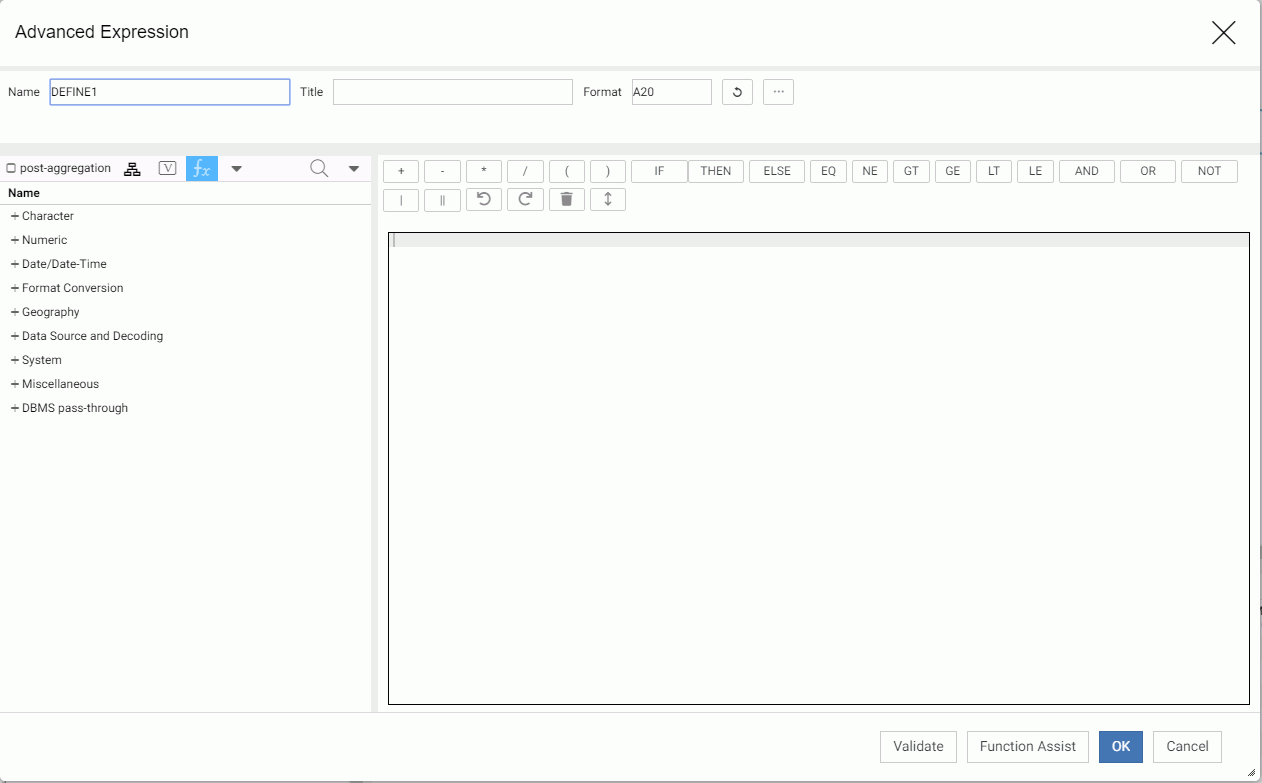
Top Pane Options
Enter a name for the virtual field or calculated value in the Name text box, or accept the default.
Add a title in the Title text box or leave the field blank. The title will be used as the column heading on reports, if you enter one. If you do not, the field name will be used.
Enter a format in the Format text box, accept the default (A20), click Refresh to recalculate the format, or click the ellipsis (...) to open the Properties dialog box.
You must make sure the format supports the expression you will be creating.
The Properties dialog box is shown in the following image, with Numeric selected from the Type drop-down list.
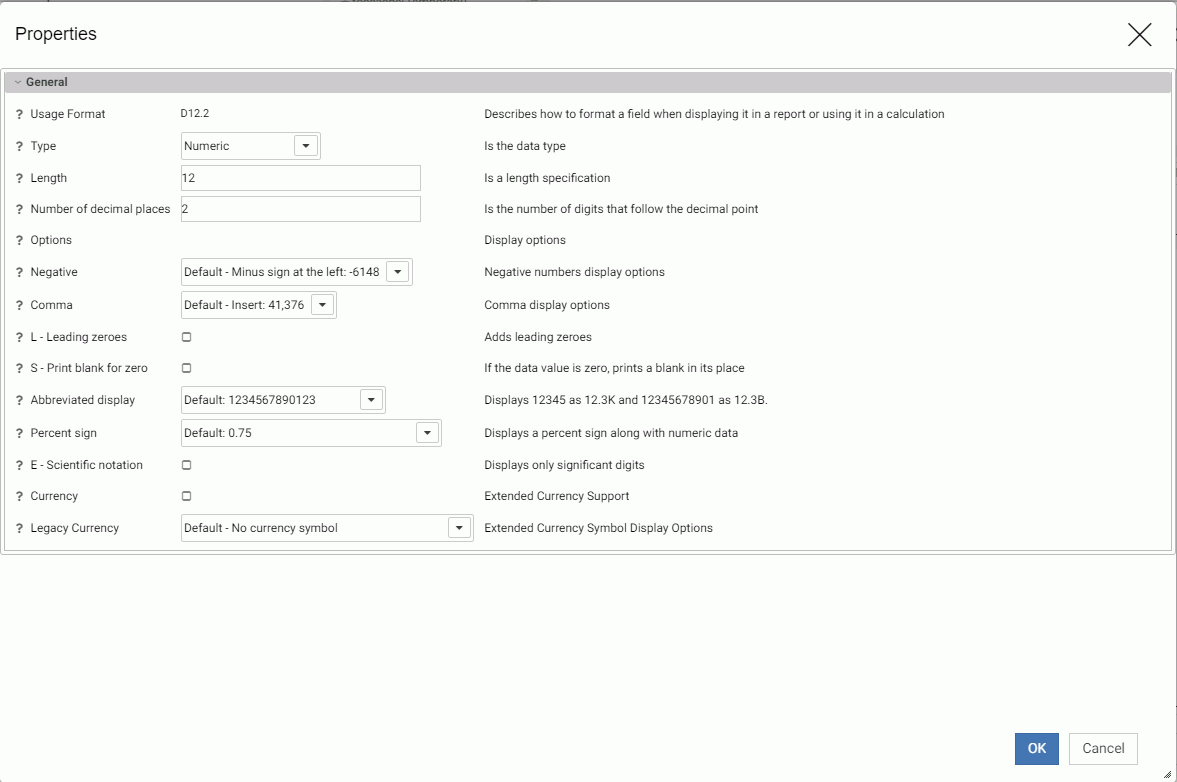
The following is the list of data types.
|
Data Type |
Default Usage Format |
|---|---|
|
Character |
A20V |
|
Integer |
I4 |
|
Numeric |
D12.2 |
|
Date |
YYMD (order of components depends on the Locale settings) |
|
Date and Time |
HYYMDS (order of components depends on the Locale settings) |
|
Character (Fixed) |
A20 |
|
Text |
TX256 |
|
Decimal |
P8.2 |
|
Time |
HHIS |
|
Hexadecimal |
U20 |
|
Binary Large Object |
BLOB |
The display options applicable to the selected data type display. As you select options, the Usage format at the top of the window changes to show the selected options. For more information, see the Describing Data With WebFOCUS Language manual.
View Options
The left pane of the Expression Calculator provides the following options.
- List of functions. The function categories that display initially are the recommended categories.
- post-aggregation. Clicking the post-aggregation check box adds function categories that can be applied to fields after they have been aggregated. This also changes the calculation from a DEFINE to a COMPUTE.
- Columns ordered by folders. Displays fields, filters, and variables in the Business View instead of a list of functions.
- Amper variables from metadata. Displays the list of global variables referenced in the synonym.
- Categorized list of functions. This is the initial view. You can return to this view with this button.
- Advanced Options. Provides additional view options:
- When the view is Categorized list of functions., enables you to select User Functions, which displays the list of applications in your APPPATH so you can navigate to your own functions, Show legacy functions, to add legacy functions to the display, or Hide function titles to display function names without descriptive text. If you select Show legacy functions, that option changes to Hide legacy functions. If you select Hide function titles, that option changes to Show function titles.
Note: To be recognized as a procedure that contains user functions, any .fex file that contains user functions (DEFINE FUNCTIONs) must have the following syntax at the beginning.
-*DM_JOB_TYPE=512
- When the view is Columns ordered by folders, enables you to change to Tables/Columns, which displays the physical view of the synonym instead of the Business View, or User Functions, which displays the list of applications in your APPPATH so you can navigate to your own functions.
- When the view is Categorized list of functions., enables you to select User Functions, which displays the list of applications in your APPPATH so you can navigate to your own functions, Show legacy functions, to add legacy functions to the display, or Hide function titles to display function names without descriptive text. If you select Show legacy functions, that option changes to Hide legacy functions. If you select Hide function titles, that option changes to Show function titles.
Expression Pane Options
In the Expression pane, you can enter an expression in the text box or double-click fields from the metadata pane and use the calculator buttons to create the expression. For more information about expressions and operators, see the Creating Reports With WebFOCUS Language manual. The buttons are:
- Relational Operators.
- LT (Less than). Is true if the expression on the left evaluates to be less than the expression on the right.
- EQ (Equal to). Is true if the expression on the left evaluates to be equal to the expression on the right.
- GT (Greater than). Is true if the expression on the left evaluates to be greater than the expression on the right.
- LE (Less than or equal to). Is true if the expression on the left evaluates to be less than or equal to the expression on the right.
- NE (Not equal to). Is true if the expression on the left evaluates to be not equal to the expression on the right.
- GE (Greater than or equal to). Is true if the expression on the left evaluates to be greater than or equal to the expression on the right.
- Conditional Operators.
- IF (specifies the condition to be tested).
- THEN (specifies the result if the condition is true).
- ELSE (specifies the result if the condition is false).
- Logical Operators.
- AND (is true if both expressions are true).
- OR (is true if at least one of the expressions is true).
- NOT (is true if the expression is false).
- Alphanumeric Operators.
- | (weak concatenation).
- || (strong concatenation, remove trailing blanks).
- Arithmetic Operators.
- ** (raise to a power).
- + (plus). Add the numbers on either side of the + sign.
- - (minus). Subtract the number on the right of the minus sign from the number on the left.
- * (multiplication). Multiply the number on the left by the number on the right.
- / (division). Divide the number on the left by the number on the right.
- Undo.
Undoes successive actions.
- Redo.
Redoes successive actions.
- Clear all (trash can).
Clears the expression.
- Show buttons at bottom (double up and down arrow).
Moves the buttons to the bottom of the pane, and changes to Show buttons on top.
- Other Buttons.
- Validate checks if the expression entered is valid.
- Function Assist helps you apply a function to an expression. First you must change the view in the metadata pane to show the list of functions and select a function. Clicking Function Assist will open a dialog box that describes what the function does and lets you select fields for the parameters from the metadata. Function Assist opens automatically if you double-click a function name. You can click the Example button to see an example of the function syntax. Click OK to add the function to the expression or Cancel to cancel.
When you have finished creating the expression, click OK to add the virtual field or calculated value to the metadata.
Adding a Global Variable to a Synonym
You can define global variables in a Master File, filter, or expression and use them to parameterize certain attributes in the Master File and its corresponding Access File. You can also add certain system variables to a synonym.
To insert a global variable:
- In the Table/Column frame, right-click the synonym name and click New Variable on the context menu.
The Properties window opens, as shown in the following image.
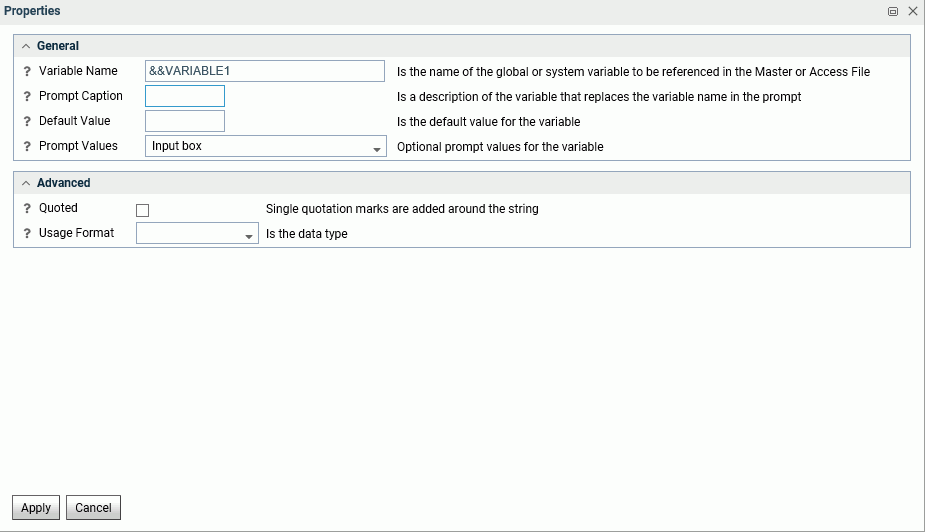
- Enter a name for the variable or accept the default.
- Enter a prompt caption, if needed, for describing what type of value to enter when prompted for the value.
- Enter a default value, if there is one.
- Select the type of value container to show, when a request is run.
You can select from the following General options:
- Input box. The user must enter a value.
- Static list of values. The user must select from a predefined list of values. If you select this option, additional input fields appear in which
you list the static values and select whether the user can select a single value or multiple values.
Enter a list of values enclosed in single quotation marks and separated by the logical operator OR.
- Static list of values/captions. The user must select from a predefined list of values. If you select this option, additional input fields appear in which
you list the static values and the captions that should display instead of the actual values, and select whether the user
can select a single value or multiple values.
Enter a list of pairs, each pair containing the actual value and the caption to appear separated by commas. The list must be enclosed in parentheses. Each entry must be enclosed in single quotation marks and each pair must separated by commas.
- Synonym based dynamic list of values. The user must select from a list of values that is generated dynamically by looking up field values in a lookup synonym. If you select this option, additional fields appear for entering or selecting the lookup synonym, the lookup field, the display field for the caption to appear, and whether the user can select only a single value or multiple values.
- Procedure based dynamic list of values. The user must select from a list of values that is generated dynamically by running a procedure that retrieves the lookup field values and display field values. If you select this option, additional fields appear for entering or selecting the lookup procedure, any parameters required for running the procedure, the lookup field, the display field for the caption to appear, and whether the user can select only a single value or multiple values.
You can also enter or select the following Advanced properties for the variable.
- Whether to add single quotation marks around strings.
- The data type.
- The length of the variable, if you select a data type.
- Click Apply to save these properties or Cancel to cancel.
Creating a Join
|
Topics: |
A join describes a relationship between multiple synonyms based on a condition. The condition may be equality between fields in the synonyms or the result of an expression that relates fields in the synonyms. For more information about joins in a synonym, see the Describing Data With WebFOCUS Language manual.
To create a new cluster synonym, from the Applications page either right-click an application, point to New, and click Cluster Business View, or click New on the ribbon, then Cluster Business View. To edit an existing join, open an existing synonym in Data Assist.
The Join Editor opens in a frame, by default, as shown in the following image for an existing synonym..
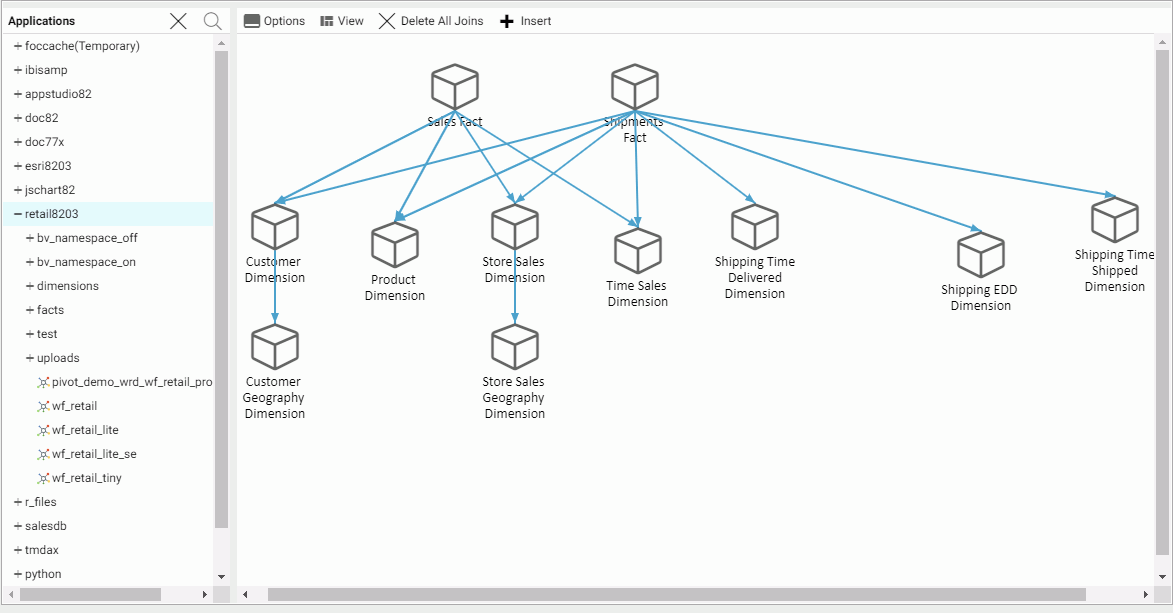
If you are creating a new cluster synonym, you can double-click or drag synonyms from the Data frame tree into the Join Editor.
You can also make the following edits from the Join Editor menu bar:
- Options
-
Sets the following join defaults.
- Insert child segment with snowflakes. The default is No, to insert only the segment selected.
- Display full component names. The default is Yes.
Click OK to save your defaults.
- View
-
The View options for Data Steward Mode are:
- Collapse All. Collapses all of the synonyms so that the fields do not show.
- Expand Referenced. Expands the referenced synonym icons to show four fields.
- Expand All. Expands all of the synonym icons to show four fields.
- Set to Standard Size. Shows four fields at a time.
- Expand to Full Size. Expands the synonym boxes to full size.
- Expand to Custom Size. Options are Height Standard, Height Full, Width Standard, Width Full.
- Auto Arrange. Automatically arranges the synonyms.
The View options for Analyst Mode are:
- Layout. Click Vertically spread out (the default), Vertically Compressed, Vertically Compressed with long H-Space, and Default.
- Auto Arrange. Automatically arranges the synonyms and joins.
- Mode
-
Displays the joins in either Data Steward Mode (the default) or Analyst Mode. In Analyst mode, the synonyms are represented by an icon, and each join is represented by a container that displays the type of join. In Data Steward mode, each synonym is represented by a cube that you can double-click or set the View option to Expand All in order to display field names, and each join is represented by a vector between the joined synonyms.
- Delete All Joins
-
Deletes all joins.
- Insert
-
You can insert a child or a root in Data Steward mode. You can add a join in Analyst mode (provides the same options as Insert Child in Data Steward mode).
- Insert Child. The Insert Child dialog box opens, as shown in the following image.
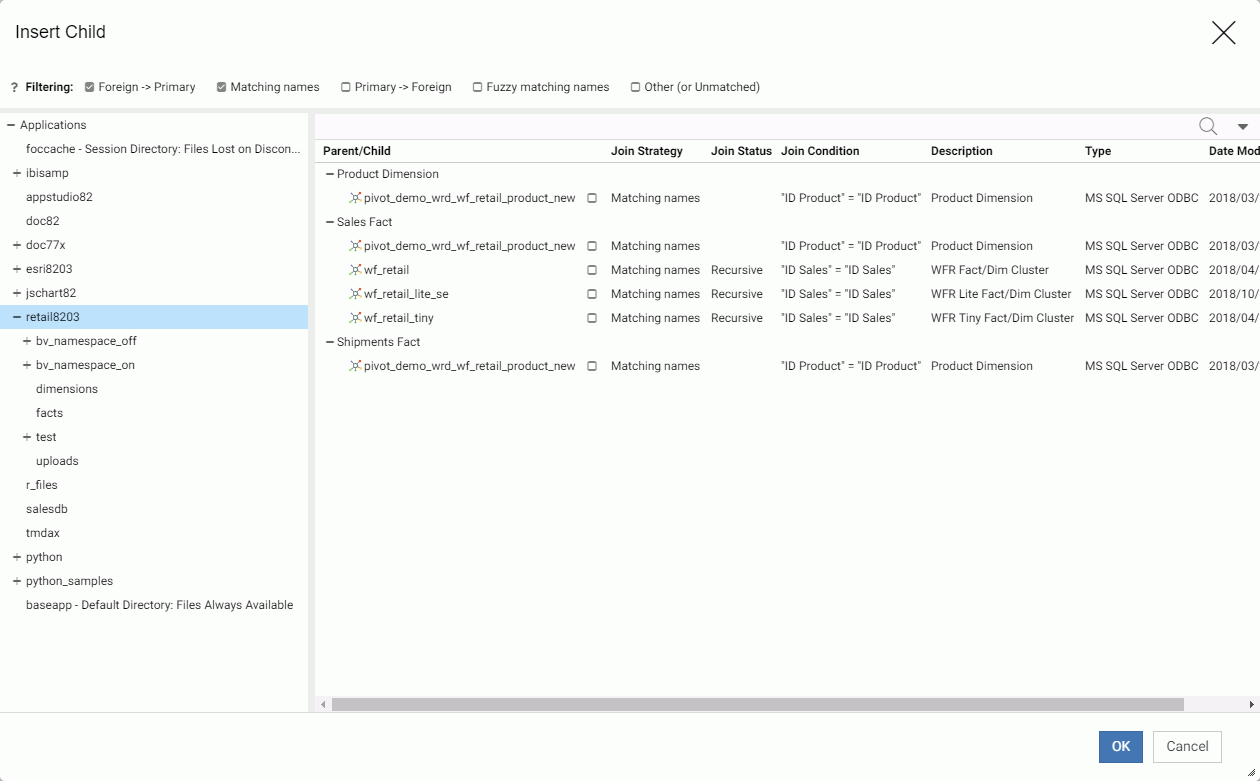
Select a synonym to insert as a child by selecting the check box to the right of the synonym name.
Use the Filtering check boxes to help with selection. You can filter the synonym selections using one or more of the following filtering options:
- Foreign to primary key matches.
- Matching names.
- Primary to foreign key matches.
- Fuzzy matching names (not exact matches).
- Other (or unmatched).
The View menu enables you to view the synonyms as icons or view the details. You can also use it to choose columns and reset the view to the default view.
The Find icon (magnifying glass) opens a search box.
Click OK when you are finished.
- Insert Root The Insert Root dialog box opens, as shown in the following image.

Select a synonym to insert as a root by selecting the check box to the right of the synonym name in the More pane.
Use the Filtering menu select one of the following filtering options:
- All tables.
- Tables with foreign keys.
Click OK when you are finished.
- Insert Child. The Insert Child dialog box opens, as shown in the following image.
You can edit the join by right-clicking a synonym icon or connector line.
Editing a Join by Right-Clicking a Synonym Icon
From a synonym icon, select from the following options.
- Manage Parent Links. Only available in Data Steward mode for a child synonym. Will say Edit Parent Link if there is only one parent. Opens a dialog box for selecting a parent synonym. Right-clicking a parent and clicking Manage opens the Edit Parent Link dialog box for selecting new join fields and changing the join type and condition.
For more information about editing a parent link, see Editing a Parent Link.
- Insert Child. Opens the Insert Child dialog box. Not available in Analyst mode.
- Add/Remove Parent Links. Opens the Add/Remove Parent Links dialog box. You can check and uncheck synonyms to add or remove parent links. Not available in Analyst mode.
- Sample Data. Generates sample data.
- Sample Data with parent key. Generates sample data that includes the key from the parent synonym.
- Data Profiling (Custom). Choose from Statistics, Key Analysis (Data Steward mode only), and Count.
- Delete. Deletes the join.
Editing a Join by Right-Clicking a Connector Line
From a connector line, click one of the following options:
- Edit Parent Link. Opens the Edit Parent Link dialog box for editing the join. In Analyst mode, is available as Edit Link when right-clicking
a join icon.
For more information about editing a parent link, see Editing a Parent Link.
- Join Multiple. Makes the join a one-to-many join.
- Join Unique. Makes the join a one-to-one join.
- Inner Join. Makes the join an inner join.
- Left Outer Join. Makes the join a left outer join.
- Right Outer Join. Makes the join a right outer join.
- Full Outer Join. Makes the join a full outer join.
- Delete Link. Deletes the join.
- Data Profiling (custom). Produces data profiling reports.
- Sample Data with parent key. Produces sample data.
Editing a Parent Link
The Edit Parent Link dialog box in the Web Console is shown in the following image.
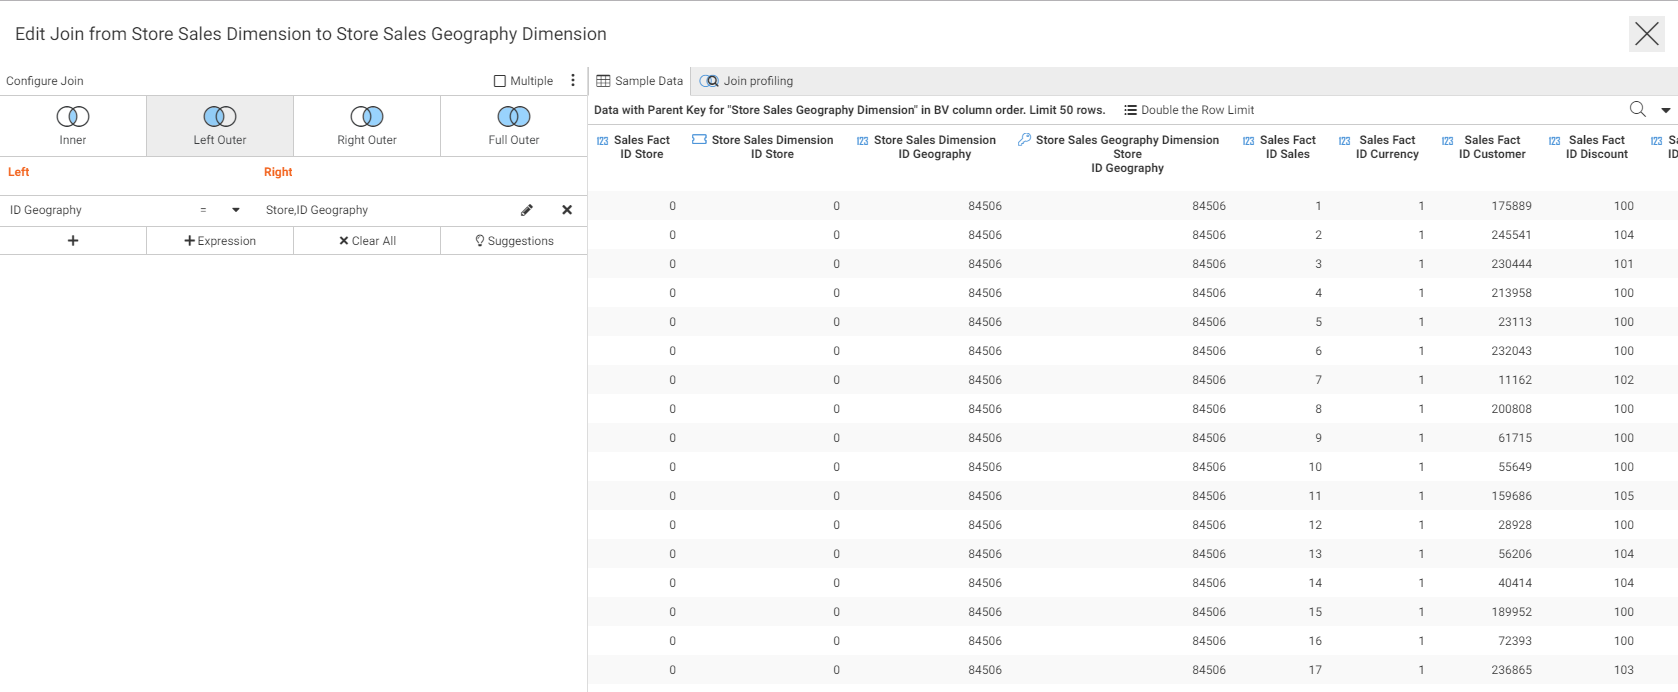
The left frame displays the join conditions and editing options. The right pane has tabs for sample data reports and join profiling reports and charts.
Configure Join Options.
Click Join Type to select one of the following join types:
- Inner Join. Selects only those records that have values that satisfy the join condition in both synonyms.
- Left Outer Join. Selects all records from the host synonym. Where there is no record that satisfies the join condition in the target file, default values are substituted.
- Right Outer Join. Selects all records from the target synonym. Where there is no record that satisfies the join condition in the host file, default values are substituted.
- Full Outer Join. Selects all records from the host and target synonyms. Where there is no record that satisfies the join condition in the host or target file, default values are substituted.
Click Multiple. to make the join a one-to-many join.
In the DMC, you can also click the Add New Row button ( ) to add a new row in the Join Condition section of the editor and add a new expression to the join condition.
The View menu provides the following options.
- Show title (the default).
- Show name.
- Show source name.
- Show sample values.
Click the host or target field to select a different field. Click the pencil icon to open a double list for selecting both.
Click the down arrow next to the relation to change the relational operator.
Click the plus sign (+) under the host field to add a new join condition.
Click Expression to add an expression using the Expression Calculator.
Click Clear All to clear all conditions.
Click Suggestions to open a pane with potential join conditions. Clicking the plus sign (+) next to a condition adds it to the join. Clicking Suggestions again closes the pane.
Click Clear All (X) to remove all of the join conditions.
On the Sample Data tab:
- Click Find to open a search box.
- Click View to choose columns or set the view back to the default.
Adding Data Source Security (DBA)
The DBA facility lets you define restrictions and access rights for users.
Adding DBA Security
- Click DBA on the Advanced Options menu of the ribbon.
The DBA window opens, as shown in the following image.
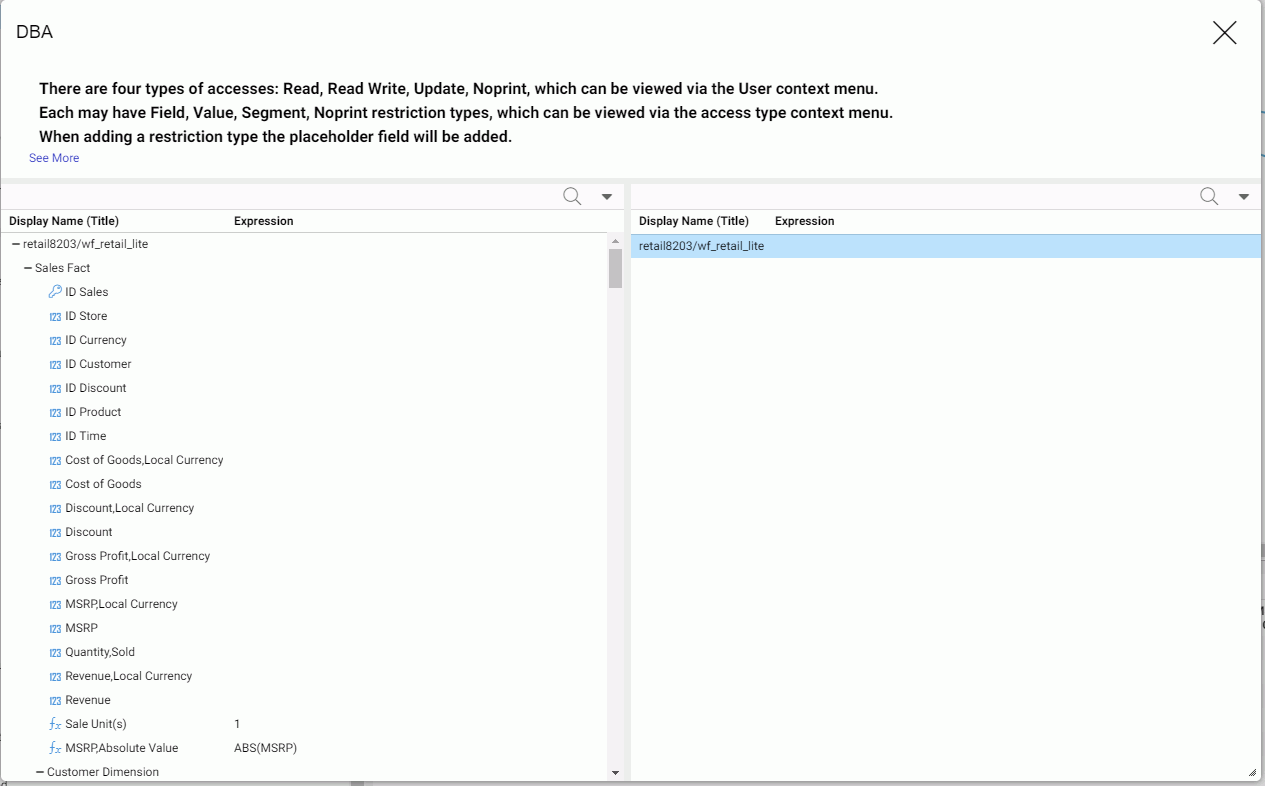
- In the right pane, right-click the synonym name, point to Insert, and click DBA.
- The top node, named DBA1 by default, is the password for the Database Administrator (DBA). The DBA has complete access, so no access rights need to be defined.
- The next node, named USER0001 by default, represents a user password. By default, the user is given read access to the data source.
You can rename the passwords and add and change access rights using right-click options. You can undo actions using the Undo link on the menu bar. Once you have created DBA attributes, you can delete the DBA section of the Master File by Clicking Remove DBA on the menu bar.
- To change a password, right-click a user and click Rename.
A Rename dialog box opens.
Enter the new password and click OK.
- To add a user, right-click the DBA password, point to Insert, and select User.
A new user node is added to the DBA Statements pane.
- To add an access right to a user password, right-click a user password, point to Insert, and click one of the following:
- Read Access. This allows the user to only read the data source.
- Write Access. This allows the user to only write new segment instances to the data source.
- Read/Write Access. This allows the user to both read from and write to the data source.
- Update Access. This allows the user to only update records in the data source.
The access right is added under the user password. You can then restrict those rights to specific segments, fields, or field values.
- You can further restrict the access rights of a user based on segment names, field names, and field values.
- Field Restriction. To prevent access rights to a field, do the following:
- Right-click an access right under the user you want to restrict, point to Insert, and select Field Restriction as shown in the following image.
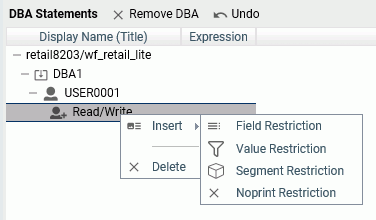
A field restriction placeholder is added under the access right.
- Drag a field to the placeholder.
The placeholder is replaced by the field.
- To restrict access to additional fields, repeat these steps for each additional field.
- Right-click an access right under the user you want to restrict, point to Insert, and select Field Restriction as shown in the following image.
- Value Restriction. To prevent access rights to specific field values, create a filter.
- Right-click an access right under the user you want to restrict, point to Insert, and select Value Restriction.
A value restriction placeholder is added under the access right.
- Drag a field to the placeholder.
The placeholder is replaced by the field, with a default expression. A Restrictions dialog box opens for you to create the expression that will identify the restricted values, as shown in the following image.
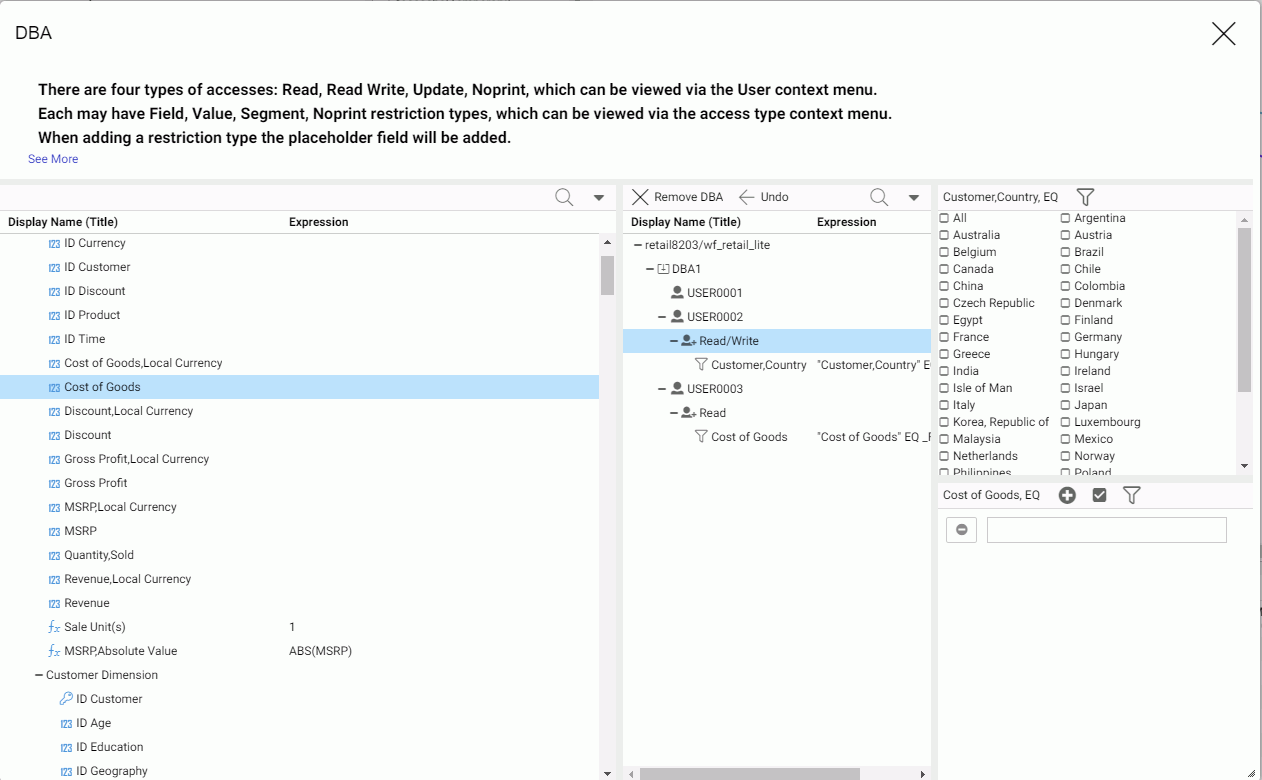
For a non-integer numeric field, a text box opens in which you can enter values. Using the menu on the top right of the Restrictions pane, you can change the display to a slider or a check list. For alphanumeric or integer fields, the default display is the check list. You can multi-select values for the EQ and NE relations. If your display option is a text box, you can click the Add Value (+) button on the menu bar to add another text box. To delete a value, click the Delete Value (-) button on the left of the text box that contains the value you want to delete.
By default, the EQ (equal to) relation is used, so the restriction is in effect for field values equal to the values you enter or select. To change the relation, point to Relation on the menu and select one of the following relational operators.
- EQ. Equal to. The restriction is in effect for field values equal to any of the values specified in the restriction expression.
- NE. Not equal to. The restriction is in effect for field values not equal to any of the values specified in the restriction expression.
- LT. Less than. The restriction is in effect for field values less than the value specified in the restriction expression.
- GT. Less than. The restriction is in effect for field values greater than the value specified in the restriction expression.
- LE. Less than or equal to. The restriction is in effect for field values less than or equal to the value specified in the restriction expression.
- GE. Less than. The restriction is in effect for field values greater than or equal to the value specified in the restriction expression.
- Range. From-to. The restriction is in effect for field values greater than or equal to the first value in the range and less than or equal to the second value in the range.
Once you have created an expression, additional options become available on the menu bar. You can update the expression using the Apply button.
- Right-click an access right under the user you want to restrict, point to Insert, and select Value Restriction.
- Segment Restriction. To prevent access to one or more segments, do the following:
- Right-click an access right under the user you want to restrict, point to Insert, and select Segment Restriction.
A segment restriction placeholder is added under the access right.
- Drag a segment to the placeholder.
The placeholder is replaced by the segment.
- To restrict access to additional segments, repeat these steps for each additional segment.
- Right-click an access right under the user you want to restrict, point to Insert, and select Segment Restriction.
- Noprint Restriction. To let the user access a field or segment for retrieval but not display its value on output, do the following:
- Right-click an access right under the user you want to restrict, point to Insert, and select Noprint Restriction.
A Noprint restriction placeholder is added under the access right.
- Drag a field to the placeholder.
The placeholder is replaced by the field.
- To restrict print access to additional fields, repeat these steps for each additional field.
- Right-click an access right under the user you want to restrict, point to Insert, and select Noprint Restriction.
- Field Restriction. To prevent access rights to a field, do the following:
- When you are finished adding restrictions to the synonym, close the DBA window and save the synonym.
In order to access the synonym, a user must issue a SET PASS command and enter one of the user passwords. This command can be issued in any supported profile or in a procedure.
Pivoting Columns
You can pivot columns that represent identical data or groups of such columns to display them as rows. This is useful when you want to access their values as one field. For example, if a spreadsheet has a column for each year, you may want to create a row containing all of the years for reporting.
How to Pivot Columns
The spreadsheet pivot_demo.xlsx is created as part of the WebFOCUS Retail tutorial and can be uploaded to demonstrate this feature.
- Right-click the first column in the range you want to pivot, point to Pivot on the context menu, and click Multiple columns to rows.
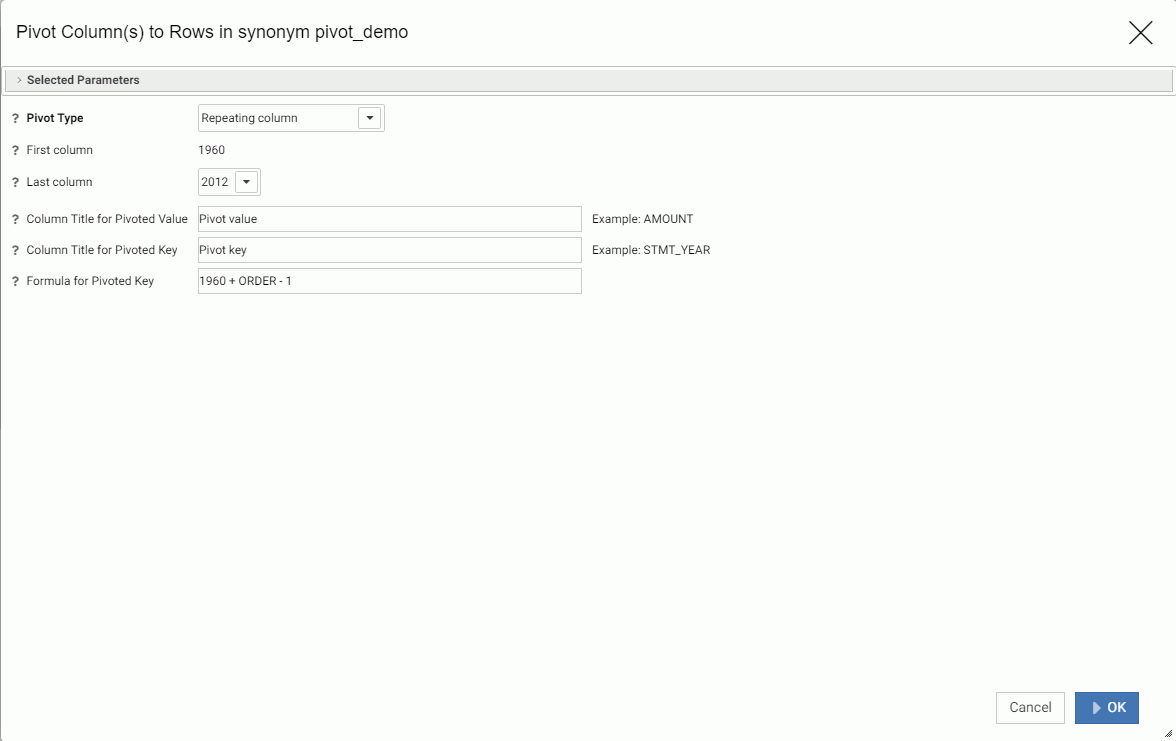
The Pivot dialog box opens, as shown in the following image.
- Enter or select the following values.
- Pivot Type. Select Repeating column or Repeating group of columns.
If you select Repeating group of columns, some of the information you need to enter changes.
- Number of groups. This is the number of groups of columns for repeating groups of columns. For example, if an Excel spreadsheet has data that includes two columns of consecutive data for Plan and Actual figures for six years, this number would be 6.
- First Column. This is the first column in a group of repeating columns.
- Last Column. This is the last column in a group of repeating columns.
- First column in group. Is the name of the first column in a group. For example, if an Excel spreadsheet has groups of data consisting of two columns called year_plan and year_actual, the first year_plan of the first group would be selected for First column in group.
- Last column in group. Is the name of the last column in a group. For example, if an Excel spreadsheet has groups of data consisting of two columns called year_plan and year_actual, the first year_actual of the first group would be selected for Last column in group.
- Column Titles for Pivoted Value. This is the name for the new column containing the data values. the default is Pivot value. For groups, separate the titles for the columns in the groups with slashes (/).
- Column Title for Pivoted Key. This is the name of the new column that identifies the values in the data column. If the source is a spreadsheet this would be the name that could apply to the column headers. The default is Pivot key.
- Formula for Pivoted Key. This is automatically calculated based on the values selected for First column/Last column or First column in group/Last column in group.
- Pivot Type. Select Repeating column or Repeating group of columns.
- Click OK.
The data is pivoted using an occurs attribute. The following image shows the synonym and its output pane after pivoting the years from 1960 to 2012.
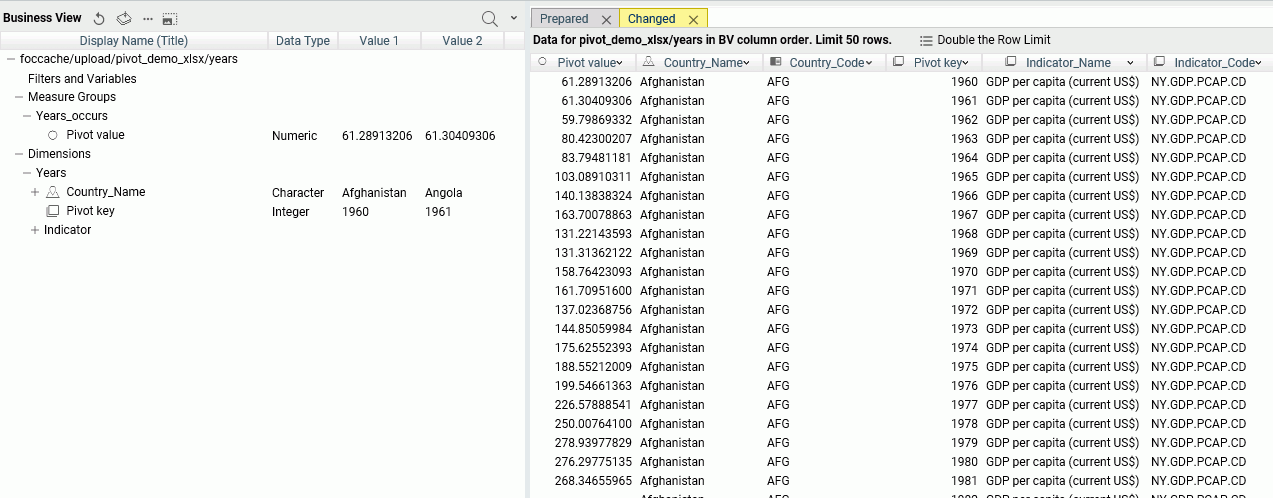
In the original synonym, each year was a column, but in the pivoted synonym, each year is a row.
Other Synonym Enhancements
Data Assist is an environment for managing and editing Synonyms. The number and types of changes you can make to synonyms has been greatly expanded.
Reference: Right-Click Options for Fields in the Table/Column, Business View, and Output Panes
You can rename a field by right-clicking the field and clicking Rename on the context menu. In the Business View frame, you can assign a DV role by right-clicking a field, pointing to DV Role, and clicking a role. Also in the Business View frame, you can right-click a field, point to Manage Folders, and click New Folder or Create Parent Folder.
You can also right-click a field to insert one of the following.
New Filter
You can open the Filters/Groups pane to create a filter for the field that will select only values satisfying the filter expression. For more information, see Filters/Groups Pane.
New Expression
- Apply Function. The types of functions available depends on the data type of the field. For more information about individual functions,
see the Using Functions manual or generate a Function Parameters report from the FOCUS SETs and Info item on the Workspace page of the Web Console.
The Apply a Function dialog box opens, as shown in the following image.

The recommended categories of functions display in the left frame. By default, these are functions that apply to the selected field and you can use in a DEFINE virtual field. You can control which categories of functions are displayed using the post-aggregation check box to show functions that are applied after aggregation is performed. This will create a COMPUTE calculated value. The Advanced options menu (down arrow) also affects the categories of functions displayed. You can click the following options:
- Show legacy functions. Adds legacy functions for the recommended categories to the left frame. If you click this option, the list item changes to Hide legacy functions.
- Show regardless of format compatibility. Adds function categories that are not compatible with the format of the selected field. If you click this option, the list item changes to Respect field type.
- Hide function titles. Shows only the function names on the list, not descriptive titles. If you click this option, the list item changes to Show function titles.
Click the function you want to apply. A dialog box opens in the right frame for entering or selecting function properties and parameters, as shown in the following image.
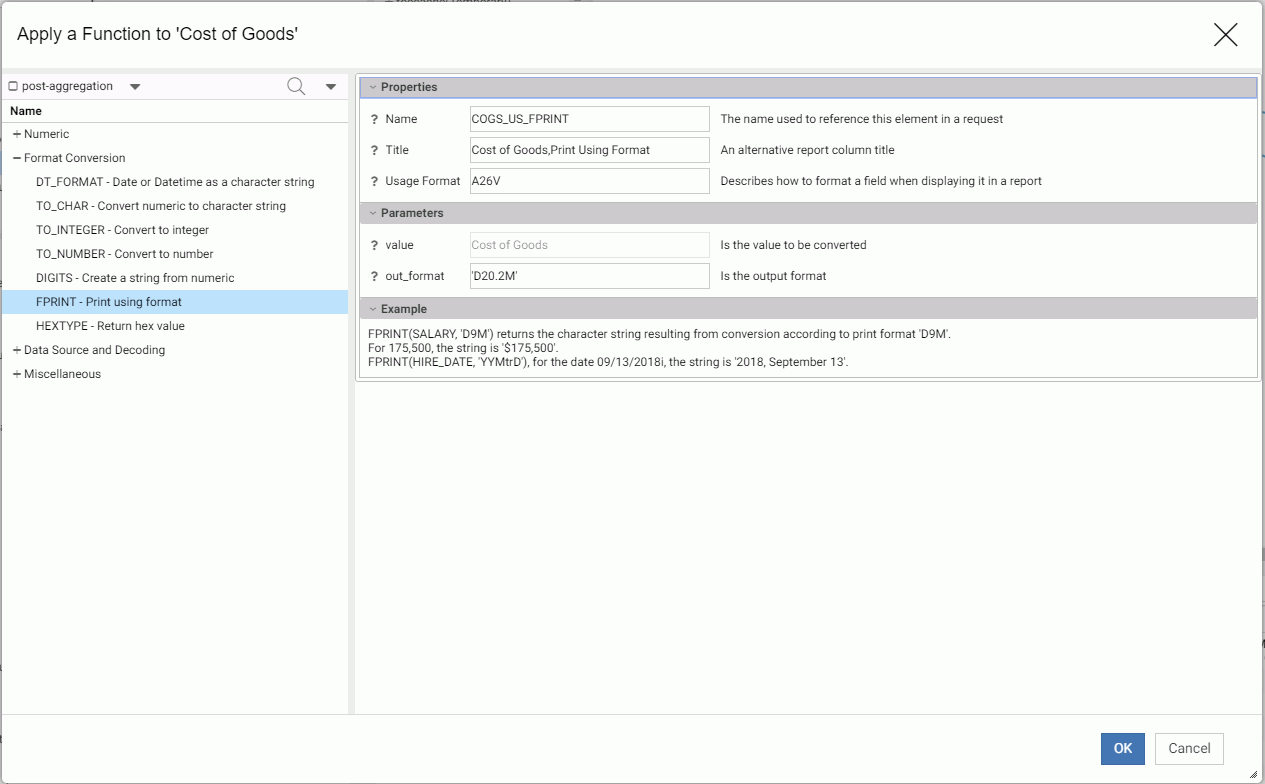
When you have entered the required information, click OK. The virtual field is added to the synonym.
Advanced Expression. Opens the expression calculator, described in Using the Expression Calculator.
- Group and Replace. Opens the Filters/Groups pane so that you can categorize the field values into groups for sorting. It creates a new virtual
field using a conditional expression.
For more information about the Filters/Groups pane, see Filters/Groups Pane.
To open the Filters/Groups pane to edit the grouping, you can right-click the virtual field and select Edit.
To open the expression calculator for more advanced editing, right-click the virtual field and select Edit (Advanced).
- Phonetic Grouping. This option is available for grouping alphanumeric fields based on one of two methods for encoding names based on pronunciation,
Soundex or Metaphone. Soundex calculates a code for alphanumeric values so that if they sound the same but are spelled differently,
they will still have the same code. Metaphone is an improved version of Soundex that takes into account anomalies in English
spelling and pronunciation.
During upload, this option can correct spelling inconsistencies before actually uploading the data.
For example, upload the file sales_orders_misspelled_cities.csv that is in the Uploads folder of the WebFOCUS Retail application.
Right-click the City field in the Geography dimension, point to New Expression, then Groups, and click Phonetic Grouping. The group will initially open in the Filters/Groups pane with the data values grouped based on the default phonetic algorithm for your operating environment, as shown in the following image.
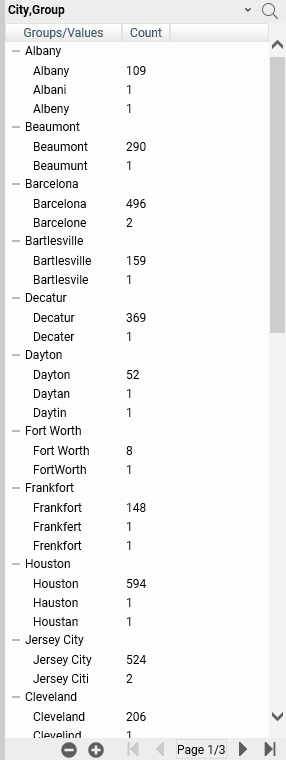
Each group contains different spellings of city names that would be pronounced the same way based on the phonetic algorithm used. If you do not agree with a grouping, you can edit it. Any data value that could not be placed in a group based on the phonetic algorithm is placed in a group called (Ungrouped Values). You can move those values into another group, if necessary.
A virtual field is created with an expression that causes all of the values within each group to be uploaded with the correct spelling, as shown in the following image.

You can upload both the CITY and CITY_GROUP fields, or hide the CITY field and rename CITY_GROUP to CITY so that the CITY field has the corrected data values.
The options on the group menu specific to phonetic grouping are:
- Recreate groups by Metaphone.
- Recreate groups by SoundEx.
For information about other options for groups, see Filters/Groups Pane.
- Create Bins. Opens a wizard for dividing the data values in the field into a specified number of bins based on equal intervals, equal
intervals using a formula, or quantiles, as shown in the following image.
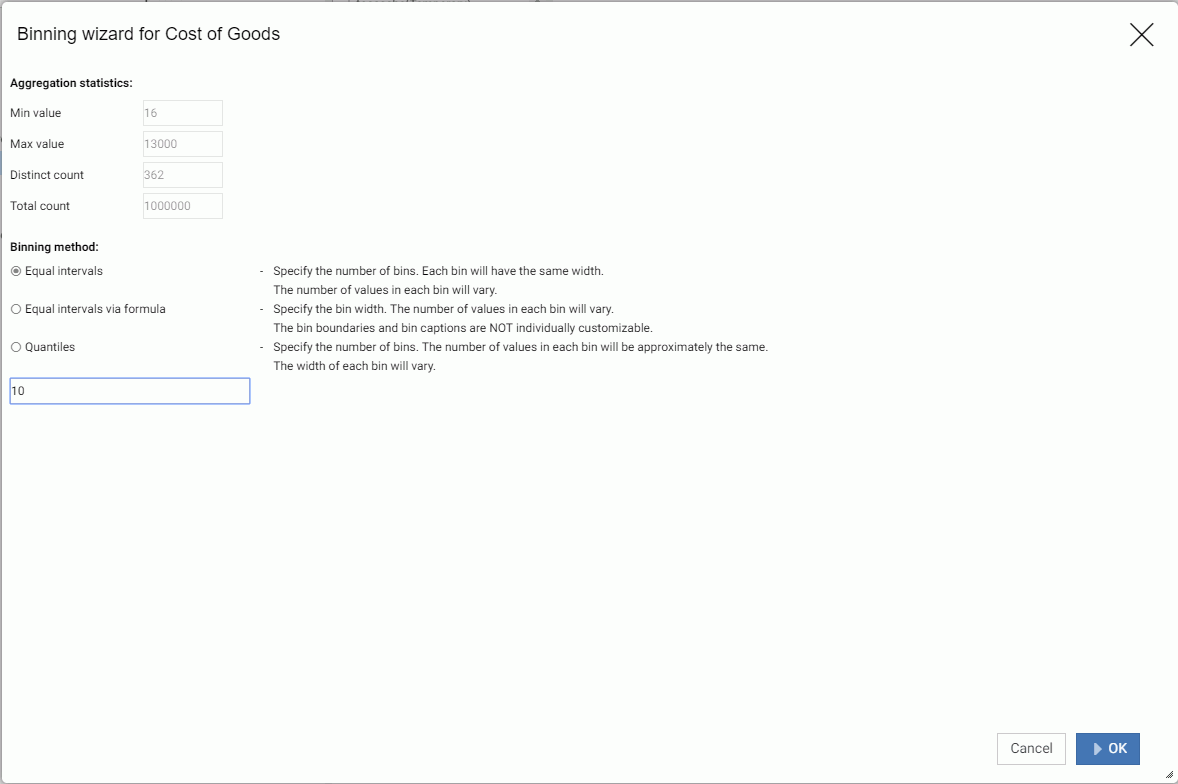
The default number of bins is 10, but you can specify a different number for equal intervals and quantiles. For equal intervals via formula, you specify the bin width.
The virtual fields created using this option can be used for sorting.
The following image shows the binning card for bins based on equal intervals.
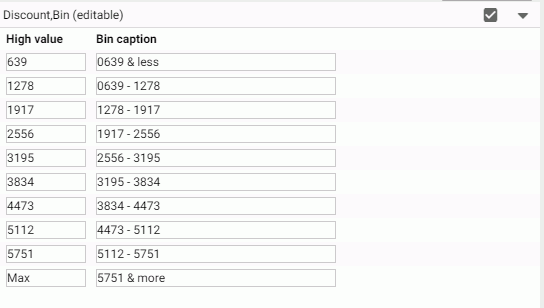
Click Apply (check mark) to apply these bins.
The virtual field is added to the synonym.
The Menu (down arrow) has the following options:
- Add Bin. This option adds another bin (the binning algorithm is recalculated using the new number of bins).
- Reset Bins. This option opens the wizard with the original bin properties. Click OK to reset the bins, or edit the values and click OK.
- Edit properties. Opens a dialog box in which you can edit the field name and field title of the generated virtual field.
- Hide Binning Card. Closes the binning frame.
Geographic Role
You can right-click a field and assign it a geographic role, or change its geographic role assignment if it already has one, as shown in the following image.
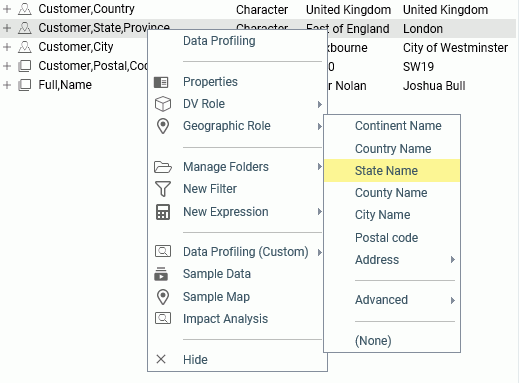
To remove a geographic role, select (None).
For a field that has a geographic role assigned, you can generate a sample map by right-clicking the field and clicking Sample Map from the context menu. A sample map is shown in the following image.
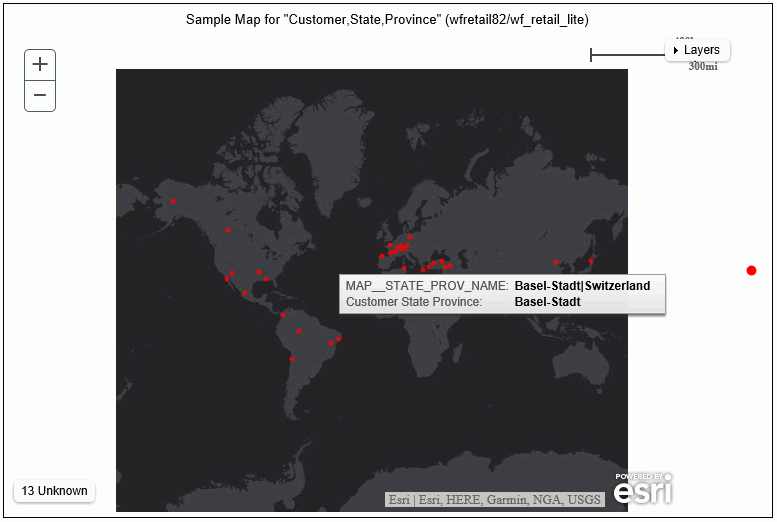
Sample Data
You can right-click a field and select Sample Data to generate sample data for that field, as shown in the following image.
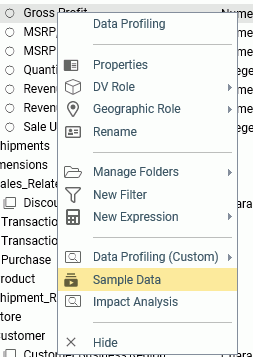
Partial Output is shown in the following image.
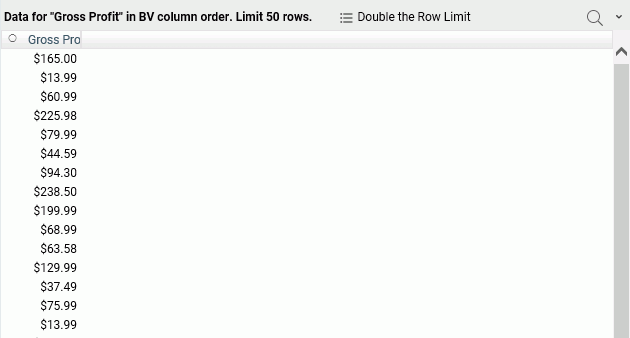
Data Profiling (Combo) and Data Profiling (Custom)
Data profiling provides reports and charts analyzing the values in a field or, for some reports, for a segment. For most reports, a View menu on the menu bar of the reports lets you generate a printable view of the report, and a search function lets you search for characters. Right-click a field or segment, point to Data Profiling (Combo) to get counts and a bar chart, or point to Data Profiing (Custom) to select one of the following options.
- Statistics. This report lists counts, percents, limits, distinct values, and information about null values in a field or a segment, as
shown in the following image.

- Key Analysis. This report lists counts and distinct and duplicate counts and percents for a field or a segment, as shown in the following
image.

- Distinct Values. Lists the 50 highest distinct values for numeric fields.
- Distinct Values Chart. Shows a bar chart of distinct values for numeric fields.
- Frequent Values. Lists frequent values for alphanumeric fields.
- Frequent Values Chart. Shows a bar chart of frequent values for numeric fields.
- Frequent Values Pie Chart. Shows a pie chart of frequent values for numeric fields.
- Distribution Chart. Shows a bar chart of counts.
- Duplicate Values. This report lists the values, count of duplicates, and corresponding percent, as shown in the following image.
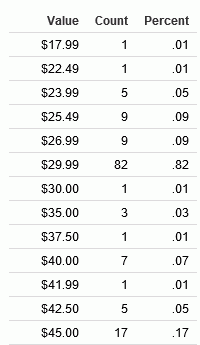
- Patterns. This report shows the patterns of values for alphanumeric fields. The capital A character represents a capital letter, the
lowercase a character represents a lowercase letter, and a 9 character represents a numeric character. Other characters represent
themselves, as shown in the following image for the customer email field.
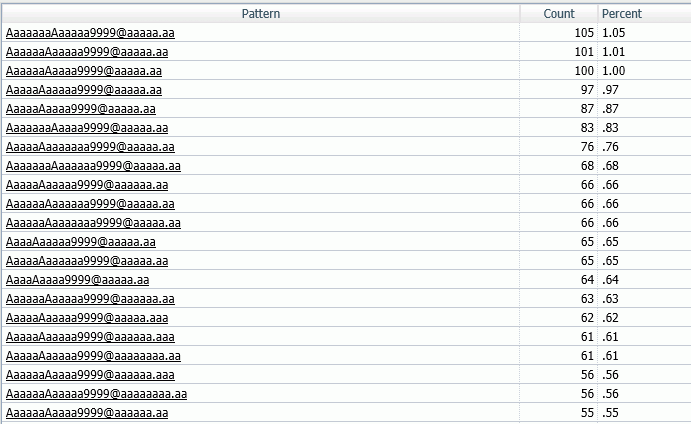
- Hex View. This report lists the values in a field and their corresponding hexadecimal equivalents, as shown in the following image.
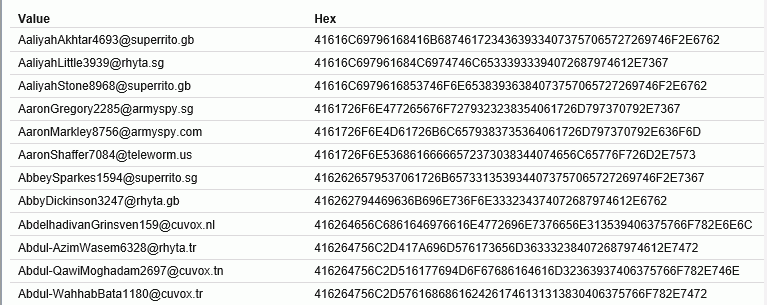
- Duplicate Values. This report lists the values that have multiple instances, the count of instances, and the corresponding percent, as shown
in the following image.
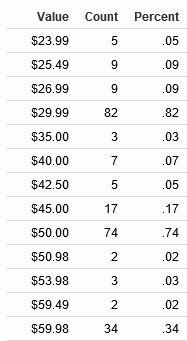
- Outliers. This report shows high and low values with a count of instances that fall outside the bulk of the data for a field, as shown
in the following image.
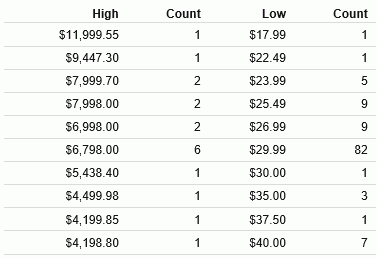
- Forecast chart. Opens a Forecast dialog box for selecting parameters for the FORECAST functions, as shown in the following image.
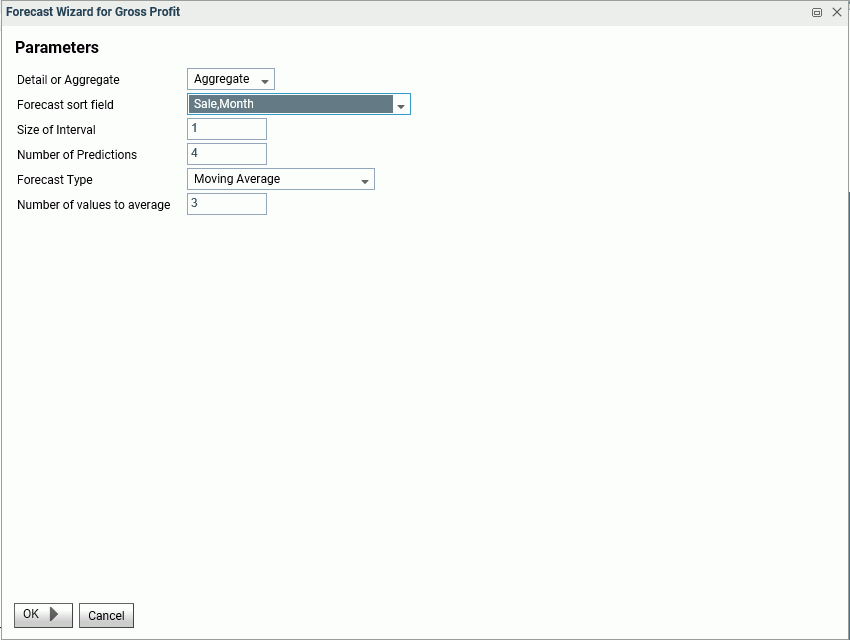
You can choose to see a bar chart of moving averages or linear regression and enter a number of values to predict beyond the end of the data values, as shown in the following image.
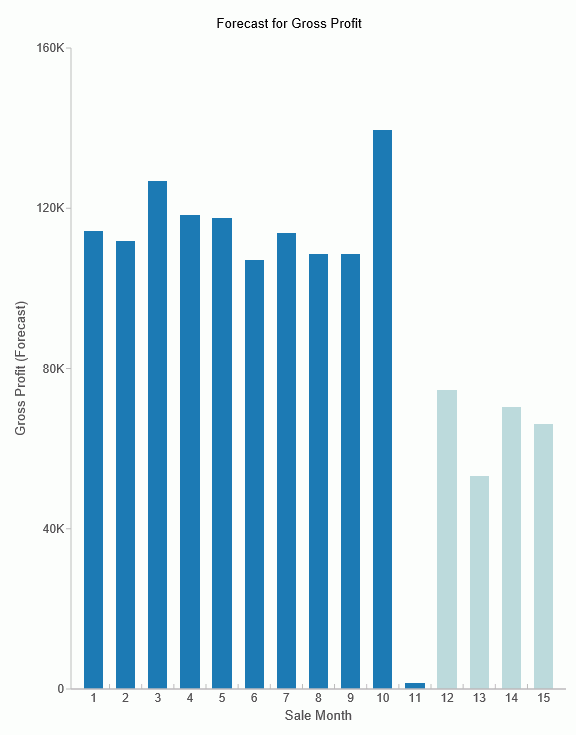
Impact Analysis
Right-click a field and click Impact Analysis to generate a tab in the output frame that shows where and how the field is used, including the application name where the field is referenced, the file and type of file in which it is used, and the type of procedure, context, and line number in which it is found.
| WebFOCUS | |
|
Feedback |