Characteristics of an OLAP Report
An OLAP-enabled report has a number of features that distinguish it from other WebFOCUS reports.
A basic OLAP report is shown in the following image.
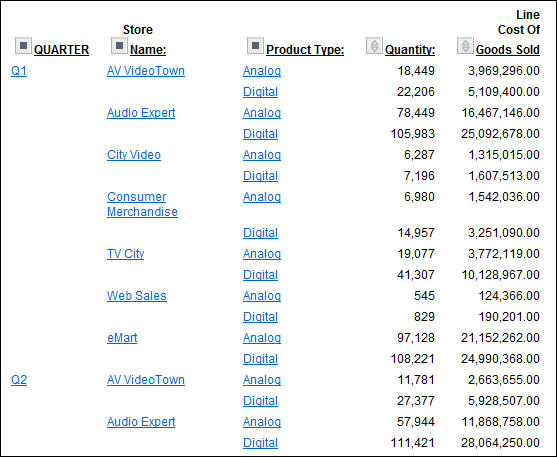
Every OLAP user can take advantage of the analytic features that are built into the OLAP report:
- Hyperlinks. The
values in an OLAP report are usually hyperlinks from which you can
drill down to related information.
Depending on your OLAP settings, the hyperlinks may be active for both the dimension fields (by which the report is sorted) and the measures fields (which display quantitative data), or only for the dimension fields. For related information, see OLAP-Enabling a Report.
- Context menus. You can right-click any column title to access a menu of options that facilitate analysis. The options vary slightly to suit the tasks associated with dimensions and measures.
- Sorting diamonds
 . The
measures (fields that make up the body of the report) have blue
diamonds adjacent to them. You can click the top or bottom of the
diamond to instantly sort data from high to low or low to high.
. The
measures (fields that make up the body of the report) have blue
diamonds adjacent to them. You can click the top or bottom of the
diamond to instantly sort data from high to low or low to high.
- Drag-and-drop capabilities for dimensions and measures.
- You can drag sort fields to shift sorting from vertical (By) to horizontal (Across) or horizontal to vertical.
- You can change the order in which sorting occurs by dragging sort fields from inner to outer positions or outer to inner positions.
- You can drag measures from one position to another to affect the order in which data appears.
Beyond the features in the report itself, your OLAP options depend on the interface and drill-down settings that are in effect for a particular report. Those choices determine whether you have access to the following tools:
- Selections Panel. When
this tool is available, a pane may appear above or below your report,
as shown in the following image. For details, see Selections Panel.
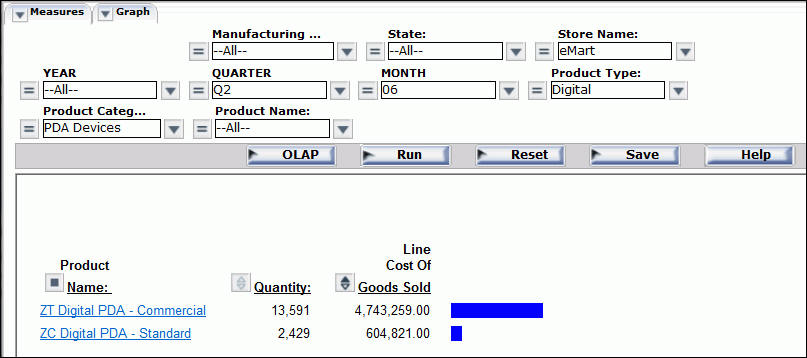
- OLAP Control Panel. When
this tool is available, the square icons
 adjacent
to the sort fields (By or Across) in the report, become active.
You can click a square or the OLAP button
to open the OLAP Control Panel, as shown in the following image.
For details, see OLAP
Control Panel.
adjacent
to the sort fields (By or Across) in the report, become active.
You can click a square or the OLAP button
to open the OLAP Control Panel, as shown in the following image.
For details, see OLAP
Control Panel.
| WebFOCUS | |
|
Feedback |