Three Ways of Working With OLAP Data
|
Topics: |
There are three ways to work with OLAP data, from the report itself, from the Selections panel, and from the OLAP Control Panel. This documentation is organized to help you understand what you can do from each location and which method is most suitable and efficient for your particular OLAP settings.
The Report
You can perform a wide range of basic analytic functions from the report itself. Changes you make in the report are implemented instantly. Every OLAP user can perform these tasks:
- Sort the data in measures in either ascending (lowest value to highest) or descending order (highest value to lowest).
- Drill down on measures, dimensions, or both.
- Hide fields in the current report.
- View hidden fields in the dimensions hierarchy and add them to the report.
- Change a vertical (By) sort field to a horizontal (Across) sort field and vice versa.
- Delete sort fields.
- Add a column of small bar graphs that help you visualize trends in numeric data (measures).
- Display a graphical representation of your data in a frame above the tabular report.
For an illustration of report-powered OLAP analysis, see We Do It Every Day: Typical Web Query.
Selections Panel
When the OLAP Selections panel is turned on, you can quickly limit the data in the report by selecting specific values for the dimensions in the hierarchy. A drop-down list is available for each dimension. You can multiselect values from one or more dimension lists to refine your report output.
If you wish to add a dimension element to the report, you can drag it from the Selections panel into the report frame. (The cursor changes to a plus sign (+) to indicate an acceptable location.)
Each dimension has a relational operator button located to its left. This button toggles through a selection of basic numeric operators that enable you to quickly define your selection criteria. The operators are:
- Equal to.
- Not equal to.
- Less than or equal to.
- Less than but not equal to.
- Greater than or equal to.
- Greater than but not equal to.
For details, see Selection Criteria Relational Operators.
The following image shows the Equal to operator as the selection for each dimension in the Selections panel.
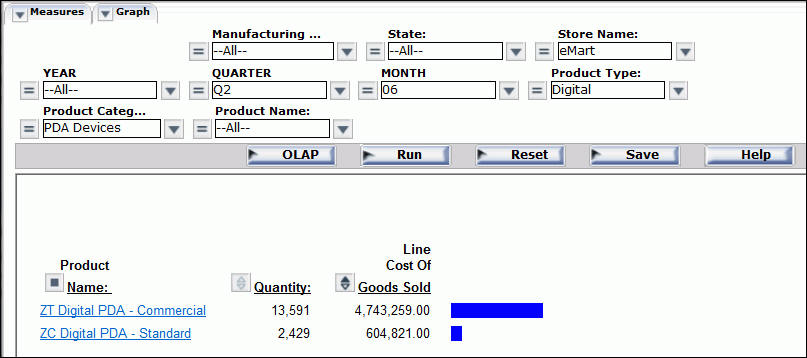
The name of the dimension field appears as defined in the Master File, even if an alternate column title has been specified.
In addition, you can customize the display of the measures in your report from the Selections panel. You can click either the Measures or the Graph arrow in the upper-left corner of the pane to list the measures.
- From the Measures arrow, you can display or hide the selected measures or request a column of simple bar graphs to reveal trends.
- From the Graph arrow, you can choose the measures you wish to graph and specify one of the following basic graph types: vertical and horizontal bar, line, area graphs, or pie charts.
Note that the Selections panel is resizable. The controls for dimensions, measures, and graphs float as you resize the report window, so that they continue to be visible in the frame.
Five buttons appear below the Selections panel: OLAP, Run, Reset, Save, and Help.
- OLAP. Opens the OLAP Control Panel (OCP).
- Run. Executes the report with the current set of selections.
- Reset. Resets all the controls in the report to their previous state (that is, before the current set of selections was made and after the last execution of the report).
- Save. Opens a list of options from which you can save or view the document.
- Help. Opens the WebFOCUS online Help.
OLAP Control Panel
From the OLAP Control Panel, you can perform every analytic function available to a WebFOCUS OLAP user, as shown in the following image.
The main window of the OLAP Control Panel contains the following components:
- Dimensions pane. Reflects the hierarchical structure of the data source being used by the current report. For example, the Location dimension contains the Region, State, and City fields. The Region is made up of several States, and each State contains several Cities. You click the arrow to the left of a dimension name to view the elements that comprise it. (The fields shown here are also listed in the Selections panel.)
- Drill Down and Drill Across panes. List the fields being used to sort the report. You can pivot a Drill Down field to a Drill Across field or a Drill Down Across field to a Drill down field, and shift their positions in the report. You can also accomplish these tasks by dragging fields within the report.
- Measures pane. Contains the body of your report (usually numeric fields). You can change the display mode of a measure by clicking the check box next to the measure. The options are display, hide, and show a column of associated bar graphs. This is equivalent to the options available from the Measures control in the Selections panel.
Although the most frequently used functions are available directly from an OLAP report and/or from the Selections panel, several can only be performed from the OLAP Control Panel.
OLAP Control Panel operations include:
- Sorting options for dimensions: from lowest to highest or highest to lowest (A to Z or Z to A), restricting sort field values to a specified number of either highest or lowest values, and assigning a rank number to each row in the report. For details, see Sorting Data.
- Options for grouping numeric data by tile (for example, percentile, decile, or quartile). For details, see Grouping Numeric Data Into Tiles.
- Defining selection criteria based on omitted or existing characters, dates, and range specifications. For details, see Limiting Data.
- Saving OLAP output in PDF and Excel formats. In the Repository path, users can also save OLAP output in a folder in which they are authorized to create private content. For details, see Saving and Displaying OLAP Reports and Graphs in Other Formats.
- Stacking multiple measures to limit the width of the report. For details, see Stacking Measures.
| WebFOCUS | |
|
Feedback |