Configuring Symbology for a Polygon Data Layer
|
Topics: |
When the geographic data defines polygons, the areas on the map representing each polygon can be colored based on several classification schemes and can have an outline that consists of a color, a thickness, and a line style and a fill style.
The following image shows the Symbol Settings section of the ESRI Object Settings panel for a polygon-based layer. Some selections may open additional options not shown in this image.
The following table summarizes the types of symbology available for a polygon layer. Each type of symbology is illustrated in one of the sections that follows.
|
Type of Symbol |
Description |
Configuration Fields |
|---|---|---|
|
Single |
User selects a single color, outline color, outline thickness, and outline style for the polygons. |
Use. Selects the type of symbols, Single for this option. Color. User selects a polygon fill color. The default is red. Outline Color. User selects a color for the borders around the polygons. The default is gray. Outline Thickness. User specifies a thickness in pixels for the polygon borders. The default is 1. Outline Style. User selects one of the following polygon border styles:
For more information, see Configuring Polygon Symbology Using a Single Color. |
|
Color |
User specifies a field to be used to classify polygon colors. |
Use. Selects the type of symbols, Color for this option. Using Field. User selects a field in the request to be used to classify the polygons by color. By. User selects from the following classification methods.
Number of Classes. User specifies the number of color breaks. The default is 5. Color Scheme. User selects the color palette for the polygons. The default uses shades of green. For more information, see Configuring Polygon Symbology Using a Single Color. |
|
Dynamic |
The WebFOCUS request that provides the location dimension defines the polygon properties. |
Use. Selects the type of symbols, Dynamic for this option. Label. User specifies a field in the request that contains the label text to display in the legend. The default is the AS name, title, or field name. Color. User specifies a field in the request that defines the fill colors of the polygons. For more information, see Configuring Dynamic Polygon Symbology. |
|
Unique |
User selects polygon properties for each value of a dimension in the request. |
Use. Selects the type of symbols, Unique for this option. Using Field. User selects a dimension in the request and assigns polygon properties for each value. Dimension Values box. A box is populated with the dimension values. The user can select values and move them to the right, then assign polygon properties to those selected values. Label. User specifies text to display in the legend for each selected dimension value. Color. User selects a polygon fill color for each selected dimension value. The default value is red. Outline Color. User selects a polygon border color for each selected dimension value. The default value is gray. Outline Thickness. User specifies a polygon border thickness in pixels for each selected dimension value. The default value is 1. Outline Style. User selects a polygon border style (Solid, None, Dot, Dash) for each selected dimension value. The default value is Solid. For more information, see Configuring Unique Symbology for Polygons. |
Configuring Polygon Symbology Using a Single Color
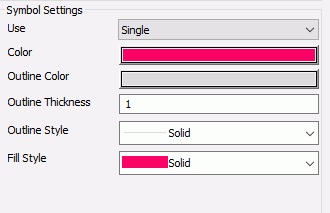
The default symbology for a polygon data layer is to color the polygons red with a light gray, 1-pixel solid outline, as shown in the following image.
You can change the color for the polygon, the color for the outline, the thickness of the outline, the line style for the outline, and a fill style for the polygon.
The following fields are available when you use Single as the symbology setting.
- Color
-
Description. Opens a color picker dialog box that lets you select a color for the polygons. You can select from a palette, select a named string, select a system color, or create a custom color, and set this color instance to that value.
Type of field. Color value.
Populated by. User.
User limitations. User can browse to a single color. The default is red.
- Outline Color
-
Description. Opens a color picker dialog box that lets you select a color for to outline the polygons. You can select from a palette, select a named string, select a system color, or create a custom color, and set this color instance to that value.
Type of field. Color value.
Populated by. User.
User limitations. User can browse to a single color. The default is light gray.
- Outline Thickness
-
Description. Is a thickness for the outline in pixels.
Type of field. Integer.
Populated by. User.
User limitations. User can enter a single number. The default is 1.
- Outline Style
-
Description. Is the style of the polygon outline.
Type of field. Drop-down list.
Populated by. User.
User limitations. Choices are:
- Solid (this is the default value).
- None.
- Dot.
- Dash.
- Fill Style
-
Description. Is the fill style of the polygon.
Type of field. Drop-down list.
Populated by. User.
User limitations. Choices are:
- Backward Diagonal.
- Cross.
- Diagonal Cross.
- Forward Diagonal.
- Horizontal.
- None.
- Solid (this is the default value).
- Vertical.
Note: The hatch patterns are images from Esri whose color cannot be altered using the Settings panel.
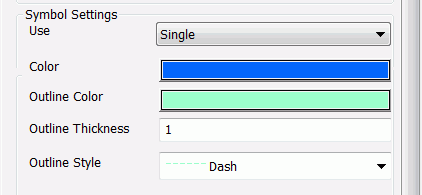
Example: Using Single Symbology for Polygons
This example makes the polygons blue and the outline a dashed light blue line. The WebFOCUS request used is customer_states, as described in Configuring a Map Data Layer. Add this request to the HTML page in the Requests & Data Sources panel.
Configure the map layer to use the customer_states procedure described in Configuring a Map Data Layer. The geographic role is US state (Name), and the field that matches the role is STATE_PROV_NAME. Configure the Symbol Settings in the ESRI Object Settings panel as shown in the following image, by clicking the Color field and selecting a dark blue color, clicking the Outline Color field and selecting a light blue color, and selecting Dash from the Outline Style drop-down list.
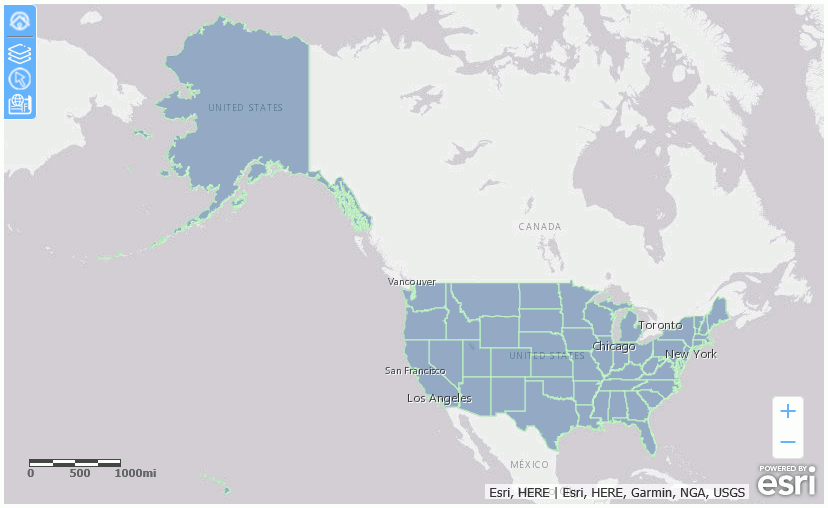
Run the HTML page. The output is shown in the following image.
Configuring Unique Symbology for Polygons
When you configure Unique symbology, you can display a different color for each value of a dimension field in the request. This is a good technique for defining categories.
The following image shows the Symbol Settings properties for Unique symbology in the ESRI Object Settings pane.
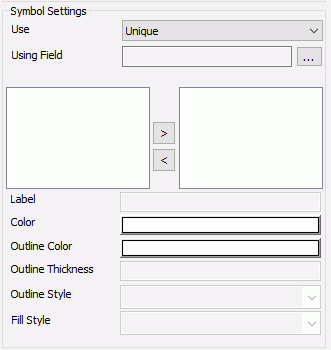
Descriptions of the fields for unique symbology for polygons follow.
- Using Field
-
Description. Is a dimension field in the request whose values will determine the shape or image to use.
Type of field. Combo box.
Populated by. User.
User limitations. Must be a dimension field in the request.
- Values
-
Description. This is the list of values for the Using Field. You can select any value and click the arrow keys to move them between the original list box and the user-selected values list box. Any values not in the user-selected list will display with default colors.
Type of field. List box.
Populated by. System.
User limitations. The user can select values from the system-generated list.
- Label
-
Description. For each value selected, you can enter a label to display in the legend.
Type of field. Text box.
Populated by. User.
User limitations. User can enter a single label for each value of the sing Field.
- Color
-
Description. For each value selected, you can select a polygon color. The default is red.
Type of field. Color picker.
Populated by. User.
User limitations. User can select a single color for each value of the Using Field.
- Outline Color
-
Description. For each value selected, you can select a color for the polygon outline. The default is light gray.
Type of field. Color picker.
Populated by. User.
User limitations. User can select a single color for each value of the Using Field.
- Outline Thickness
-
Description. Is a thickness for the outline in pixels.
Type of field. Integer.
Populated by. User.
User limitations. User can enter a single number. The default is 1.
- Outline Style
-
Description. Is the style of the polygon outline.
Type of field. Drop-down list.
Populated by. User.
User limitations. Choices are:
- Solid (this is the default value).
- None.
- Dot.
- Dash.
- Fill Style
-
Description. Is the fill style of the polygon.
Type of field. Drop-down list.
Populated by. User.
User limitations. Choices are:
- Backward Diagonal.
- Cross.
- Diagonal Cross.
- Forward Diagonal.
- Horizontal.
- None.
- Solid (this is the default value).
- Vertical.
Note: The hatch patterns are images from Esri whose color cannot be altered using the Settings panel.
Example: Configuring Unique Color Symbology for Polygons
This example configures a unique color for the polygons for each US region.
You can create a request using the Report Canvas or by entering request syntax in the Text Editor. For information about creating a WebFOCUS report request using the Report Canvas, see Creating Reports in WebFOCUS App Studio.
Following is the syntax for a WebFOCUS request that defines regions based on state names. Paste this request into the text editor and save it as customer_states4.
DEFINE FILE WF_RETAIL_LITE
STATE/A20 = STATE_PROV_NAME;
REGION/A10 = IF STATE EQ 'Connecticut' OR 'Maine' OR 'Massachusetts' OR
       'New Hampshire' OR 'Rhode Island' OR 'Vermont' OR
       'New Jersey' OR 'New York' OR 'Pennsylvania' THEN 'Northeast'
       ELSE IF STATE EQ 'Illinois' OR 'Indiana' OR 'Michigan' OR 'Ohio'
       OR 'Wisconsin' OR 'Iowa' OR 'Kansas' OR 'Minnesota' OR 'Missouri'
       OR 'Nebraska' OR 'North Dakota' OR 'South Dakota' THEN 'Midwest'
       ELSE IF STATE EQ 'Delaware' OR 'Florida' OR 'Georgia' OR 'Maryland'
       OR 'North Carolina' OR 'South Carolina' OR 'Virginia' OR
       'Washington D.C.' OR 'West Virginia' OR 'Alabama' OR 'Kentucky' OR
       'Mississippi' OR 'Tennessee' OR 'Arkansas' OR 'Louisiana' OR
       'Oklahoma' OR 'Texas' THEN 'South' ELSE 'West';
END
TABLE FILE WF_RETAIL_LITE
SUM QUANTITY_SOLD
BY REGION
BY STATE_PROV_NAME
WHERE COUNTRY_NAME EQ 'United States'
ON TABLE PCHOLD FORMAT XML
END
Configure the map layer to use this request in the ESRI Object Settings panel. The geographic role is US state (Name), and the field that matches the role is STATE_PROV_NAME. Configure the unique symbol settings using the REGION field, as shown in the following image.
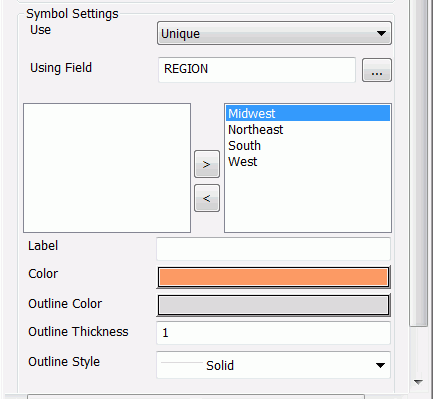
Move each region value to the right using the > arrow, and configure the following entries and selections for each:
For Northeast, enter Northeast in the Label box and select a green polygon color from the color picker.
For West, enter West in the Label box and select a blue polygon color from the color picker.
For South, enter South in the Label box and leave the polygon color as red.
For Midwest, enter Midwest in the Label box and select and orange polygon color from the color picker.
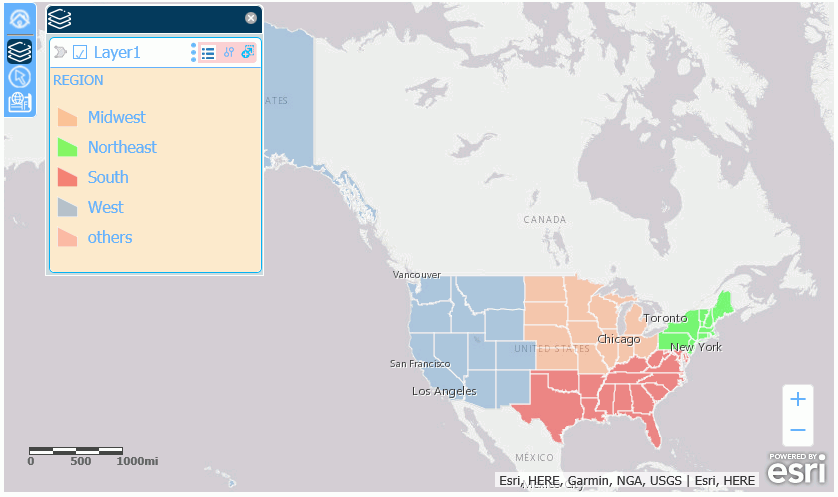
Run the HTML page. The output is shown in the following image. The table of contents is open to show the labels and colors.
Configuring Polygon Symbology Using Color
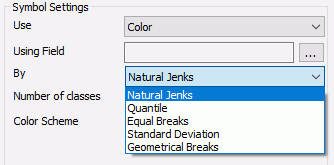
When you select Color in the Symbol Settings Use drop-down list of the ESRI Object Settings panel, the polygons are colored using a choice of color classification systems, as shown in the following image.
- Using Field
-
Description. This is a numeric field in the request whose values will be used by the classification schema to define the class breaks.
Type of field. Combo box.
Populated by. User.
User limitations. User can only select one field. It should be a measure field or numeric.
- Number of Classes
-
Description. This is the number of class breaks that will be rendered.
Type of field. Combo box.
Populated by. User.
User limitations. User can only select values 2 through 9. The default is 5.
- By
-
Description. This is the classification scheme to be used for assigning the breaks and ranges.
Type of field. Drop-down list.
Populated by. User.
User limitations. Choices are:
- Natural Jenks, a classification scheme that uses breaks inherent in the data, grouping similar values and maximizing differences between groups. This is the default choice.
- Quantile, a classification scheme in which each class contains an equal number of points.
- Equal Breaks, a classification scheme that breaks the data into equal ranges of values.
- Standard Deviation, a classification scheme that defines the breaks based on the number of standard deviations from the mean.
- Geometrical Breaks, a classification scheme that bases class breaks on intervals that have a geometrical series.
- Color Scheme
-
Description. This lets you select an array of color values, defining the color ramp. The first color will be used to render the minimum data class, and the last color will be used to render the maximum data class.
Type of field. Drop-down list.
Populated by. User.
User limitations. User can only select one color array. The default array uses shades of off white and green.
Example: Symbolizing Polygons Using Color
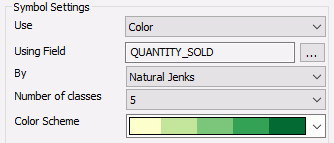
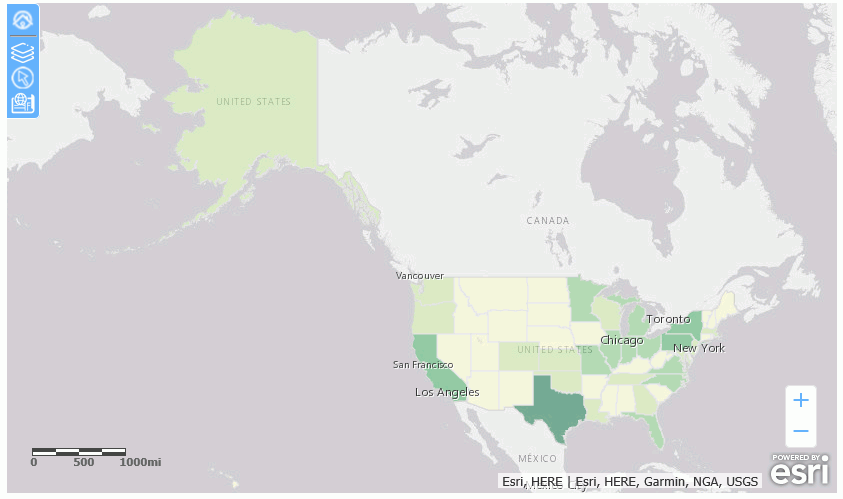
This example uses the Natural Jenks color classification scheme based on the QUANTITY_SOLD field, as shown in the following image. The WebFOCUS request that provides the point data is the customer_states4 procedure. The geographic role is US state (Name), and the field that matches this role is STATE_PROV_NAME.
Run the HTML page. The output is shown in the following image.
Configuring Dynamic Polygon Symbology
When the symbology for polygons is Dynamic, you can specify columns in the request that provide labels and colors for the polygons, as shown in the following image.
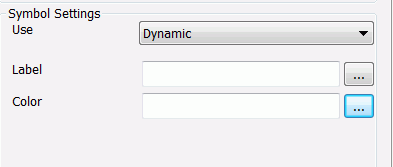
Descriptions of the fields available when you select Dynamic in the Symbol Settings Use drop-down list follow.
- Label
-
Description. This column will be used to depict values in the Legend.
Type of field. Combo box.
Populated by. User.
User limitations. User must select one column in the layer request.
- Color
-
Description. This column will provide a value for the color of a polygon. The default is red.
Type of field. Combo box.
Populated by. User.
User limitations. User can only select one column in the layer request.
Note:
- Dynamic symbology automatically creates an Other category that is symbolized using a pink color. With the Edge browser, the Other category does not show the default pink color, but shows a white outline instead.
- You cannot type characters in the combo boxes for dynamic symbols, you can only select field names.
Example: Using Dynamic Symbols for Polygons
This example uses dynamic colors and labels for polygon.
You can create a request using the Report Canvas or by entering request syntax in the Text Editor. For information about creating a WebFOCUS report request using the Report Canvas, see Creating Reports in WebFOCUS App Studio.
The following WebFOCUS procedure defines fields that supply the color and label for each country. Paste this procedure into the text editor and save it as customer_countries.fex.
DEFINE FILE WF_RETAIL_LITE
COLOR/A10 = IF COUNTRY_NAME EQ 'United States' THEN 'blue'
ELSE IF COUNTRY_NAME EQ 'France' THEN 'red'
ELSE IF COUNTRY_NAME EQ 'Italy' THEN 'green'
ELSE IF COUNTRY_NAME EQ 'Japan' THEN 'black'
ELSE 'purple';
Label/A20 = IF COUNTRY_NAME EQ 'United States' THEN 'US'
ELSE IF COUNTRY_NAME EQ 'France' THEN 'France'
ELSE IF COUNTRY_NAME EQ 'Japan' THEN 'Japan'
ELSE IF COUNTRY_NAME EQ 'Italy' THEN 'Italy'
ELSE 'UK';
END
TABLE FILE WF_RETAIL_LITE
SUM
COGS_US
QUANTITY_SOLD
Label
COLOR
BY COUNTRY_NAME
WHERE COUNTRY_NAME EQ 'United States' OR 'France' OR 'Italy' OR 'Japan'
OR 'United Kingdom';
ON TABLE NOTOTAL
ON TABLE PCHOLD FORMAT XML
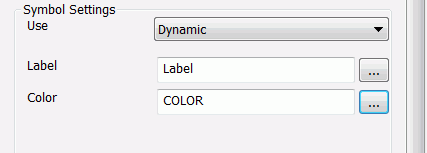
ENDAdd this request to the Customer Layer using the Requests & Data Sources panel. Then configure the map layer to use this request. The geographic role is Country (Name), and the field that matches this role is COUNTRY_NAME. Configure the Symbol Settings section of the ESRI Object Settings panel by selecting the appropriate fields from the request, as shown in the following image. The Label is taken from the Label field in the request, and the Color is taken from the COLOR field in the request.
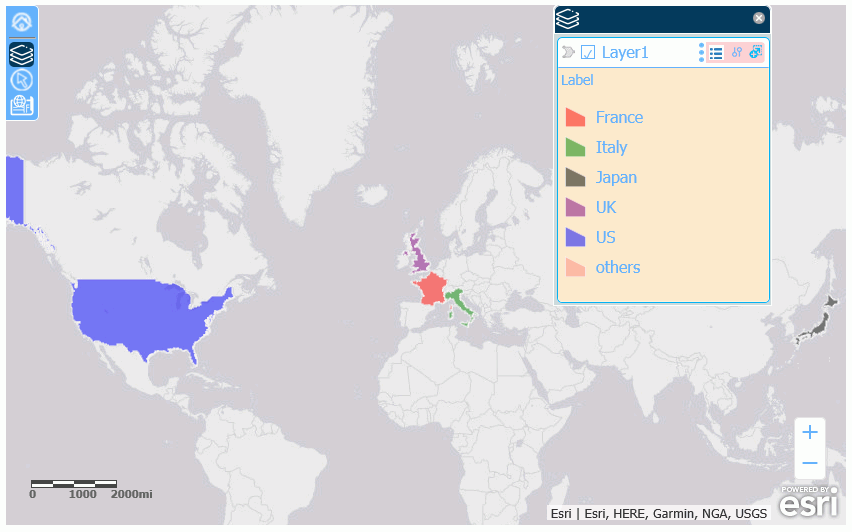
Run the HTML page. The output, zoomed in to fit the frame, is shown in the following image. The Legend is toggled on to show the labels, sizes, and colors used.
| WebFOCUS | |
|
Feedback |