Formatting a Legend
|
Topics: |
A legend contains information that is necessary to accurately interpret the data on a chart. By default, a chart displays either a vertical axis title if there is a single measure field, or a legend if there are multiple measure fields.
Format Legend Dialog Box
Whether you access legend options from the ribbon or the shortcut menu, you are presented with the Format Legend dialog box of options. For instructions on how to open this dialog box, see Using Legend Properties.
The Format Legend dialog box contains options for formatting a legend on a chart or visualization. It contains the following tabs:
- Legend Options
- Markers & Labels
- Fill
- Border Styles
Note: The Fill, Border Style, and Shadows tab are not available in InfoAssist+ Basic.
For instructions on how to open this dialog box, see the procedures in Using Legend Properties.
Use the Legend Options tab to customize the appearance of a legend on a chart or visualization.
The Legend Options tab is shown in the following image.
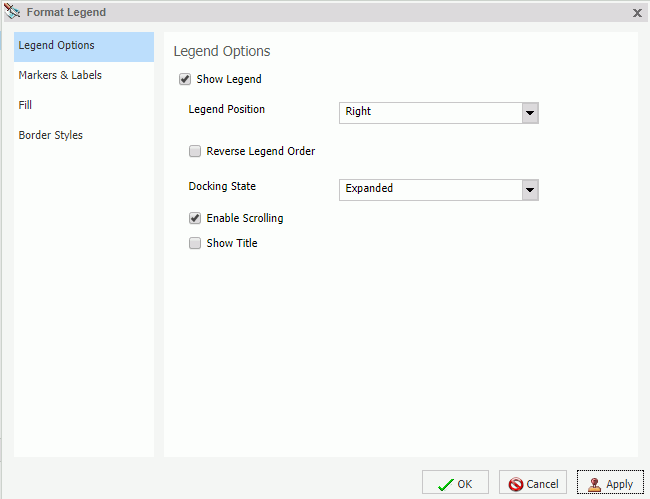
The Legend Options tab contains the following options.
- Show Legend. When selected, a legend displays on a chart or visualization. Clear this option to suppress a legend on a chart or visualization.
- Legend Position. Opens a drop-down menu of options to position the legend. For example, top or left.
- Reverse Legend Order. Specifies that the legend be drawn in reverse order. Clear this option to specify that the legend be drawn in normal order.
- Docking State. This option dictates how the legend is docked. It is set to Expanded by default, but you can set it to Collapsed, which will show that the legend is available (using the grey arrow). This option saves real estate in your chart by collapsing the categorical text labels in the legend while preserving the legend label colors. This is particularly useful when items in your legend have long labels and you wish to truncate them for the purposes of display. If you set this option to None, the ability to expand or collapse the legend is removed and the grey arrow no longer displays.
- Enable Scrolling. Select this check box to enable scrolling in your legend. This is particularly useful when you have numerous entries in your legend. This check box is selected by default. To disable scrolling in your legend, clear the Enable Scrolling check box. All legend options display in columns, and a scroll bar does not display.
- Show Title. Select this check box to display the legend title.
Use the Markers & Labels tab to customize the appearance of markers and labels on legends.
The Markers & Labels tab contains the following options:
- Style Labels. Opens the Style dialog box, where you can style text.
- Marker Position. Opens a drop-down menu of options to set the position of text relative to the legend marker. For example, Left of Text or Above Text.
Use the Fill tab to modify the color of the legend area. For more information, see Format Series Dialog Box.
Use the Border Styles tab to place a border around a legend. For more information, see Format Series Dialog Box.
The Border Styles tab contains the following options:
- Show Border. Select this option to place a border around a legend.
- Color. With the Show Border option selected, you can click this button to open the Color dialog box, where you can select a color for the border.
Legend Elements Shortcut Menu
When you right-click a legend on a chart, a menu of options opens. The menu contains options that are available on the Format tab.
The shortcut menu options are described in the following table. The table provides links to the sections of this document in which those options are also discussed.
|
Option |
Description |
|---|---|
|
Show legend |
Controls the display of the legend. InfoAssist+ displays the legend by default. When you clear this option, InfoAssist+ suppresses the legend. For instructions, see Using Legends Properties. The background shortcut menu has an option to restore the legend after it has been suppressed. |
|
Legend Position |
Controls the placement of the legend on the chart. For instructions see, Using Legends Properties. |
|
Legend Area Color |
Enables you to specify the color of the legend background area using the Color dialog box. This option is available only when you right-click the area around the legend. For instructions see, Using Legends Properties. |
|
Legend Border Color |
Enables you to specify the color of the border around the legend background area using the Color dialog box. This option is available only when you right-click the area around the legend. For instructions see, Using Legends Properties. |
|
More Legend Options |
Opens the Format Legend dialog box. |
Using Legend Properties
|
How to: |
The following sections contain procedures for customizing legends. The procedures are organized by the tab and group in which their associated options appear on the ribbon.
Procedure: How to Hide a Legend
- Create a chart with multiple measure fields.
- Clear the Show
legend option in one of the following ways:
- Ribbon: On the Format tab, in the Labels group, click Legend, then click Show legend to clear the option.
- Shortcut Menu: Right-click the legend, and clear the Show legend option.
The legend is hidden.
Procedure: How to Position a Legend
- Create a chart with multiple measure fields.
- Open the
menu of label position options in one of the following ways:
- Ribbon: On the Format tab, in the Labels group, click Legend, then point to Legend Position.
- Shortcut Menu: Right-click the legend, and point to Legend Position.
- Select a position for the legend. For example, Auto or Right.
Procedure: How to Specify the Color of a Legend Border
- Create a chart with multiple measure fields.
- Open the
Format Legends dialog box in one of the following ways:
- Ribbon: On the Format tab, in the Labels group, click Legend, then click More Legend Options.
- Shortcut Menu: Right-click the legend, and click More Legend Options.
The Format Legend dialog box opens. For more information, see Format Legend Dialog Box.
- On the Border Styles tab, select the option to Show Border.
- Click the Color icon to open the Color dialog box, where you can specify the color of the legend border.
- Click OK to close the Color dialog box.
- Click OK to
close the Format Legend dialog box.
The legend border is formatted accordingly.
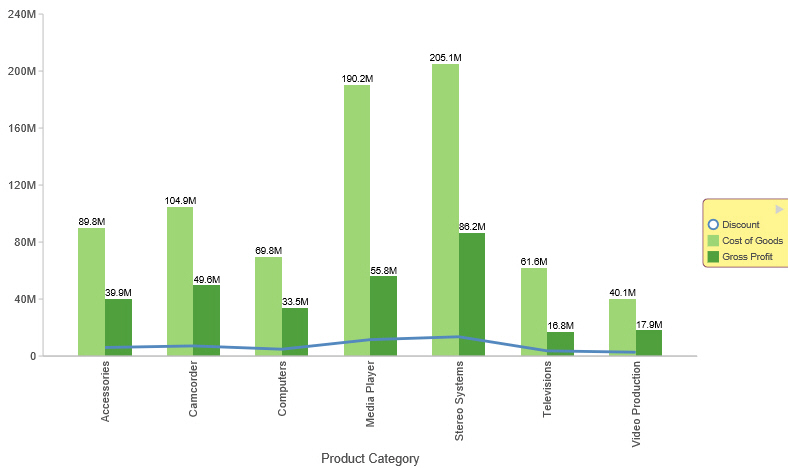
The following image is an example of a chart with a styled legend.
| WebFOCUS | |
|
Feedback |