Format Tab
The Format tab provides options for formatting your report, chart, document, or visualization. Depending on the mode you are using, you can perform tasks such as selecting a chart type, enabling Auto Linking, or adding navigational aspects to a report.
The following list highlights the features on the Format tab for each mode.
- For reports, the Format tab provides access to the Destination, Navigation, Features, Run with, and Auto Linking groups. These options enable you to perform many functions related to reports, including Auto Drill or any other report navigation feature.
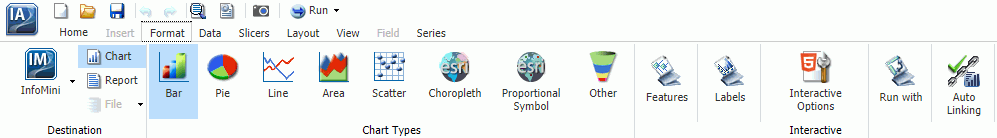
- For charts, the Format tab provides access to the Destination, Chart Types, Features, Labels, Interactive, Run with, and Auto Linking groups. These options enable you to perform a variety of charting tasks, including changing the chart type and adding interactive options.
- For documents, the Format tab enables you to change to Report or Chart mode. You can also access InfoMini.
- For visualizations, the Format tab provides access to the Report, Features, Labels, and Interactive groups. These options enable you to format your visualization. Also included are grid commands, as well as various features and label commands.
The Format tab is shown in the following image. The options and groups on the Format tab change, depending on what mode of InfoAssist+ you are in.
Related Information for Reports, Charts, and Documents:
Related Information for Visualizations:
| WebFOCUS | |
|
Feedback |