WebFOCUS Release 8.2.02M

Explore the features and product innovations that are available in WebFOCUS Release 8.2.02.

Web Development

WebFOCUS Designer: Create Responsive InfoApps and Pages From Any Content

With WebFOCUS Designer, you can build interactive, responsive InfoApps™ and pages with your organization's content.

You can use the responsive grid canvas and collapsible sections to build robust pages using drag-and-drop actions that make formatting and designing a page simple for every user. You can integrate filter controls automatically when you add parameterized content, such as reports or charts, to the page. You can also run Designer pages from the WebFOCUS Home Page, or view them with Mobile Viewer on any device.

recruit

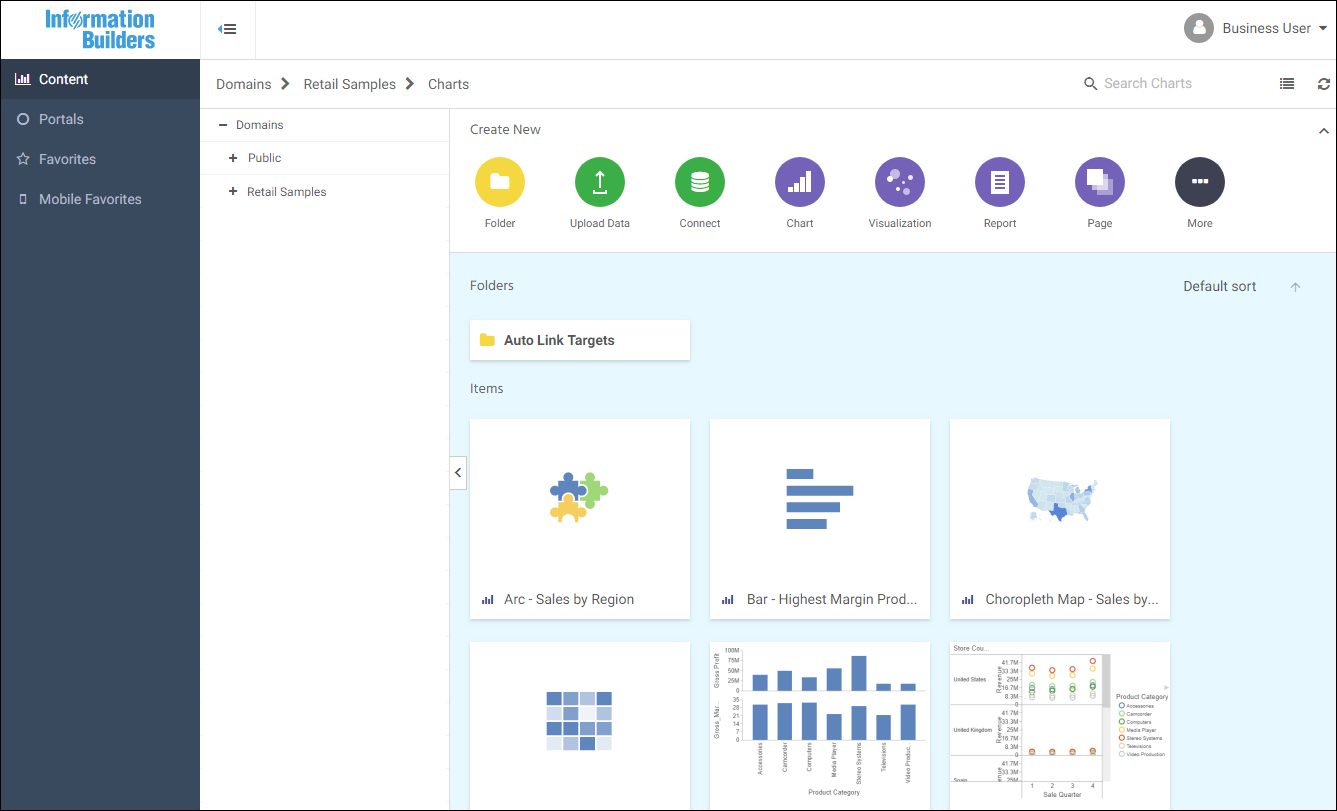
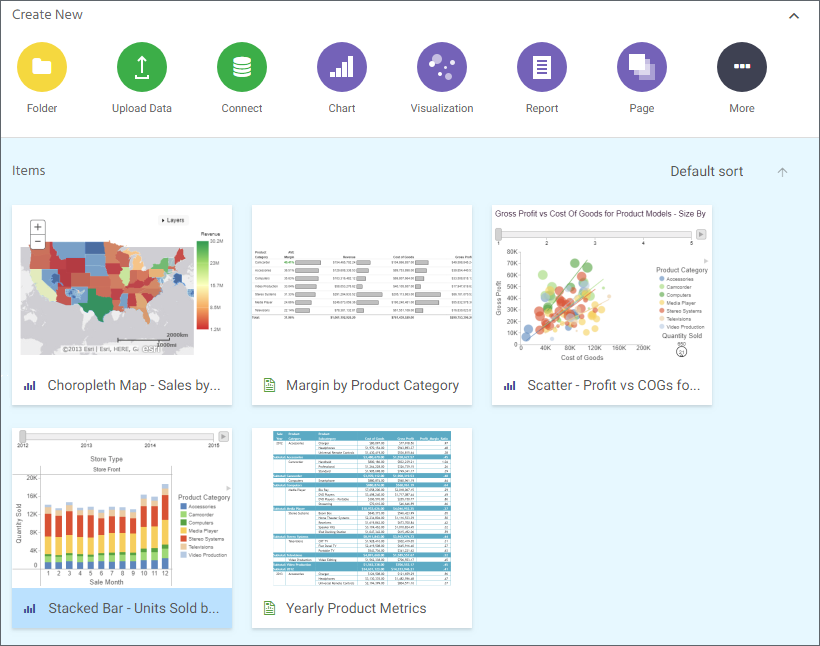
Interactive WebFOCUS Home Page: Streamlined Access to Tools, Functions, Features, and More

The new interactive WebFOCUS Home Page streamlines access to the features that WebFOCUS offers in a modern, mobile-friendly interface. Regardless of the type of user you are, whether non-technical business user or advanced developer, you can begin building and analyzing content quickly. When you sign in to WebFOCUS, this is the first page you see.

recruit

Desktop Development

Apply Slide Master and Slide Layout Templates in Presentations Generated by App Studio

Control and enhance the output of WebFOCUS App Studio presentations using Slide Master and Slide Layout templates that you create in Microsoft PowerPoint 2007 and higher.

With this new feature, you can select any Slide Layout, in any Slide Master from a PowerPoint template (POTX/POTM) or Presentation file (PPTX/PPTM), and apply it to the output of a document you create App Studio.

Setting a Date Range for a Target Calendar

Using the IbComposer_setCalendarDatesRange JavaScript function in App Studio, you can set a range of days for a target calendar using a specified date in a source calendar, as well as To and From dates. Adding this function to your HTML page helps calculate and validate the number of days between two set date values that can be a static set of dates in a calendar or use variables to dynamically set a date range.

Visualization and Analytics

Analyze Dynamic Charts...With Insight

Insight is a powerful, run-time visualization tool that enables interactive selection of measures and dimensions. With Insight, you can analyze and edit dynamic charts, comparing data values and reviewing scenarios in real time. When you run an HTML5 Chart in Insight, you can transform it quickly and easily, using intuitive options that help you effectively illustrate your data, and review scenarios to meet the needs of your business.

recruit

Download Chart Plug-ins From the HTML5 Chart Extensions Page

Two new HTML5 Chart Extensions pages have been added to the WebFOCUS Administration Console to streamline control and availability of chart plug-ins in your WebFOCUS environment.

The HTML5 Chart Extensions page contains all the HTML5 chart extensions that are currently available in your WebFOCUS installation. From here, administrators can manage the chart extensions they make available to InfoAssist+ developers.

Administrators can install locally-created HTML5 chart extensions or upload publicly available and supported chart extensions that are not currently installed. You can download many of these chart extensions from the Information Builders Github web site.

Save Space and Group Dimension Values With Paper-Clipping

Similar to dynamic grouping in InfoAssist+ charts and reports, you can use the new Paper-Clipping feature to create logical groups within a dimension field in visualization. This helps save space in your visualization by truncating two or more values into a single value.

Reporting

Create Thumbnails From InfoAssist+ Content

You can now create and store thumbnail images for the content you create in InfoAssist+, to use on the WebFOCUS Home Page. These thumbnails provide an easy-to-identify visual for each item, so you can edit, run, and share them quickly. You can create your thumbnails in InfoAssist+ Report or Chart mode. Once you create the thumbnail and save the report or chart, you can access the image from the file list on the WebFOCUS Home Page.

Use Pivot Tables With XLSX Templates

WebFOCUS XLSX format can generate a workbook based on a template with predefined pivot tables. These pivot tables can then be built based on data fed from a report, and/or exist independently of the WebFOCUS data on other worksheets. This allows you to pull your WebFOCUS data into Microsoft Excel workbooks for analysis, and maintain the existing templates used across your organization.

recruit

Scheduling and Distribution

Burst Active Dashboards and Compound Reports With Parameter Values

In addition to standard bursting, you can now use a parameterized filter to distribute sections of reports to recipients. This new feature allows you to burst reports that originally could not be burst, including active dashboards and compound reports in Excel format. You can also burst each parameter separately, which distributes separate, individual reports to your recipients when the schedule is run.

recruit