Understanding Resource Management Reports
|
Topics: |
Resource Analyzer monitors data usage activity by collecting the attributes of requests and storing them in a set of Usage Monitoring tables. It automatically keeps track of each request, which data sources and columns it accessed, when it was run, how long it took, which resources it consumed, and more. Resource Analyzer allows you to report on, graph, and analyze end-user request traffic.
Running Resource Analyzer Reports
|
How to: |
After you have enabled Usage Monitoring for a period of time and Resource Analyzer has collected a reasonable amount of data, you can display several reports and graphs about the monitored data. The Resource Analyzer reports are available from the Enterprise Usage Monitor (EUM) portal.
Procedure: How to Run Resource Analyzer Reports
To run a Resource Analyzer report:
- Sign in to Enterprise Usage Monitor.
- On the Home page, expand the Enterprise Usage Monitor folder in the Resources Tree.
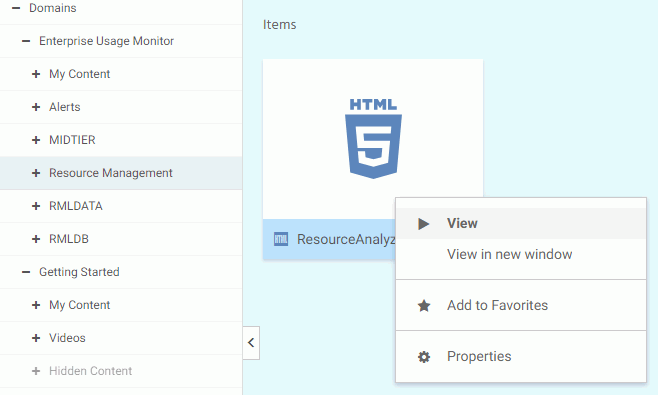
- Click Resource Management and right-click the ResourceAnalyzer HTML document in the content area. Click View, as shown
in the following image.
- The Resource Analyzer Reports filter window opens.
- Select the report you want to run from the Select Report drop-down menu, as shown in the following image.

Here, you can specify general information that applies to all Resource Analyzer reports. This information includes setting date ranges for report selection criteria, drilling down on reports for more details, and displaying reports in graphical format.
Note: All of the Report filter options shown are only available for the following reports:
- Monitored Sessions
- Monitored Commands
All other reports will only have the first three options available.
The following options are available:
- Select server
-
The server, or servers, you want to report on. Multiple server support is only available if the server you are connected to is part of a many-to-one configured repository.
- Report format
-
Allows you to select the output format of the report. The available options are HTML, active report, PDF, Excel, and PowerPoint. The default value is HTML.
- Report period
-
The time range that the report will be run on.
- Start Date
-
Allows you to select the first date of the reporting range.
- End Date
-
Allows you to select the first date of the reporting range. The default end date is the current date.
- Visualize Data
-
Allows you to add visualization to numeric resource values, such as CPU and duration times. This option is enabled, by default.
- Top Number
-
Allows you to set the top number of users, procedures, or data sources selected for Top n reports. The available options are 5, 10, 15, 20, and 25. The default value is 10.
Note: This option is only available when running a Users Top n report.
- Location of names file
-
Allows you to decode the sign-in ID to a user name to use in the Top n Users report. The format for the file is userid,'name'. The default file searched for is names.txt in the baseapp folder.
Note: This option is only available when running a Top n report.
The information you supply here will apply to any report you run. To change this information, return to this screen by running another report and changing the filters.
- Click View Report.
Available Resource Analyzer Reports
Resource Analyzer offers tabular and graphical reports that show content planning requirements, user activity profiles, usage profiles over time, typical request structures, and columns used.
Initially, when you execute reports, you will usually see a general summary report for the category. Most of the column headings of the reports are hyperlinked. You can click the column heading links to re-sort the report by different columns. In addition, other hyperlinks in the report let you drill down to more detailed information. These hyperlinked drill-down options are described in more detail throughout this chapter.
The following sections describe the individual reports, as well as the hyperlinked drill-down options for each report.
Monitored Sessions
The Monitored Sessions report provides an overview of the procedures and commands that are being monitored, including the number of records processed, and the rows returned.
The following image shows the Monitored Sessions report.

This report has one hyperlink that allows you to drill down to other reports, as described in the following table.
|
Click a hyperlink in the: |
Report Generated |
Description |
|---|---|---|
|
Date column |
Session Summary Report by Hour |
Lists the procedures and commands that are being monitored by hour. Allows you to drill down to see this report by quarter, and then by detail. |
Monitored Commands
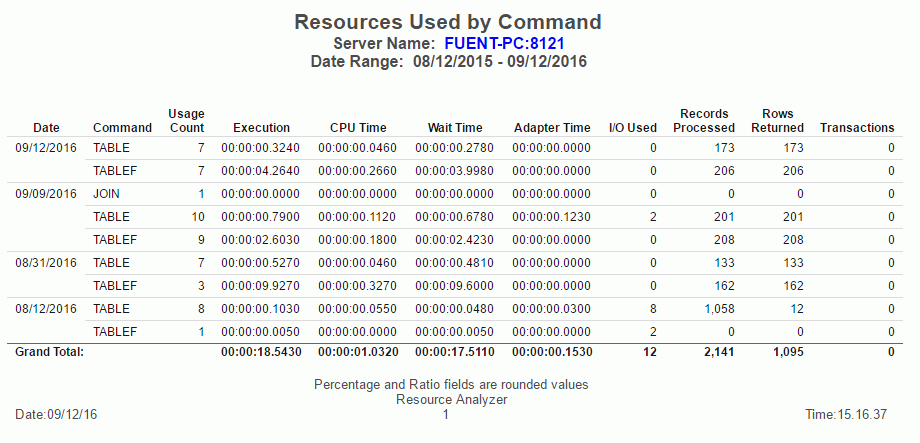
The Monitored Commands report provides an overview of the resources being used by each command, including the execution, CPU, and wait time.
The following image shows the Monitored Commands report.
Data Sources Never Used
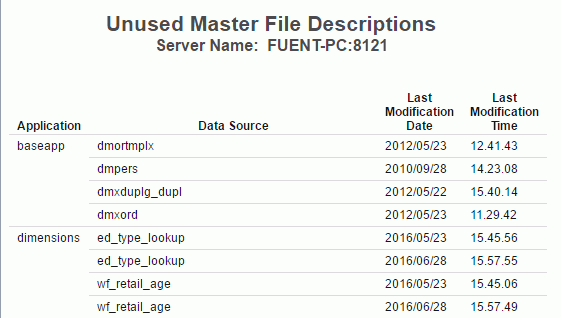
The Data Sources Never Used report provides an overview of unused data sources, including the application directory they are found in, and the last modification date and time.
The following image shows the Data Sources Never Used report.
Procedures Never Used
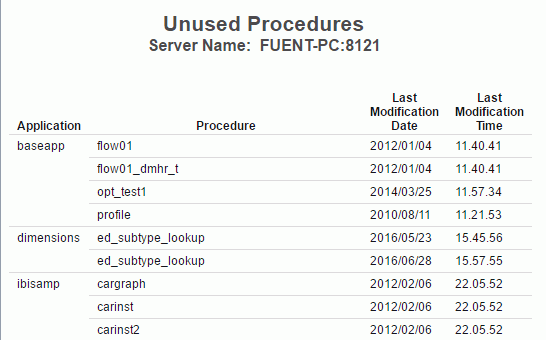
The Procedures Never Used report lists those procedures in the application path of the server that have never been executed.
The following image shows the Procedures Never Used report.
Users Report by Frequency of Use
The following image shows the Users Report by Frequency of Use, which provides a summary of user activity. This report lists users on the left, followed by columns with hyperlinked headings that indicate the number of requests the users submitted, their percentage of total requests and resource usage, and their first and last access dates. Click any of the hyperlinked column headings to sort the report by that column.

This report has several hyperlinks that allow you to drill down to additional reports. The following table lists and describes these hyperlinks.
|
Hyperlink in the: |
Report Generated |
Description |
|---|---|---|
|
% Total Commands column. |
Procedure Use by User |
Lists the procedures executed by the user with information about how often and when the executions have occurred. Also allows you to drill down to see detailed request information for each procedure as well as the actual request syntax |
|
% Total Procedures column. |
Procedure Summary for User |
Lists the procedures used for requests by the specified user, along with request and resource information and dates of access. Also allows you to drill down to see detailed request information for each procedure as well as the actual request syntax. |
|
% Total Resources column. |
Resources used by User |
Summarizes the resource usage of the specified user, including number of requests, elapsed time, CPU seconds, I/Os, rows returned, and access dates. |
Users Report by Resources Used
The following image shows the Users Report by Resources Used, which provides information on resource utilization by user. This report lists users along with the number of requests they submitted, total and average elapsed time, CPU seconds, I/Os, rows, and their first and last access dates. Click any of the hyperlinked column headings to sort the report by that column.

This report has one hyperlink that allows you to drill down to another report, as described in the following table.
|
Hyperlink in the: |
Report Generated |
Description |
|---|---|---|
|
User column. |
Data Source Use by User |
Lists the data sources accessed by the specified user, information about the requests, and dates of access. Also allows you to drill down to see column and data type information, as well as procedures used in requests by the specified user. |
Users Report by Historical Use
The following image shows the Users Report by Historical Use, which provides information on historical activity by user. This report lists users along with the number of requests they submitted in a particular year and the percentages of their requests and resource usage out of the totals of that year. Click any of the hyperlinked column headings to sort the report by that column.

This report has several hyperlinks that allow you to drill down to additional reports, summarized in the following table.
|
Hyperlink in the: |
Report Generated |
Description |
|---|---|---|
|
User column. |
Data Source Use by User |
Lists the data sources accessed by the specified user, information about the requests, and dates of access. Also allows you to drill down to see column and data type information, as well as procedures used in requests by the specified user. |
|
Year column. |
Access per Month for User during Year |
Summarizes by month the number of requests made by the specified user, along with the percentage of the user requests and resource usage out of the particular date totals. |
|
% Total Procedures column. |
Procedures used by User |
Summarizes the procedure access of the specified user, including number of executions and % of resources used. |
Users Report by Top N
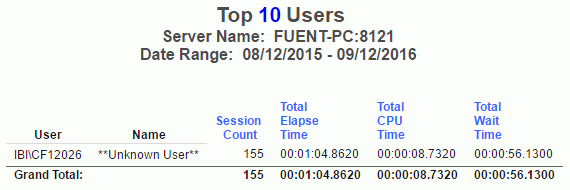
The following image shows the Users Report by Top n Users, which shows the usage data for the top number of users specified. The number of users is specified in the Top number drop-down menu of the Report Filter. The available options for top number are 5, 10, 15, 20, and 25. The default value is 10. The Name column in this report can use a file that decodes the User ID shown in the User column. The format for the file is userid,name. The default file searched for is names.txt in the baseapp folder.
Procedures Report by Frequency of Use
The following image shows the Procedures Report by Frequency of Use, which provides a summary of procedures being executed. This report lists procedures executed at your site by type, along with statistics about each execution.
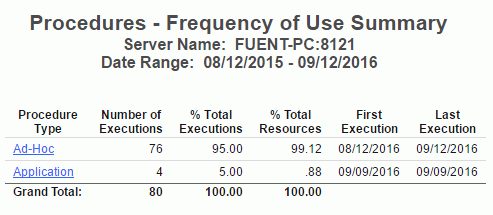
This report has one hyperlink that allows you to drill down to another report, as described in the following table.
|
Hyperlink in the: |
Report Generated |
Description |
|---|---|---|
|
Procedure Type column. |
Request from Procedure Ad hoc or Procedure Summary (depending on procedure type selected) |
Lists the date and time, user, resource, and execution information for all procedures of the specified type. Also allows you to drill down further to see the actual request syntax. |
Procedures Report by Resources Used
The following image shows the Procedures Report by Resources Used, which provides a summary of resource utilization by procedure. This report summarizes the resource usage for the procedures executed at your site, including their percentage of total procedures and resources used, as well as total CPU seconds, elapsed time, I/Os, rows, and first and last execution.

This report has one hyperlink that allows you to drill down to another report, as described in the following table.
|
Hyperlink in the: |
Report Generated |
Description |
|---|---|---|
|
Procedure Type column. |
Procedure Resource Utilization |
Summarizes the executions, users, total and average resource usage, and execution dates for procedures of all types. Also lets you drill down on procedure names to see more detailed usage information as well as the actual request syntax. |
Procedures Report by Historical Use
The following image shows the Procedures Report by Historical Use, which provides information on historical activity by procedures. This report summarizes by year the number of executions, users, and percentage of executions and resources used by the types of procedures at your site. Click any of the hyperlinked column headings to sort the report by that column.
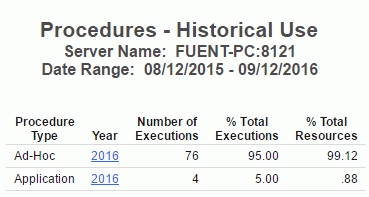
This report has one hyperlink that allows you to drill down to another report, described in the following table.
|
Hyperlink in the: |
Report Generated |
Description |
|---|---|---|
|
Year column. |
Procedure Access by Year by Month |
Lists the month for all executed procedures of the specified procedure type and year. Also lists their number and percentage of executions, their number of users, and their resource usage percentage. |
Procedures Report by Top N
The following image shows the Procedures Report by Top n Users, which shows the top number of procedures executed by the user. The number of procedures is specified in the Top number drop-down menu of the Report Filter. The available options for top number are 5, 10, 15, 20, and 25. The default value is 10.
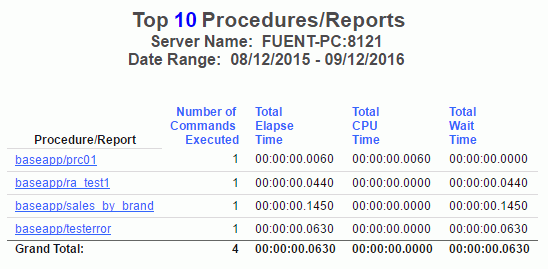
This report has one hyperlink that allows you to drill down to another report, described in the following table.
|
Hyperlink in the: |
Report Generated |
Description |
|---|---|---|
|
Procedure/Report column. |
Procedure execution count by User |
Shows how many times the selected procedure was executed by the user. |
Data Sources Report by Frequency of Use
The following image shows the Data Sources Report by Frequency of Use, which provides a summary of data sources being used. This report lists all accessed data sources along with the number and percentage of requests to each data source, the number of users, the percentage of resources consumed, and access dates. Click any of the hyperlinked column headings to sort the report by that column.
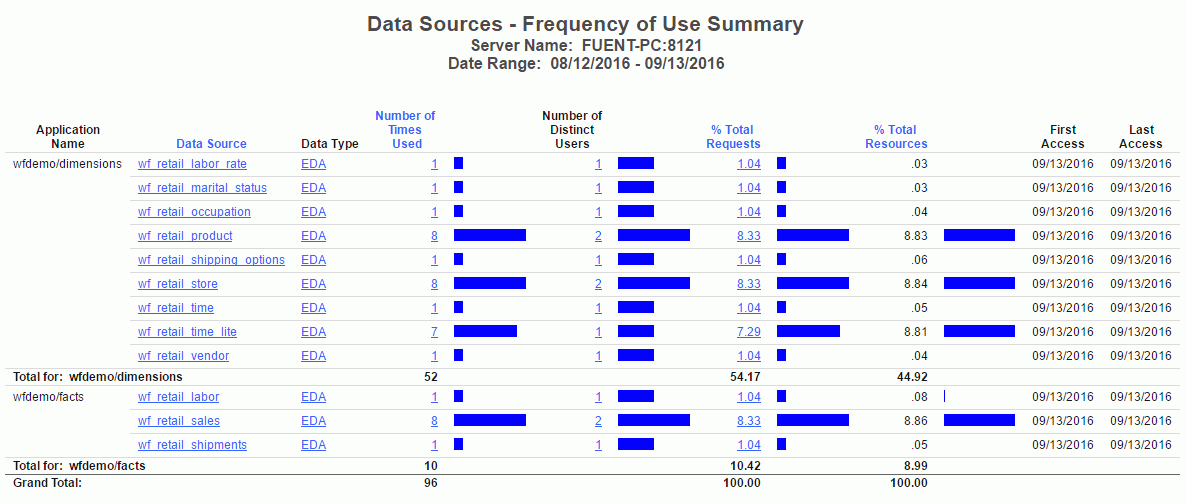
This report has several hyperlinks that allow you to drill down to additional reports, summarized in the following table.
|
Hyperlink in the: |
Report Generated |
Description |
|---|---|---|
|
Data Source column. |
Column Level for Data Source Data Source |
Shows usage for the columns for the specified data source, including whether they were used with functions, relations, selects, sorts, and groups, and how many days the column has been unused. Also allows you to drill down to see more information about when the columns were used. |
|
Data Type column. |
Data Sources of type Data Type |
Lists all the data sources of the specified data type (the engine used in your enterprise) along with the dates of first and last access for each data source. |
|
Number of Times Used column. |
Request Activity for Data Source: Data Source |
Shows request activity for all users of the specified data source, including I/Os, rows returned, and elapsed time. Also allows you to drill down further to see the actual request syntax. |
|
Number of Distinct Users column. |
Users of Data Source |
Lists all users of the specified data source along with a summary of the resources they have used. |
|
% Total Requests column. |
Procedures Using Data Source |
Lists the procedures used to access the specified data source, along with their resource usage and dates of access. Also allows you to drill down on a procedure name to see request information for that procedure and the actual request syntax. |
Data Sources Report by Resources Used
Understanding the patterns of resource usage at your site, including CPU and elapsed time, I/Os, and rows returned, can be helpful in several ways. This information can help you determine which data sources might be good candidates for pre-joining, pre-aggregation, or denormalization, and help you decide which data to index. In addition, you can monitor users and inform them of their resource usage to encourage them to plan their requests more efficiently. Accessing the Data Sources report category by the Resource Utilization mode of analysis can help you with all of these issues.
The following image shows the Data Sources Report by Resources Used, which provides a summary of resource utilization by data source. This report summarizes the resources used by all data sources at your site, including both total and average elapsed time, CPU seconds, I/Os, and returned rows. Click any of the hyperlinked column headings to sort the report by that column.
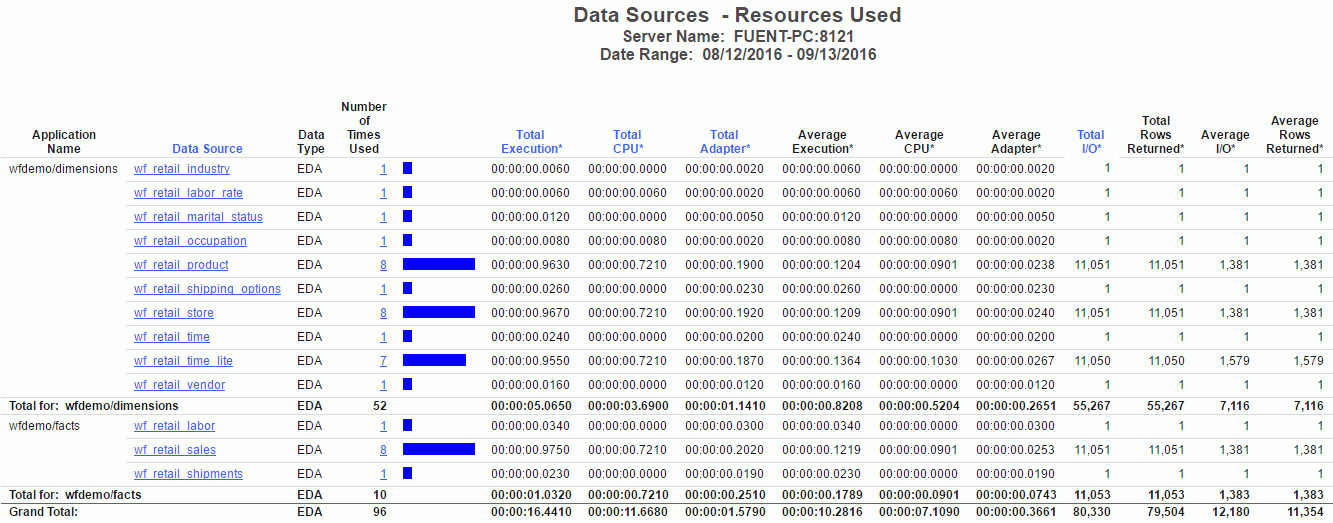
This report has several hyperlinks that allow you to drill down to additional reports, summarized in the following table.
|
Hyperlink in the: |
Report Generated |
Description |
|---|---|---|
|
Data Source column. |
Column Level for Data Source Data Source |
Shows usage for the columns for the specified data source, including whether they were used with functions, relations, selects, sorts, and groups, and how many days the column has been unused. Also allows you to drill down to see more information about when the columns were used. |
|
Number of Times Used column. |
Procedures Using Data Source |
Lists the procedures used to access the specified data source, along with their resource usage and dates of access. Also allows you to drill down on a procedure name to see request information for that procedure and the actual request syntax. |
Data Sources Report by Historical Use
The accessibility of a web environment makes rapid growth of your user base inevitable. As more users are accessing more data, monitoring site activity becomes more important, offering you information about the following areas:
- How much data is being requested.
- What the busiest times of the day, week, and month are.
- Which users are most active against which data sources.
- What standard response times have been.
Accessing the Data Sources report category by historical analysis lets you analyze user activity to determine the peaks and valleys in system usage, supplying you with a solid basis for deciding how to schedule requests, educate users, and so on.
The following image shows the Data Sources Report by Historical Use, which provides information on historical activity by data source. This report summarizes request activity by year and month for all accessed data sources at your site. Click any of the hyperlinked column headings to sort the report by that column.
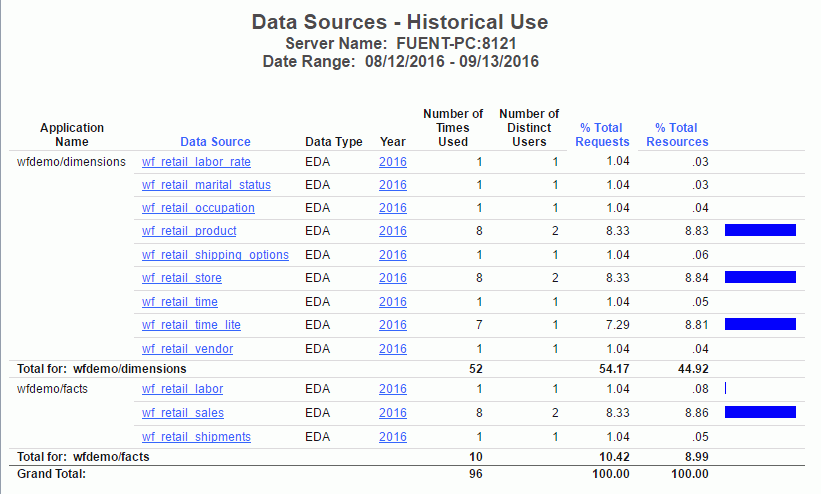
This report has several hyperlinks that allow you to drill down to additional reports, summarized in the following table.
|
Hyperlink in the: |
Report Generated |
Description |
|---|---|---|
|
Data Source column. |
Column Level for Data Source Data Source |
Shows usage for the columns for the specified data source, including whether they were used with functions, relations, selects, sorts, and groups, and how many days the column has been unused. Also allows you to drill down to see more information about when the columns were used. |
|
Year column. |
Data Access for Data Source during Year |
Shows data access information for the specified data source and year, including number of requests, elapsed processing time, CPU seconds, I/Os, and rows returned. Also allows you to drill down on a specific date (month, day, and year) to see request information for that date as well as the actual request syntax. |
Data Sources Report by Top N
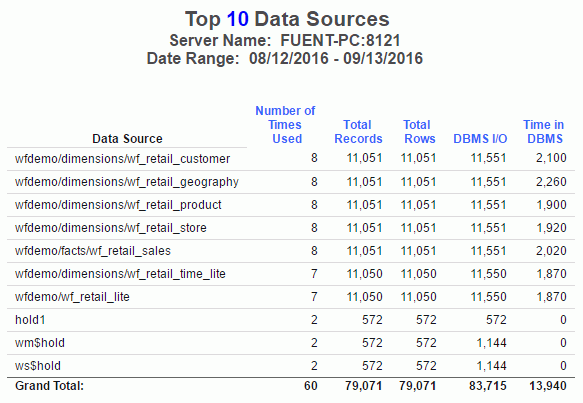
The following image shows the Data Sources Report by Top n, which shows the top number of data sources used by the user. The number of data sources is specified in the Top number drop-down menu of the Report Filter. The available options for top number are 5, 10, 15, 20, and 25. The default value is 10.
Errors and Messages
The Errors and Messages report provides an overview of error messages that Resource Management has monitored.
The following image shows the Errors and Messages report.
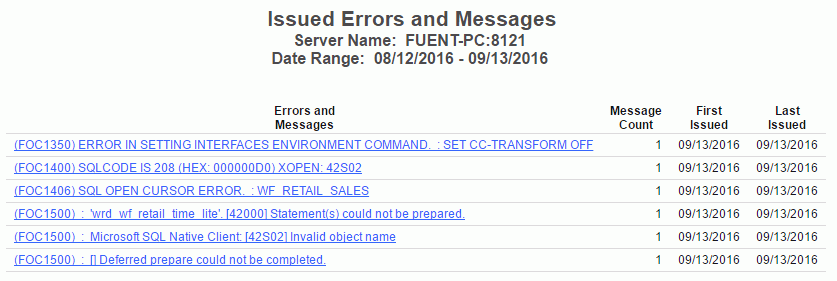
This report has one hyperlink that allows you to drill down to other reports, as described in the following table.
|
Hyperlink in the: |
Report Generated |
Description |
|---|---|---|
|
Errors and Messages column. |
Errors and Messages |
Shows the procedure and command count by user for the specified error message. You can drill down into procedures that issued the messages or to the command that issues the message, and then to all of the messages issued for the selected procedure. |
If you click the hyperlink in that report, you generate a final report which shows the error message in red. Click the red hyperlink to open the All Messages report, which shows all of the messages generated by the selected procedure.
Procedure with Errors
The Procedure with Errors report provides information on error situations by Procedure Name.
The following image shows the Procedure with Errors report.
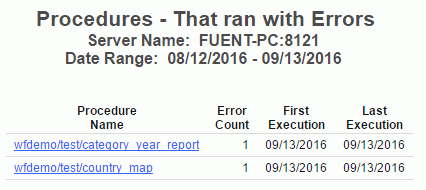
This report has one hyperlink that allows you to drill down to another report, as described in the following table.
|
Hyperlink in the: |
Report Generated |
Description |
|---|---|---|
|
Procedure Name column. |
Requests Executed with Errors |
Provides a list of requests that resulted in an error. |
If you click the hyperlink in the Requests Executed with Errors report, the Error Message report opens. This report shows all of the error messages generated.
Domain Usage Report
The summary version of the report displays the domain name, the number of reports from the domain that have been monitored, the number of users that have run domain reports that have been monitored, the average execution time of all of the monitored reports in the domain, and the average CPU time used by all of the monitored reports in the domain. The following image shows the Domain Usage report.

This report has two hyperlinks that allow you to drill down to additional reports summarized in the following table.
|
Hyperlink in the: |
Report Generated |
Description |
|---|---|---|
|
Domain column. |
Domain by Report Summary report |
Provides the high level name of the reports that have been monitored, the number of times the report has been run, the average execution time the report used, the average CPU time used, the total number of rows returned by all of the executions, and the number of database records processed by all executions of the report. Also allows you to drill down further to view the report names that have executed. |
Change Impact for Column Report
It is very useful to determine in advance which users and applications will be most affected by impending data source schema changes. The Change Impact for Column reports determine how data-source modifications affect users and their applications.
Once you select the report, select the column for which you want to examine information under the Column name drop-down menu and click View Report. Any use of a column with that name in any monitored table is reported.
The report window opens, as shown in the following image. This report summarizes the procedures used to access the specified column.
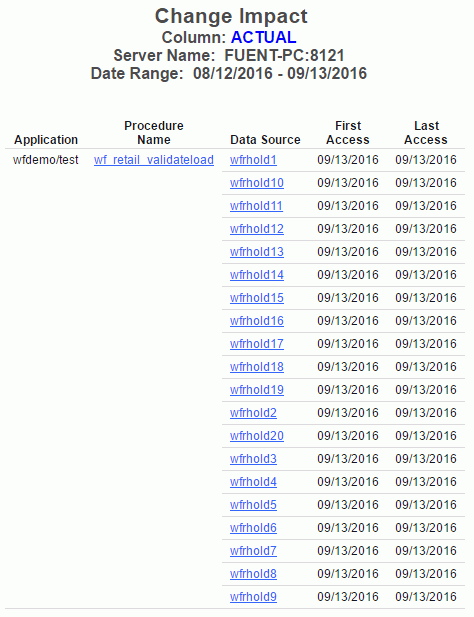
This report has two hyperlinks that allow you to drill down to additional reports summarized in the following table.
|
Hyperlink in the: |
Report Generated |
Description |
|---|---|---|
|
Procedure Name column. |
Requests from Procedure Procedure Name |
Shows a variety of information, including date and time, user, CPU seconds, elapsed execution time, I/Os, and rows returned, about the requests made with the specified procedure. Also allows you to drill down further to see the actual request syntax. |
|
Data Source column. |
Column Level for Data Source Data Source |
Shows usage for the columns for the specified data source, including whether they were used with functions, relations, selects, sorts, or groups, or if they were never used. Also allows you to drill down to see more information about when the columns were used. |
Procedure Benchmarks Report
Benchmarking is a process by which you determine whether your site's service level agreements (SLAs) are being met. Use the Procedure Benchmarks reports to identify response times for requests and other information for analyzing site performance.
From the Procedure Name drop-down menu, select the name of the procedure for which you want to examine information and click View Report.
The following image shows the Procedure Benchmarks report appears, as shown in the following image. This report shows information about executions of the specified procedure, including execution date and time, user, CPU and elapsed time, usage type, and client type. Click any of the hyperlinked column headings to sort the report by that column.

Excessive Resources Report
Some of the most helpful information Resource Analyzer can provide is about which requests are using the most resources. This kind of information helps you identify causes of network and machine-use bottlenecks and enables you to decide what data needs to be indexed, what requests need to be scheduled, or which users need to be educated. The Excessive Resources reports help you with this investigation.
For a request to be included in the report, it need only exceed one of the resource values specified, not all. Specify criteria to limit your report to information on requests that consume resource usage values above a certain average, and click View Report.
The following image shows the Excessive Resources report. This report lists the most resource-intensive procedures: those whose average resource usage values, including CPU seconds, elapsed time, I/Os, and rows returned, exceed at least one of the limits you specified. The report also lists the average resource usage values for each procedure. Click any of the hyperlinked column headings to sort the report by that column.
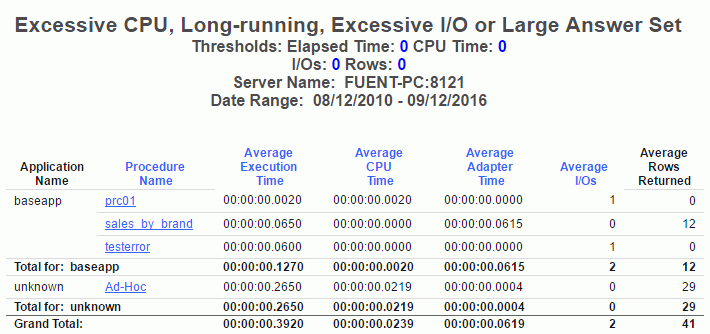
This report has one hyperlink that allows you to drill down to another report, as described in the following table.
|
Hyperlink in the: |
Report Generated |
Description |
|---|---|---|
|
Procedure Name column. |
Requests from Procedure Procedure |
Lists the date and time, user, and resource information for each request of the specified procedure. Also allows you to drill down further to see the actual request syntax. |
Long-running Requests Report
Procedures with long running requests use excessive resources, a particular problem when dealing with operational systems. These procedures should be targeted for optimization.
The following image shows the Long-running Requests report. By default, the report is sorted by Average Elapsed Seconds and Average CPU Seconds.

This report has one hyperlink that allows you to drill down to another report, as described in the following table.
|
Hyperlink in the: |
Report Generated |
Description |
|---|---|---|
|
Procedure Name column. |
Requests from Procedure: Procedure Name |
Shows the requests that were executed from the selected procedure. Also allows you to drill down further to see the actual request syntax. |
Large Volume Requests Report
Large volume requests are requests that return more data than might be necessary. These requests can be targeted for optimization. You can identify these reports with the Large Volume Requests report.
The following image shows the Large Volume Requests report. By default the report is sorted by the highest Average Rows.

This report has one hyperlink that allows you to drill down to another report, as described in the following table.
|
Hyperlink in the: |
Report Generated |
Description |
|---|---|---|
|
Procedure Name column. |
Requests from Procedure Name |
Shows the requests that were executed from the selected procedure. Also allows you to drill down further to see the actual request syntax. |
Dormant Data Report
Dormant data, or data that is very infrequently accessed, can slow response times on your site. Use the Dormant Data reports to identify which data sources and columns have been less recently or never queried and can be deleted or archived to improve performance.
The following image shows the Dormant Data report. This report shows a variety of information about each data source, such as number of requests, users, resource usage, and access dates. The Days Since Used column indicates the number of days that have passed since the data source was last accessed. By default, the report is sorted by access dates, with those data sources that have no access dates (and are therefore dormant) listed first, and includes all data sources in the application path, including those that aren't being monitored.
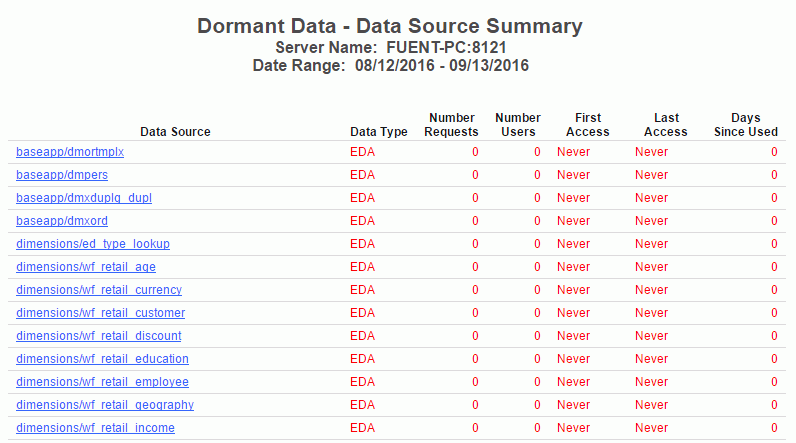
This report has one hyperlink that allows you to drill down to another report, as described in the following table.
|
Hyperlink in the: |
Report Generated |
Description |
|---|---|---|
|
Data Source column. |
Dormant Data Summary: Column Level for Data Source |
Shows which columns were never accessed in the specified data source, and also lists all accessed columns along with last access time in days. Shows usage for the columns, including whether they were used with functions, relations, selects, sorts, and groups. |
Excessive Joins Report
Joining too many tables can be slow and costly. Denormalization can be an effective method for cutting CPU time and improving response times. The Excessive Joins reports help you determine which data is most frequently joined by user requests and help you decide how to plan your de-normalizing strategies.
The following image shows the Excessive Joins report. This report lists the most frequently joined data sources along with the procedures used to join them.
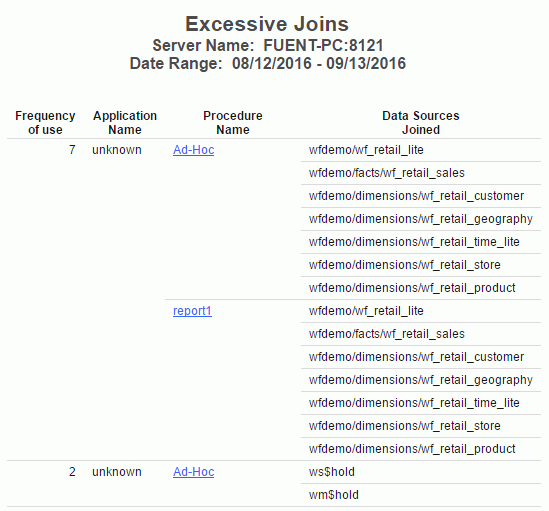
This report has one hyperlink that allows you to drill down to another report, as described in the following table.
|
Hyperlink in the: |
Report Generated |
Description |
|---|---|---|
|
Procedure Name column. |
Requests from Procedure Joining Data source1, Data source2, Data sourcen |
Shows a variety of information, including date and time, user, CPU seconds, elapsed execution time, I/Os, and rows returned, about the requests making the specified join. Also allows you to drill down further to see the actual request syntax. |
Repeated Aggregations Report
Efficiencies can be created by calculating column values once and storing the results in summary tables for repeated use. This saves the cost of calculating these values every time a report is run.
The following image shows the Repeated Aggregations report. This report shows how many requests used different functions on certain columns of data sources, along with the dates of access. Click any of the hyperlinked column headings to sort the report by that column.
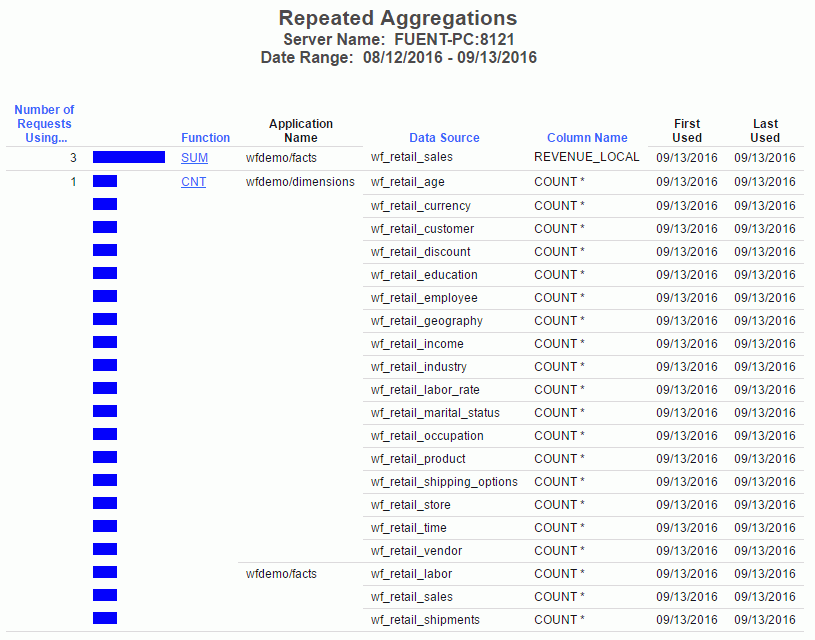
This report has one hyperlink that allows you to drill down to another report, as described in the following table.
|
Hyperlink in the: |
Report Generated |
Description |
|---|---|---|
|
Function column. |
Procedure Summary - Frequency of Use Using Function on Data Source.Column Name |
Summarizes the procedure types (Application and Ad_Hoc) that have executed the specified function for the specified data source and column, along with statistics about each execution. Also allows you to drill down further to see a list of the cataloged procedures and information about them. |
Optimization
For WebFOCUS language reports, for example, TABLE FILE, that are run against a relational data source, the drill-down options in this report lead users to a report that will show the original code, which is translated SQL with a drill-down link to any aggregation messages.
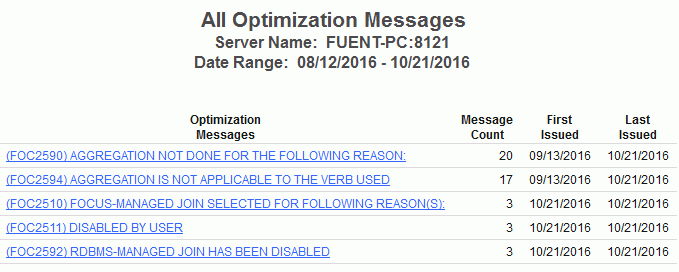
This report has one hyperlink that allows you to drill down to another report, as described in the following table.
|
Hyperlink in the: |
Report Generated |
Description |
|---|---|---|
|
Optimization Messages column. |
All Optimization Messages |
Shows the procedure and command count by user for the selected message. |
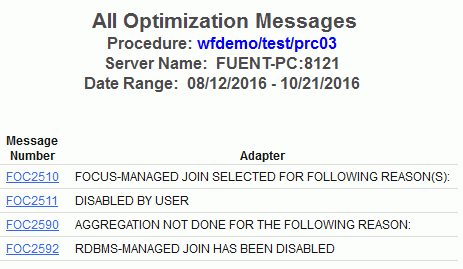
If you drill down on the Command Count hyperlink, a report opens that lists the Command Names. If that column has an active drilldown, you can click that link and open the Original/Translated/Messages report, as shown in the following image.

The following columns are available:
|
Column |
Description |
|---|---|
|
Original Request |
Shows the original request contents. |
|
Translated Request |
Shows the SQL that was sent to the RDBMS, if the original request was for a relational table. |
|
Messages |
Indicates if any messages were issued for this request. |
If you click the drilldown in the Messages column, the report shows that the reason the request was not optimized is because optimization was disabled by the user, as shown in the following image.
Candidates for Column Index Report
Indexing columns that are frequently used in selection criteria for reports can improve efficiency. This report identifies columns that should be indexed.
This report shows how often columns were used as selection criteria in requests, as shown in the following image. Click any of the hyperlinked column headings to sort the report by that column.

Bandwidth by Procedure Report
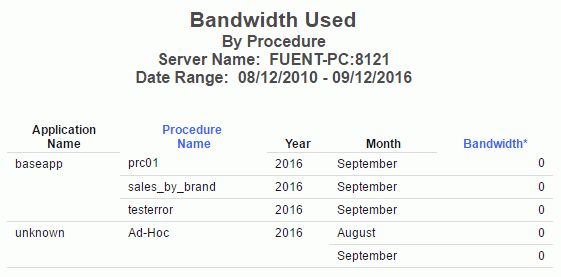
The Bandwidth by Procedure report shows the number of bytes retrieved to the web server for requests. The report analyzes the bandwidth by database type for each year/month combination.
The following image shows the Bandwidth by Procedure report.
Resources by Connection
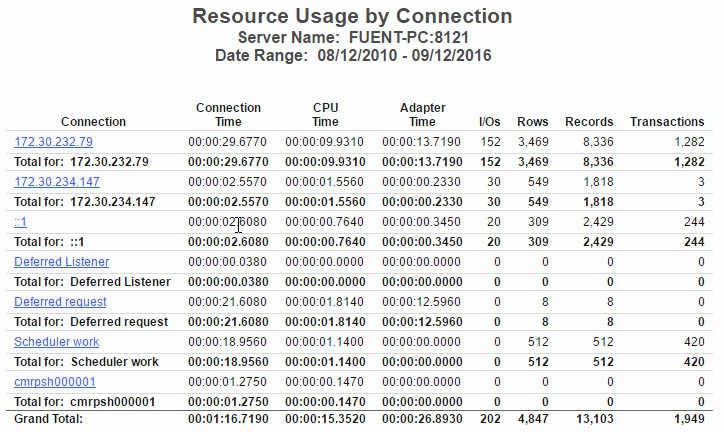
Resources by Connection report shows the resources consumed by the different IP connections.
The following image shows the Resources by Connection report.
This report has one hyperlink that allows you to drill down to another report, described in the following table.
|
Hyperlink in the: |
Report Generated |
Description |
|---|---|---|
|
Connection column. |
Resources by Connection in Network Node |
Shows the resources for each connection address. |
Cumulative Hourly Use and Peak Transaction/Resource Periods Reports
These graph reports allow you to determine transaction-bottleneck periods of request activity or resource usage by different time periods.
You can filter a report by data source name and/or user name by selecting a valid data source name and/or user name from the drop-down menu, or by selecting ALL, to indicate all data sources and all users. The default is ALL. After you select your data sources or accept the default, click View Report.
Query Volume vs. Resource Utilization Report
Un-tuned queries frequently return more data than necessary. Identify the procedures running these requests and target them for optimization.
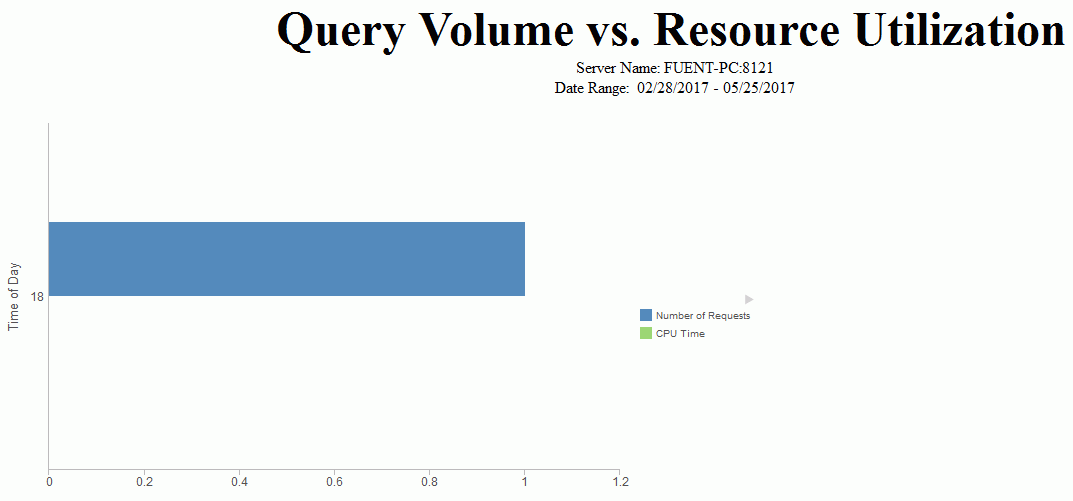
This report compares the number of requests to one of four factors of resource usage: CPU seconds, elapsed execution time in seconds, rows returned, and I/Os (all mapped on the vertical axis). This information is shown for each hour of the day, with the hours mapped along the horizontal axis. The values on the vertical axis are cumulative for the time period of the dates you select for Usage Monitoring data for reports. For more information on setting report date ranges, see How to Set Selection Criteria Dates for Reports.
By default, the first graph that appears shows requests graphed against CPU Time.
The following image shows the Query Volume vs. Resource Utilization Report.
| WebFOCUS | |
|
Feedback |