Navigating the Enterprise Usage Monitor Environment
|
Topics: |
This topic describes how to navigate the Enterprise Usage Monitor (EUM) portal and gives an overview of the content items you can access here.
Navigating the Enterprise Usage Monitor Environment
|
Topics: |
It is also important to understand that Manager users, Developers, Advanced users, and Basic users have different access to environment options. That access is determined by the group of users to which you are assigned.
Navigating the Enterprise Usage Monitor Portal
|
Topics: |
When you access the Enterprise Usage Monitor environment, using the Sign-in page or browser URL, you are presented with the EUM Portal. From the portal, depending on your user role, you can create and edit content, view content that other users published or shared, create and edit personal pages, manage users, configure the system, upload files to the repository, connect to data and edit data, and access interactive help and instructional materials.
The main components of the EUM Portal include a Getting Started Domain, Home Page, Real Time RMLDATA Static Page, Real Time RMLDATA Dynamic Page, Performance Dashboards Page, Resources tree, and Menu bar.
Home Page
The Home Page is the first page that you see when you sign in. The Getting Started domain, shown in the following image, automatically launches when you sign in to WebFOCUS EUM with the username and password that you created during the installation.
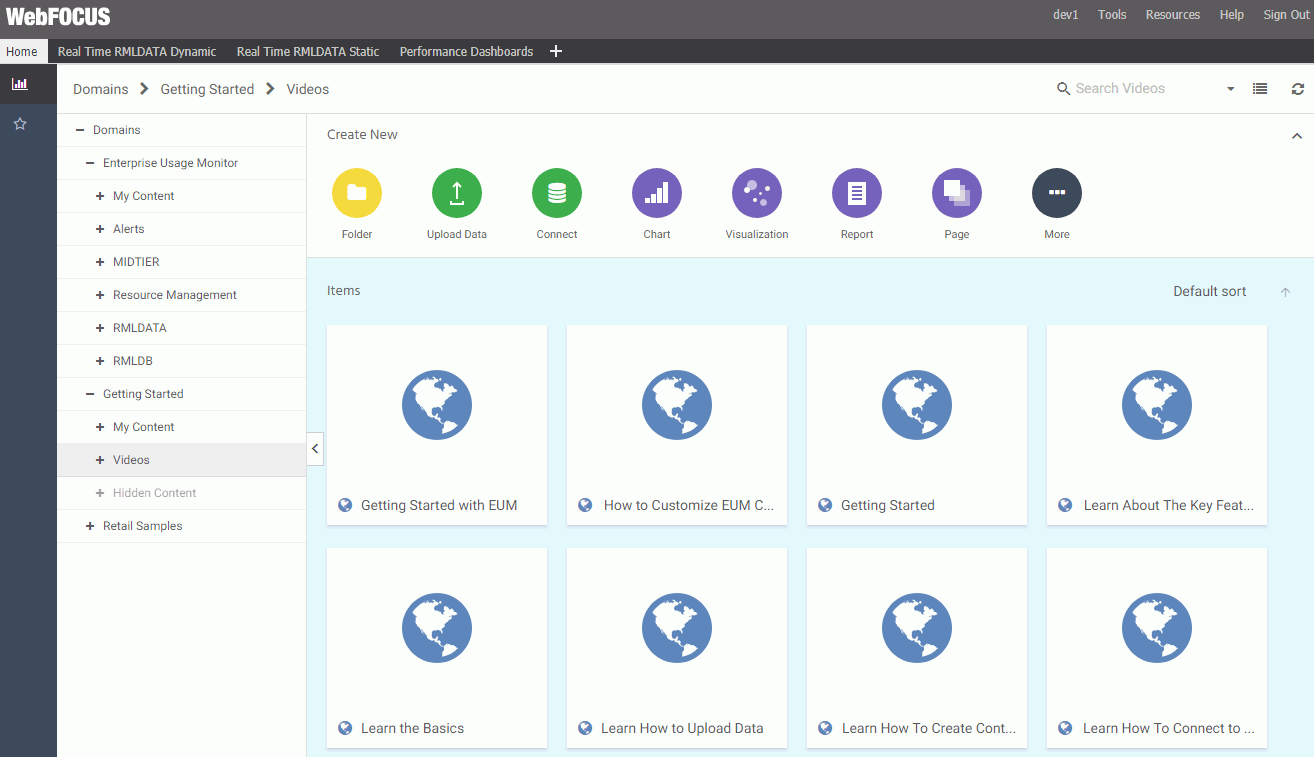
The Home Page has three sections with which you can interact:
- Menu bar
- Resources tree
- Actions Bar
The content in these sections varies, depending on your user type.
Menu Bar
The Menu bar is located in the upper-right section of the screen, inside the top banner. The following image shows the Menu bar that appears when you are signed in as a Manager.
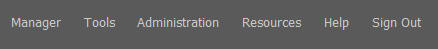
The Menu bar gives you access to the following options:
- Change your password (click your username).
- Tools:
- View the status of deferred reports, and manage them.
- Stop your outstanding interactive requests that are running.
- Access Session Viewer, where you can visualize the attributes of the current web session.
- Access the ReportCaster Status, where you view the status of your scheduled jobs and log reports.
- Administration:
- Access the Security Center, where you define users and groups and grant access permissions.
- Access the Administration Console, where you configure, administer, and monitor the components of the WebFOCUS application.
- Access the Reporting Server Console, where you can view and manage the server environment.
- View and administer the private resources for groups and users.
- Switch between Normal mode (seeing your own content) and Manager mode (managing other user content).
- Open the Resources tree on the right side of the window, so you can manage content on Personal Pages.
- Access the online Help, Information Center, a library of Help topics, self-service videos, Community, Information Builders Home page, as well as information about the WebFOCUS Enterprise Usage Monitor application, version, and available licenses.
- Sign out.
Resources Tree
|
Topics: |
The Resources tree, located on the left side of the Home Page, contains your available resources, such as domains, folders, and content. The following image shows the Resources tree that appears when you are signed in to WebFOCUS Enterprise User Monitor.
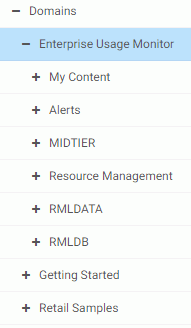
The resources are secured using the security model, that is domain-based, similar to that of desktop operating systems. The resources differ for every user. For example, the Basic User sees only public content.
You can expand or collapse folders by clicking the plus (+) or minus (-) sign . When you click a folder, its contents display in the content area. You can also right-click a folder to access a shortcut menu of available options. From the shortcut menu, you can perform the following actions:
- Expand or collapse a folder
- Duplicate a folder
- Cut or copy a folder
- Paste content or another folder inside a folder
- Delete a folder
- Allow or suppress access to a folder
- Show or hide a folder
- Configure security rules for a folder
- View and edit properties for a folder
The Resources tree contains the Domains node, which lists the domains and folders that you have created. The Enterprise Usage Monitor comes with the following three default domains:
- Enterprise Usage Monitor
- Getting Started
- Retail Samples
The purpose and contents of each domain are described in the sections below.
Enterprise Usage Monitor Domain
The Enterprise Usage Monitor domain is a read-only domain that contains content for analyzing resource management data. If you want to modify this content, you can safe updated versions of it in a new domain or My Content folder. The Enterprise Usage Monitor domain is comprised of the following folders:
- My Content
-
A folder intended for reports, output, and schedules created by a user.
- Alerts
-
Contains Alert templates for Average Response Time, Average Response Time by User, and DBMS Time.
- MIDTIER
-
Contains a visualization that is used in the Midtier dashboard inside the Real Time RMLDATA Static and Real Time RMLDATA dynamic pages.
- Resource Management
-
Provides access to the Resource Analyzer HTML document where you can run a series of Resource Management reports.
- RMLDATA
-
Contains content items built using the RMLDATA data file, which shows your current real-time data. This folder also contains the following dashboards:
- Designer Dashboards. Contains all of the content that can be seen in the Performance Dashboards.
- Executive KPI IDA. Shows the usage KPIs in an In Document Analytic (IDA) dashboard. There is one filter available for Data that is applied to all content on the dashboard.
- Infographics. Contains two runtime Infographics that visually highlight performance for your environment.
- RMLDB
-
Contains content items built using the RMLDB data source, which shows your historical data.
Getting Started Domain
Using the Getting Started domain you can build your own content and test various report procedures. This domain is included with the standard Business User Edition product.
Retail Samples Domain
The Retail Samples domain is a read-only domain that contains sample of content that was created using InfoAssist and App Studio, such as reports, charts, documents, visualizations. It also provide a URL to the demo videos that explain how you can create these items. This domain is included with the standard the Business User Edition product.
Actions Bar
You can use the actions bar to create analytical content, upload files and spreadsheets, connect to data, build portals and pages, schedule procedures, and generate sample content using the options available to you for a domain or folder. The following image shows an example of the actions bar a user has when accessing the Getting Started domain.
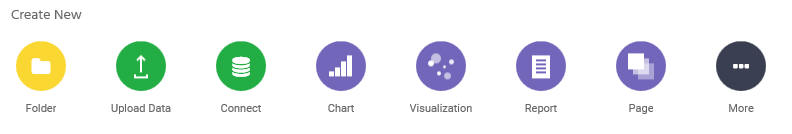
The default view of the actions bar displays the most common options available to you. You can access additional options by clicking More.
The actions bar only displays the items that you can create for the domain or folder that is currently selected. If you click the Domains node, the actions bar only displays the Domain and Folder options. The items that display on the actions bar are also a subject to permissions. You can only see the items that are available to you based on your role.
Real Time RMLDATA Static and Dynamic Pages
The Real Time RMLDATA Static and Real Time RMLDATA Dynamic pages show the same content, but use different intervals in which the data is refreshed. The static page refreshes every time you load the page, so you can use it for analysis. The dynamic page automatically refreshes every 30 seconds. You can use it to view the resource management data in real time. All of the reports shown on these pages can be sorted in ascending or descending order. Each page contains the following dashboards:
- Metrics by User
The Metrics by User dashboard is shown in the following image.

The Metrics by User dashboard contains a visualization comprised of content along the top row that shows core metrics (DBMS, CPU, Elapsed, and Server Time) utilization by User. The charts in the middle of the dashboard show performance by both data and hour, and are color coded by DBMS, CPU, elapsed and server time, and the total number of users, The bottom report shows information on core metrics by user ID. You can use the filter panels on the right to narrow your results to a specific date and time, user ID, server name, and agent service name.
- Response Times by Datetime
The Response Times by Datetime dashboard is shown in the following image.

The charts on the Response Time by Datetime dashboard show how many reports are being run by user ID, core metrics by hour, and core metrics by user ID. The reports on the bottom of the dashboard show four types of response times (Average, Mean, Min, and Max) by date and by reporting server. You can use the filter panels on the right to narrow your results to a specific user ID, start date, start hours, server name, and agent service name.
- Metrics and Average Response Times
The Metrics and Average Response Times dashboard is shown in the following image.

The series of horizontal charts across the top of the Metrics and Average Response Times dashboard show core metrics (DBMS, CPU, Elapsed, and Server time) by time and hour. The report and charts in the left middle show core metrics and average user response time by user ID and server. The line chart on the bottom shows user average response time by date and time. This chart is intended give a summary of how well the system is performing at a given time. You can also use the filter panels on the right to narrow your results to a specific start date, start hour, user ID, server name, and agent service name.
- Mid-tier
The Mid-tier dashboard is shown in the following image.

The Mid-tier dashboard represents activity on the WebFOCUS mid-tier. The line chart on top shows the mid-tier CPU utilization by time. The horizontal bar charts show core metrics (CPU, DBMS and Web Tier time) by user and time. The report on the bottom-right shows the domains and procedures users run, and the time they run them. You can use the filter panels on the right to narrow your results to a specific user ID, hour and minute range.
Performance Dashboards
The Performance dashboards tab contains pages with dashboards that represents the activity occurring in your environment. The available dashboards show metrics by user ID, server, time, or web application server. You can use the filter drop-down menus, shown in the following image, to narrow down your results to a specific user ID, server, data, hour, agent, and request name.

These filters are applied globally and affect all dashboards on the Performance Dashboard portal page.
When viewing charts on these pages, note that any chart that measures metrics by user ID are auto link enabled drill-down reports. This allows you to drill down to a User Detail report that shows the procedure name and procedure for each metric. To access this report, right-click the metric and click User Details.
There are also active reports available on the Time Focus and Web Browser Focus pages, respectively. When working with an active report, you can:
- Sort data within any column in ascending or descending order.
- Make a comment on a specific data field. A comment will be indicated by an asterisk (*) next to the field.
- Highlight a data field or row.
- Remove the highlight from all fields or rows.
- Filter the data.
The Performance Dashboard page contains the following dashboards:
- User Focus
The User Focus dashboard is shown in the following image.
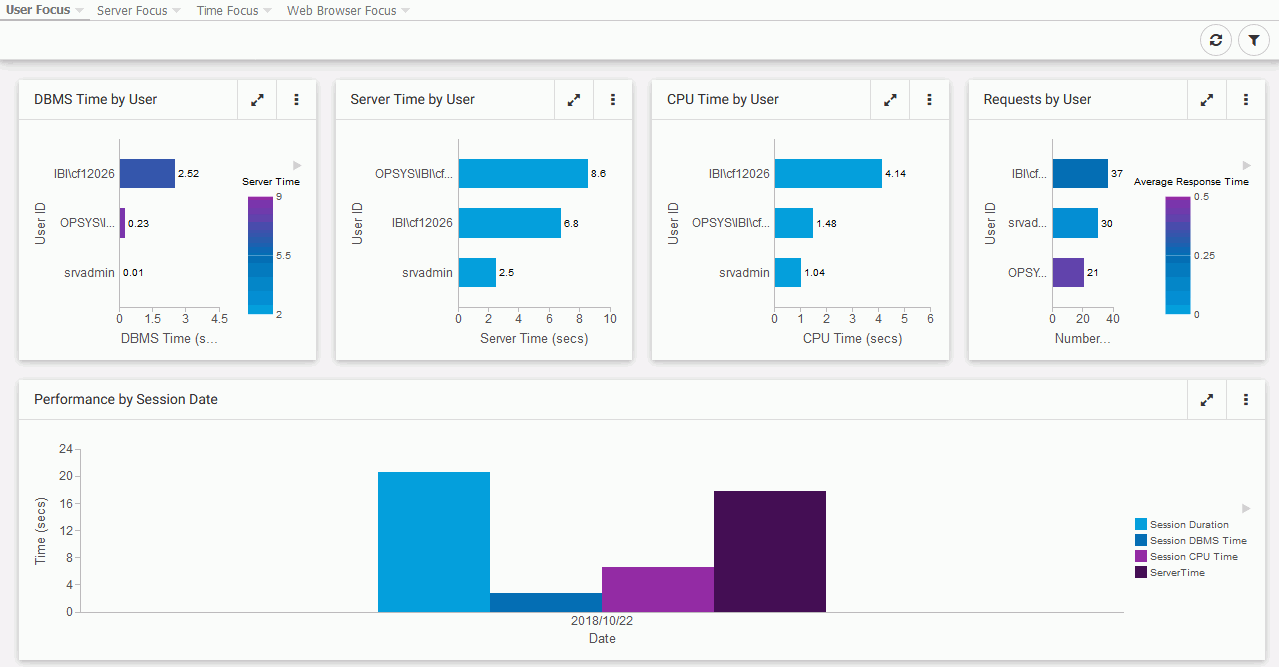
The User Focus dashboard contains a visualization comprised of content along the top row that shows core metrics (DBMS, server time, CPU time, and requests) by user ID. The remaining charts in the dashboard show performance metrics by session date, user, and session hour.
Note: The selected filter values are propagated to the drill-down report.
- Server Focus
The Server Focus dashboard is shown in the following image.
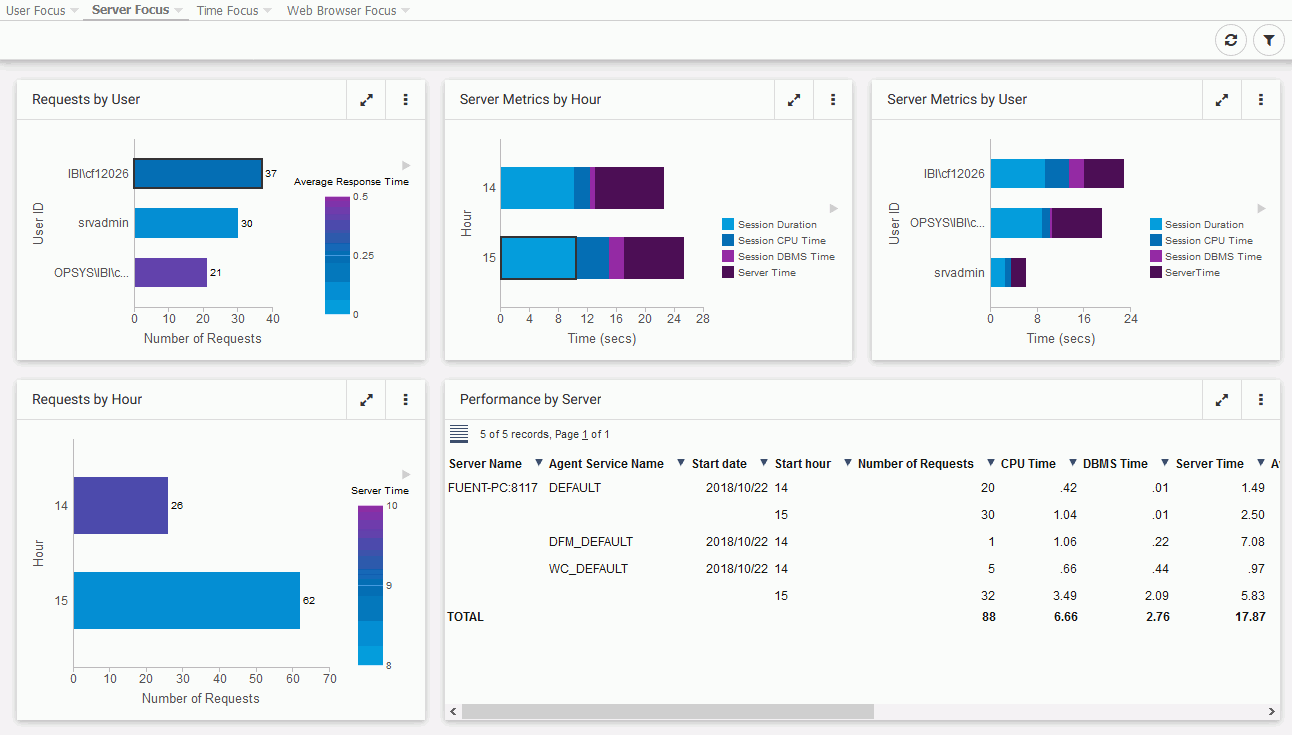
The charts on the Server Focus dashboard show core metrics by server. The top row shows the number of requests made by a specific user, core server metrics (duration, CPU time, DBMS, and server time) by hour, and core server metrics by user. The bottom row shows the number of requests made by the hour, along with an active report that shows the performance statistics of the server as a whole.
- Time Focus
The Time Focus dashboard is shown in the following image.
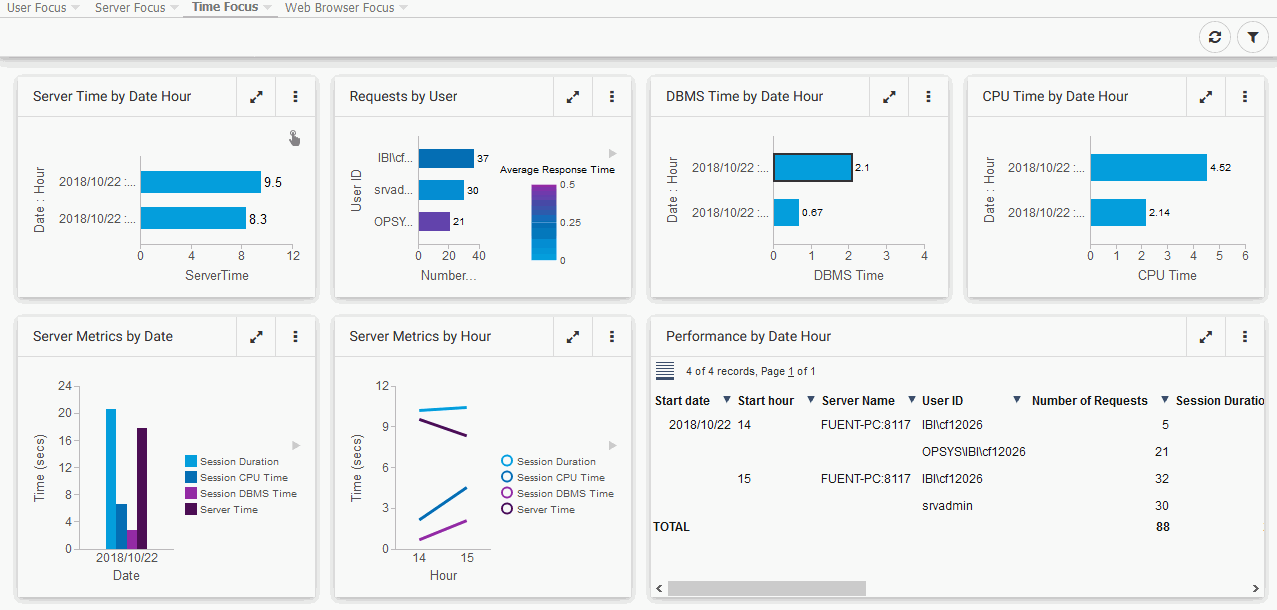
The Time Focus dashboard represents metrics by time.
- Web Browser Focus
The Web Browser Focus dashboard is shown in the following image.
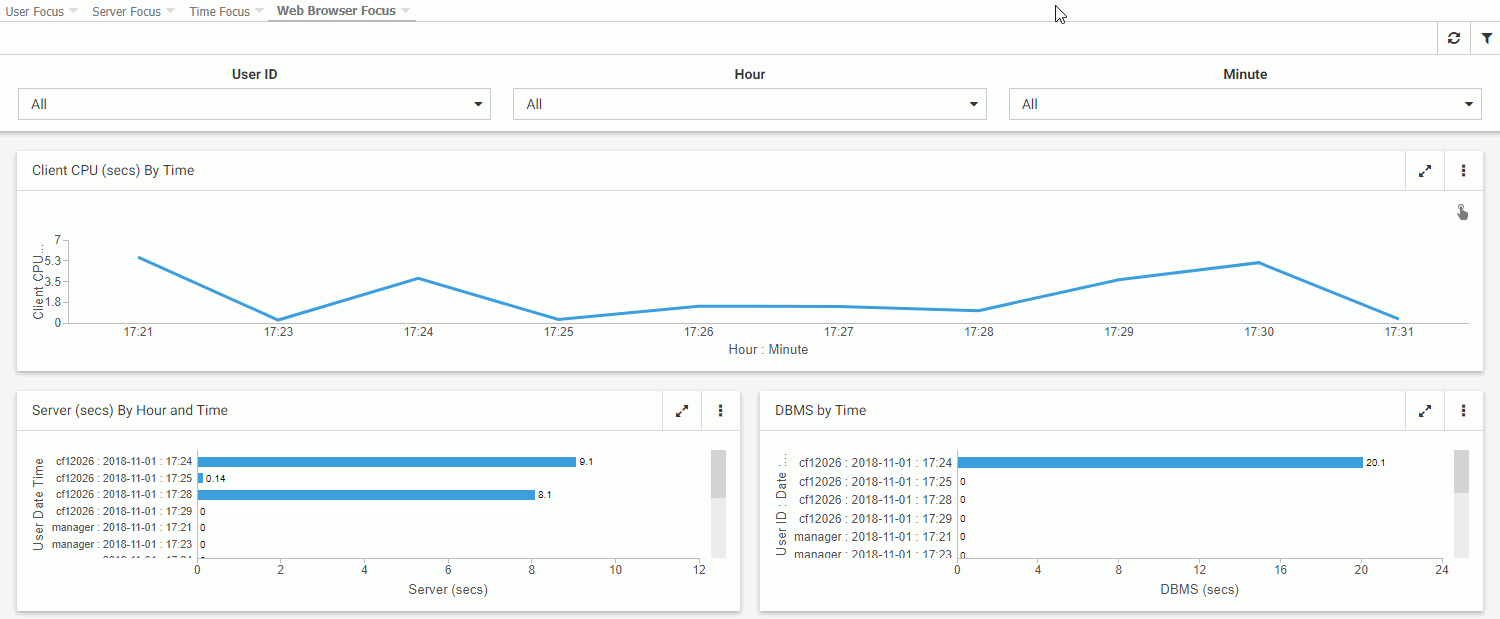
The Web Browser Focus dashboard represents metrics used on the web or server application, and focuses on the client CPU, as well as the web tier by time.
| WebFOCUS | |
|
Feedback |