Using Data Preparation Options
|
Topics: |
The Upload wizard and Connect to Data wizard offer a suite of data preparation options, which are designed to help you prepare your data for future analytics. With these data preparation tools, you can assess your data for validity and consistency, troubleshoot errors, and enhance accuracy and uniformity of your data. The following sections describe these options and explain how to use them.
Creating Clusters
|
How to: |
When you need to add more tables to your synonym, you can use the Join feature to create a cluster. This allows you to enhance the structure of your synonym by introducing more data.
Procedure: How to Create a Cluster
- When uploading data or connecting to data on the main metadata screen, on the ribbon, click Join Editor.
The Join Editor view opens.
- Click Insert Child.
The Insert Child dialog box opens.
- Click a Master File from the list, select a synonym, and then click OK.
You can select several synonyms at once.
An example of a completed cluster is shown in the following image.
- Close the Join Editor dialog box.
The new columns are added to the Table/Column pane.
- Drag columns to the Business View pane to modify the synonym.
Pivoting Repeating Columns Into Rows
|
How to: |
Some Excel spreadsheets may contain repeating columns, such as sales figures for a series of years. There may even be repeating column groups, such as both budget and actual figures for a series of years. You can use the pivot option to transform these columns or groups of columns into rows.
Procedure: How to Pivot Columns Into Rows
- When uploading data or connecting to data on the main metadata screen, on the ribbon, click Pivot.
The Pivot Columns to Rows dialog box opens.
- Set the Pivot Type option to Repeating column.
- In the First column drop-down box, select the first column in the range of repeating columns.
- In the Last column drop-down box, select the last column in the range of repeating columns.
- In the Column Title for Pivoted Data, type the new column title that reflects the numeric cell that you are describing.
- In the Title for Pivoted Key field, type the new column title that represents the repeating columns that you are pivoting into rows.
- Leave the Formula for Pivoted Key field value unedited.
This value is automatically generated by the wizard, it should not
be changed.
An example of the completed configuration for pivoting columns is shown in the following image.
- Click OK.
The repeating columns now display as rows. The Pivot button turned into the Remove Pivot button, allowing you to quickly revert your pivoting changes.
Procedure: How to Pivot Column Groups into Rows
- When uploading data or connecting to data on the main metadata screen, on the ribbon, click Pivot.
The Pivot Columns to Rows dialog box opens.
- Set the Pivot Type option to Repeating group of columns.
- In the Number of groups field, specify the number of groups of columns that you are pivoting.
- In the Column Title for Pivoted Data, type the new column title that will be used for all the columns across the repeating groups.
- In the Title for Pivoted Key field, type the new column title that represents the repeating columns that you are pivoting into rows.
- Edit the automatically generated formula in the Formula
for Pivoted Key field by clicking the ellipsis button. Make sure
there are no repetitive alphanumeric values in the Pivoted Column
field.
An example of the completed configuration for pivoting groups of columns is shown in the following image.
- Click OK.
The repeating groups of columns now display as rows. The Pivot button turned into the Remove Pivot button, allowing you to quickly revert your pivoting changes.
Creating Folders and Assigning DV Roles
|
Topics: |
When using BV+, specifically when you are working in a Business View, you can create folders to organize your data. Folders function as segments to provide a view of the synonym and define the accessible fields and their relationships. Folder relationships are the same as segment relationships, with parent folders, child folders, and sibling folders. Once you create a new folder, you can add data fields and assign roles.
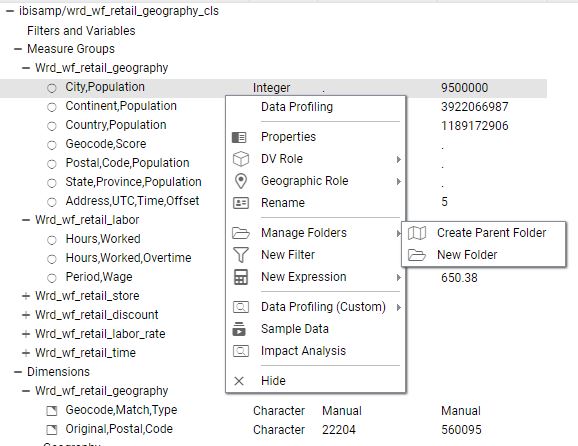
You can create a new folder by right-clicking a folder or field, clicking Manage Folders, and then clicking New Folder, as shown in the following image.
Assigning DV Roles
While you have total flexibility defining a structure using any fields from your data source, when you issue a report request against the synonym, the retrieval path for the data must conform to any constraints imposed by your DBMS entity diagrams and by the rules of retrieval.
By default, a Dimension View structure is defined within folders in the Business View pane. You can add either additional Dimension View nodes or folders to this structure.
You can assign a DV role to a folder or field by right-clicking the folder or field and assigning a DV role. The following image shows the context menu and options for a folder.
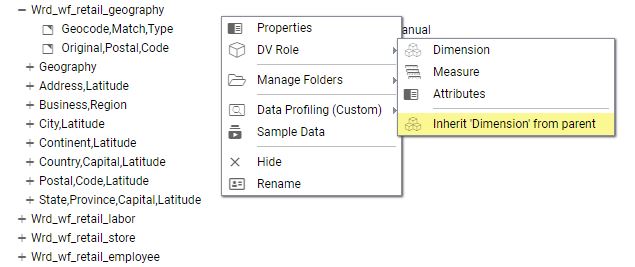
You can explicitly assign a DV role to a folder or field, or have it automatically inherit its role from its parent. If you explicitly assign a DV role, that role moves with the object if you drag it to another location within the BV+ structure. If you do not explicitly assign a DV role, the role changes as you move the object under a new parent, except if you drop it onto a field with the Drill Level role. If dropped onto a Drill Level field, the moved field inherits the Drill Level role.
You can assign the following DV roles.
- Dimension. A dimension field, when double-clicked or dragged onto the report or chart canvas, is automatically added to the request
as a vertical (BY) sort field.
A folder can be assigned the role Dimension.
A field can be assigned the role Dimension (Standalone) or Dimension (Drill Level). When it is assigned the role Dimension (Drill Level), it becomes part of a hierarchy, where the levels depend on the order of the fields in the folder. Then, when AUTODRILL is turned on, automatic drill-downs are created in the report or chart output..
A folder can contain only one drill level hierarchy. However, you can use the same fields in multiple hierarchies by placing each hierarchy in a separate folder. A folder with a drill level hierarchy is not limited to just the hierarchy. It can contain other fields with different DV_ROLEs.
- Measure. A measure field, when double-clicked or dragged onto the report or chart canvas, will automatically be added to the request as an aggregated value (SUM), if it is numeric. If it is alphanumeric, it will be added as a vertical (BY) sort field. A folder or field can be assigned the role Measure.
- Attribute. An attribute field, when double-clicked or dragged onto the report or chart canvas, will automatically be added to the request as an aggregated value (SUM), if it is numeric, or as a vertical sort field (BY), if it is alphanumeric.
- Folder. A folder is a virtual segment in a BV+. It can be assigned the roles Dimension, Measure, or Attribute.
Note: When a folder is inserted as a child of a field, the attribute PARENT_FIELD describes this relationship. By default, such a folder and its fields will be assumed to have the Attribute role.
| WebFOCUS | |
|
Feedback |