Using the Auto Linking Feature to Link Content
|
How to: |
Auto Linking makes it easy to connect reports and charts in your development environment, expanding the reporting capabilities of your organization. Using Auto Linking, you can dynamically link HTML reports, active reports, and HTML5 charts with a single report or chart of any format, based on their common sort (BY) fields and parameters referenced in any filters. It is this commonality that dynamically links content in your WebFOCUS repository, allowing you to discover new possibilities in your data, and explore new relationships within your reporting enterprise. In addition, Auto Linking saves development time and effort, because drilldowns do not need to be manually created and maintained.
To use Auto Linking, you must use the Enable Auto Linking option in InfoAssist+ to set the reports or charts that can be auto-linked. In addition, you must also set reports or charts to be Auto Link targets. The options to enable and disable Auto Linking and Auto Link Target functionality are available on the Format tab, in the Auto Linking group, in InfoAssist+.
- The Auto Link Enabled option is activated only when the HTML, HTML5, and active report output format is selected.
- You can open an existing report or chart and enable Auto Linking or set the item as an Auto Link target.
When Auto Link functionality is activated, your reports or charts display a link for each sort (BY) field with qualifying target reports or charts at run time. In Auto Link enabled reports, you must add sort (BY) fields in the BY field container. In Auto Link enabled charts, you can add sort (BY) fields to the Horizontal Axis, Vertical Axis, or Color field containers.
To qualify a report or chart as an Auto Link target, you must include filters that contain the parameters that you selected as the sort field or fields in the enabled report or chart. The parameter names defined in these filters must be the same as the sort (BY) field names in the Auto Link enabled report. When you select a report or chart as the Auto Link Target, it specifies that the parameter information should be catalogued, and will be evaluated when an Auto Link enabled report or chart is run.
For an Auto Link enabled report at run time, the qualifying target reports and charts are those that have filters with parameters for the selected sort field and the sort fields that precede it, which appear to the left. For an Auto Link enabled chart at run time, the target reports and charts are those that have filters with parameters for all sort fields. For run time for both reports and charts, the linked sort field values in the Auto Link enabled report or chart are passed to the Auto Link target report so that it can be filtered by the sort (BY) field values.
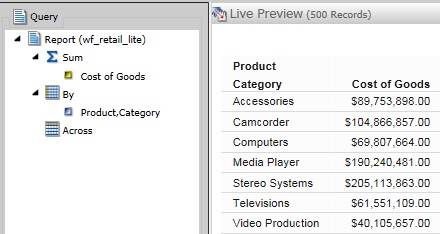
For example, you may have an Auto Link enabled report that contains sort (BY) fields Product Category and Model, with a measure (Sum) field, Revenue. To qualify as an Auto Link target, other reports or charts in your repository can contain a single filter with a parameter for Product Category, or two filters with parameters for both Product Category and Model. When you run the Auto Link enabled report, the Product Category field will link to target reports or charts that have a filter with a parameter for Product Category and the Model field will link to target reports or charts that have filters for both Product Category and Model.
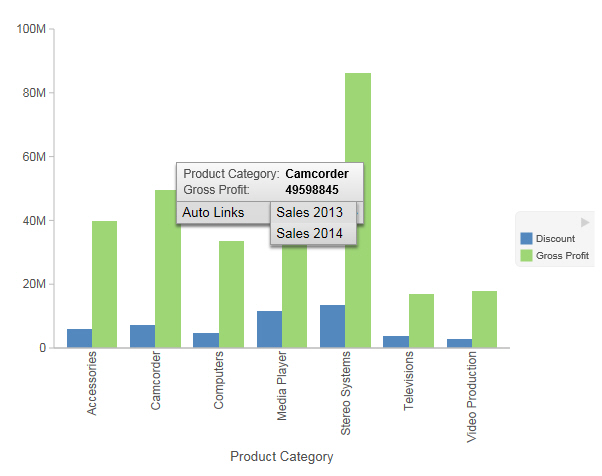
If you use the same example for an Auto Link enabled chart instead of a report, you can access the target reports or charts from a tooltip option that displays when you point your mouse over an area of the chart, such as a bar that represents Revenue by Product Category and by Model.
- The linked reports displayed are limited to those that you are authorized to run or run deferred.
- When running an HTML report with On-demand Paging enabled, the qualifying Auto Link targets appear on the menu in the order that they are specified in the request. This is also true for a chart request that is a legacy graph format (PFJ-based formats, such as PNG and non-bucket HTML5). In reports, horizontal lines appear in the menu to separate user specified drilldowns and Auto Link navigation options.
- Consideration should be given to how many reports or charts are indicated as Auto Link targets, as the run time Multi-drill menu for the qualifying target reports may become long in length. In these cases, some browsers may display a script processing warning message.
- The Auto Link Enabled and an Auto Link Target options can be set individually or both can be set on the same report or chart if that item meets the Auto Linking requirements.
Procedure: How to Set an Existing Report or Chart as Auto Link Enabled
- On the Home page, right-click a
report or chart and click Edit.
InfoAssist+ opens in the relevant mode.
- Verify that there is a sort (BY) field in the report
or chart.
- For reports, sort fields are added to the BY field container.
- For charts, sort fields are added to the Horizontal, Vertical, or Color field containers.
- On the Format tab, in the Auto Linking group, click Enable Auto Linking.
- Save the report or chart.
Your existing report or chart is now Auto Link enabled.
Procedure: How to Set an Existing Report or Chart as an Auto Link Target
- On the Home page, right-click a
report or chart and click Edit.
InfoAssist+ opens in the relevant mode.
- On the Format tab, in the Auto
Linking group, click Auto Link Target.
Note: Selecting Auto Link Target specifies that the parameter information for this report or chart will be stored, adding it to the repository of reports and charts that will be evaluated when an Auto Link enabled report is run.
- Add a filter with a simple or optional parameter to the
target report or chart. Qualifying target reports are those that
have filters with parameters for the sort (BY) fields in Auto Link
enabled reports or charts.
- From the Data pane, drag a sort (BY) field into the Filter pane.
- Using the Create a filtering condition dialog box,
add the selected parameter as simple, as shown in the
following image.
- Click OK, and then click OK again to exit the Create a filtering condition dialog box.
- Save the report or chart.
Your existing report or chart is now set as an Auto Link target.
Procedure: How to Create a New Auto Link Enabled Report or Chart
- Open InfoAssist+ in report or chart mode.
- From the Open dialog box, select a data source.
- On the Format tab, in the Auto Linking group, click Enable Auto Linking.
- Add fields to the report or chart, ensuring that one
is a sort (BY) field.
- For reports, sort fields are added to the By field container.
- For charts, sort fields are added to the Horizontal, Vertical, or Color field containers.
- Save the report or chart.
Your report or chart is now set as Auto Link Enabled.
Procedure: How to Create a New Auto Link Target Report or Chart
- Open InfoAssist+ in report or chart mode.
- From the Open dialog box, select a data source.
- On the Format tab, in the Auto
Linking group, click Auto Link Target.
Note: Selecting Auto Link Target specifies that the parameter information for this report or chart will be stored, adding it to the repository of reports that will be evaluated when an Auto Link enabled report is run.
- Add fields to the report or chart.
- Add a filter with a simple or optional parameter to the
target report or chart.
- From the Data pane, drag a sort (BY) field into the Filter pane.
- Using the Create a filtering condition dialog box,
add the selected parameter as simple or optional.
Note: When creating a parameter for a field, the parameter name defaults to the fieldname that you select. In the previous image, the creation of a filter with parameter Product Category is shown. To ensure that the name of the parameter is the same as the sort (BY) field in the Auto Link enabled report or chart, do not change the name of the parameter that is generated by your field selection.
- Click OK, and then click OK again to exit the Create a filtering dialog box.
- Save the report or chart.
Your report or chart is stored as an Auto Link target.
Procedure: How to Run an Auto Link Enabled Report or Chart
You can run an Auto Link enabled report or chart from within InfoAssist+ or from the Home page.
- Open and run an Auto Link enabled report or chart
in one of the following ways:
- In InfoAssist+, open or create an Auto Link enabled report and on the Quick Access Toolbar, click Run.
- From the Home page, right-click a report or chart that is Auto Link enabled and click Run.
- Use the hyperlinks to link to other reports and charts,
based on the following information:
-
Reports. Displays with hyperlinks on the
sort (BY) fields that have qualifying target reports. Click a hyperlink
to display the menu with the Auto Links option, which cascades to
list the qualified Auto Link target reports and charts, as shown
in the following image.
-
Charts. Displays with aspects over which you can
hover (for example, a bar) in the chart. A tooltip displays with
the Auto Link target reports and charts, as shown in the following
image.
-
Reports. Displays with hyperlinks on the
sort (BY) fields that have qualifying target reports. Click a hyperlink
to display the menu with the Auto Links option, which cascades to
list the qualified Auto Link target reports and charts, as shown
in the following image.
| WebFOCUS | |
|
Feedback |