Viewing Data Profiling Characteristics
|
Topics: |
Data Profiling provides data characteristics for the columns in a synonym. You can display the characteristics for all the columns in a synonym or segment, or for an individual column.
For alphanumeric columns, Data Profiling provides the segment, format, count of distinct values, total count, patterns count, maximum, minimum, and average length, minimum and maximum values, and number of nulls. Patterns count shows the number of patterns found in each alphanumeric column.
For numeric columns, Data Profiling provides the segment, format, count of distinct values, total count, maximum, minimum, and average values, and number of nulls.
Data Profiling for an individual column provides access to Statistics, Patterns, Values, and Outliers reports.
Data Profiling a Synonym or Segment
|
How to: |
Data Profiling provides information on all the columns in a synonym or segment. You can also drill down to the Values or Patterns reports for an individual column from a synonym or segment Data Profiling report.
Note: Data Profiling is also available from the navigation pane by right-clicking a synonym, pointing to Data Profiling, and then clicking Statistics.
Procedure: How to View Data Profiling for a Synonym or Segment
To view the Data Profiling information for a synonym or segment:
- Open the synonym in the Synonym Editor by double-clicking it from
the navigation pane or right-clicking it and clicking Open.
The Synonym Editor opens to the Field View tab.
- Right-click the synonym or segment name, point to Data Profiling,
and then click Statistics.

The Data Profiling information displays in the workspace. The last four columns are shown below the rest of the information for illustrative purposes only. The actual report runs across the workspace.
You may use the Report tab in the ribbon to view server messages, print the report, copy data as text, and export the report.
- Optionally, you can click a column name or patterns count (for alphanumeric
columns) to drill down to the Values or Patterns reports, respectively.
For pattern analysis, a 9 represents a digit, an A represents any uppercase letter, and an a represents any lowercase letter. All printable special characters are represented by themselves, and unprintable characters are represented by an X.
Note: Data Profiling is also available from the navigation pane by right-clicking a synonym.
Procedure: How to View Key Analysis for a Synonym or Segment
Key Analysis provides a report that shows which columns in a data source can be used individually, or in combination, to uniquely identify a row. The columns identified in this report are candidates for key columns.
Note: Key Analysis is also available from the navigation pane by right-clicking a synonym, pointing to Data Profiling, and then clicking Key Analysis.
To view key analysis for a synonym or segment:
- Open the synonym in the Synonym Editor.
- Right-click
the synonym or segment name, point to Data Profiling,
and then click Key Analysis.
The Key Analysis dialog box opens.
- Select the
columns that you would like to analyze as potential keys to the
source table and click Analyze.
The Key Analysis report for that synonym box opens.
- If you selected a segment name, the report opens as shown in the following image. Note that all columns
in the segment will be selected.
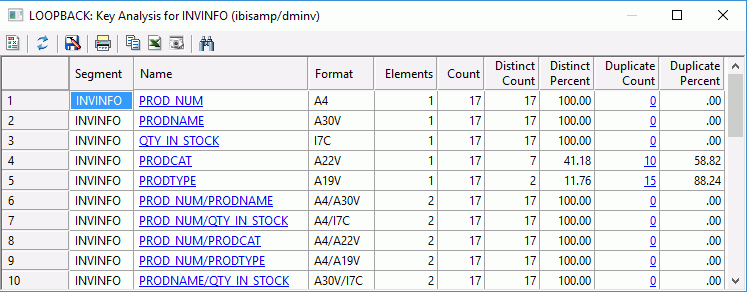
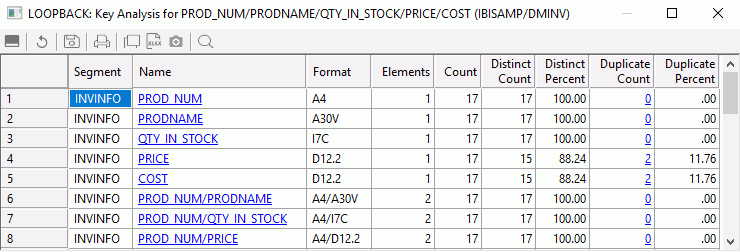
The report shows:
- Segment
-
The selected segment.
- Name
-
Name of the segment.
- Format
-
The format of each column.
- Elements
-
The number of elements (columns) shown.
- Count
-
The number of rows.
- Distinct Count
-
The number of distinct rows.
- Distinct Percent
-
The percentage of rows that are distinct. This value must be 100% for a combination of columns to be used as key.
- Duplicate Count
-
The number of duplicate values.
- Duplicate Percent
-
The percentage of duplicate values. This value must be 0% for a combination of columns to be used as key.
Example: Select Table DMHR and All of the Columns EXCEPT ID_NUM and Capture the Output
By default, the report is sorted by the number of elements, so the first rows in the report show one element each. This enables you to determine if any single column could be used by itself as a key. The report then shows all combinations of two columns, three columns, and so on.
To see the values in the report, right-click on any row.
The duplicate rows option shows all duplicate values, which prevent the desired column combination from being used as a key.
Data Profiling a Single Column
|
How to: |
Data Profiling for an individual column provides access to nine reports:
- Statistics. Lists counts, percents, limits, distinct values, and information about null values in a field or a segment, as shown in the
following image.

For alphanumeric columns, the Statistics report provides the segment, format, count of distinct values, total count, patterns count, maximum, minimum, and average length, minimum and maximum values, and number of nulls.
For numeric columns, the Statistics report provides the segment, format, count of distinct values, total count, maximum, minimum, and average values, and number of nulls.
- Key Analysis. Lists counts and distinct and duplicate counts and percents for a single column, as shown in the following image.

- Patterns Shows patterns
of letters, digits, and special characters, as well as counts and
their percents, as shown in the following image. This report is only available for alphanumeric columns.

Optionally, you can click the pattern to drill down to the values for the rows containing those patterns.
For pattern analysis, a 9 represents a digit, an A represents any uppercase letter, and an a represents any lowercase letter. All printable special characters are represented by themselves, and unprintable characters are represented by an X.
- Hex View. Shows the hexadecimal value of any field, as shown in the following image.

- Values. Shows
unique values and their percents, as shown in the following image.
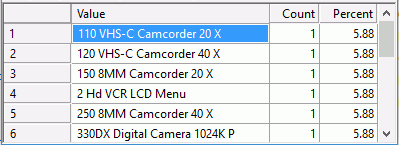
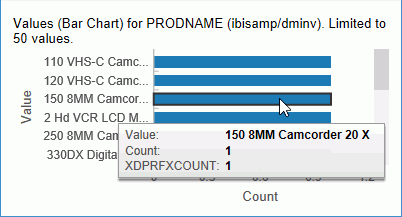
- Values Graph. shows a horizontal bar graph of the field values, as shown in the following image. The tooltip for each bar also shows the
count of instances of the field.
- Values Pie Graph. Shows a pie chart of the field values, as shown in the following image.
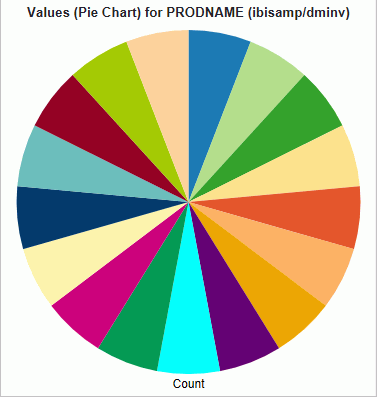
The tooltip for each bar also shows the count of instances of the field and the percent of the total.
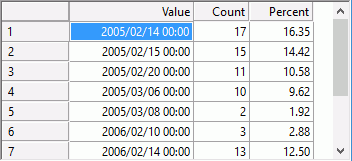
- Duplicate Values. Lists the values that have multiple instances, the count of instances, and the corresponding percent, as shown in the following
image.
- Outliers. Shows high and low values with a count of instances that fall outside the bulk of the data for a field, as shown in the following
image.
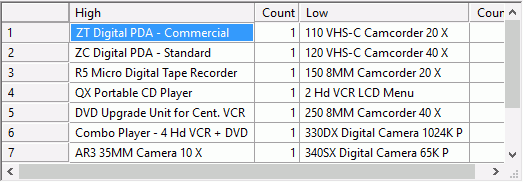
Note: Outliers produce a maximum of 10 highest and lowest distinct values, if they exist.
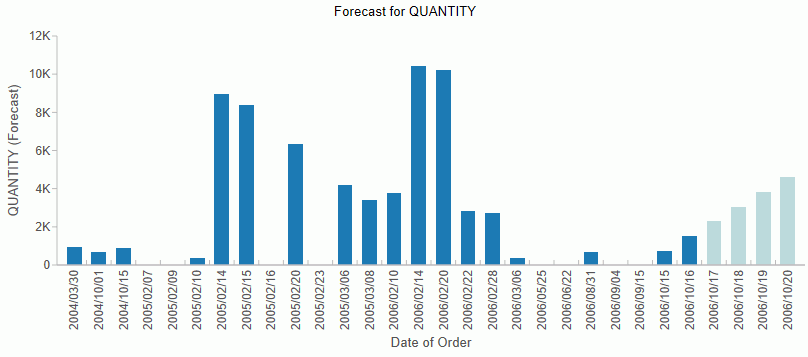
- Forecast Chart. Shows the values used for both the forecast and forecast values, as shown in the following image. This report is only available
for numeric columns.
These reports are available by right-clicking a column in the Synonym Editor and pointing to Data Profiling.
Procedure: How to View a Data Profiling Report
To view a Data Profiling report for a single column:
- Open the synonym in the Synonym Editor by double-clicking it from
the navigation pane, or right-clicking it and clicking Open.
The Synonym Editor opens to the Field View tab.
- Right-click a column, point to Data Profiling,
and then click one of the available reports:
- Statistics
- Key Analysis
- Patterns
- Hex View
- Values
- Values Graph
- Values Pie Graph
- Duplicate Values
- Outliers
- Forecast Chart
Reference: Data Profiling Statistics Report Columns
The Statistical Data Profiling information displays in the workspace, as shown in the following image.

The report shows:
- Segment
-
The name of the segment in the synonym. For a cluster synonym, each segment can refer to a separate table; a segment can also refer to a group of columns.
- Name
-
The column name. If you click the name, another report opens for that column showing each unique value and a count of the number of times the value appears and the percentage
- Format
-
The FOCUS format of the column.
- Count
-
The number of values for the field.
- Distinct Count
-
The number of unique values for the column.
- Distinct Percent
-
The percentage of values that are unique.
- Patterns Count
-
The number of unique patterns (combinations of letters and digits) that are found.
- Average Value
-
Only for numeric fields.
- Minimum, Maximum, and Average Length
-
Only for character fields.
- Nulls Count
-
The number of values that are missing.
- Nulls Percent
-
The percentage of values that are missing.
- Duplicate Count
-
The number of values that are not unique.
- Duplicate Percent
-
The percentage of values that are not unique.
The list of columns displayed can be selected from the ribbon by clicking Customize Columns. Clear any that are not desired. The following optional columns can also be displayed:
- Median
-
The value where half the values are less and half the values are more.
- Mode
-
The most commonly occurring value.
Optionally, you can click a column name or patterns count (for alphanumeric columns) to drill down to the Values or Patterns reports, respectively.
Note: Data profiling requires reading every row and column of the source table. Use caution with large data sources.
| WebFOCUS | |
|
Feedback |