DataMigrator Log, Statistics, and Summary Flow Reports
|
How to: |
|
Reference: |
The DataMigrator logs and traces folder contains a link that opens the Logs and Traces dialog box. This provides access to viewing two reports:
- The Log report
contains the message output generated from running flows. This information
includes the steps taken during data extraction, table creation,
and data load, and any errors that occur. The report can include
the entire log, or the log for a specific time period.
For process flows, the Log report provides drill-down capabilities, which allow you to select entries that display details of the logs of the individual flows in the process flow.
- The Statistics
report contains statistical information about flows, such as how many
rows were written, when the flow ran, and how long it took. The
report can include all statistics, or statistics over a specific
time period, for all flows, or for different types of completed
flows.
The Statistics report is a drill-down report, which allows you to select entries that display details about the individual flows.
Note: Statistics are not available for XML files described by multi-segment synonyms, or for flows that use load type Insert records from memory.
- The Summary Flow Report flow contains information about all of the flows in the server path or in a specific application directory. It includes the flow type, application directory, description, modify date, and creator.
- DataMigrator reports support flow names of up to 64 characters.
- The DM log and statistic tables are not updated with messages when flows are initiated using Run, from the Run group, or context menu.
Reference: Log Report Columns
Log reports provide the information listed and described in the following table:
|
Column |
Function |
|---|---|
|
Datetime |
Date and time of log entry. |
|
Message Code |
Message code number. |
|
Log Messages |
Message strings in the log. |
|
Application |
Flow application directory. |
|
Name |
Flow name. |
|
Job ID |
Unique internal job name. |
Note: If a log message contains a non-zero return code, the line will be shown in red.
Reference: Statistics Report Columns
Statistics reports provide the information listed and described in the following table:
|
Column |
Function |
|---|---|
|
User ID |
User ID which executed a request. |
|
Application |
Flow application directory |
|
Name |
Flow name. |
|
Log |
Job ID as a link to the flow log. |
|
Parent Log |
Log for parent flow. |
|
Start Datetime |
Start date and time of execution. |
|
End Datetime |
End date and time of execution. |
|
Total Runtime |
Total run time for the flow. |
|
Return Code |
Internal return code for the flow. |
|
Target Name |
Target name. Note: This, and the remaining columns, apply on a per target basis. |
|
Transactions |
Number of rows processed. |
|
Accept |
Number of rows accepted. |
|
Nomatch |
Number of rows rejected. |
|
DBMS Error |
Number of rows rejected by the database for a constraint violation, such as a Unique Index constraint, a Not Null constraint, or a user-specified constraint. For a file target, the number of rows rejected due to format conversion errors. |
|
Format |
Number of format rejections. |
|
Invalid |
Number of rows rejected for failing validation tests. |
|
Duplicates |
Number of rejected duplicate records. |
|
Input |
Number of rows input. |
|
Changed |
Number of rows updated. |
|
Deleted |
Number of rows deleted. |
|
Original Request |
Original flow where dependency started. |
|
Original User |
Original user ID running dependent flow. |
|
Dependency Count |
Dependency number. |
|
Message |
Text explanation of error messages. |
|
CPU Time |
Total CPU time in milliseconds. |
Procedure: How to Run a Log or Statistics Report
You can access Log and Statistics reports to view information about executed flows. The Log report displays the messages generated by the flows that have been run from the DMC, and the Statistics report provides information about the flows that have been scheduled or submitted from the DMC. The Statistics report also provides access to the message log of each flow.
- From the navigation pane, expand the Workspace folder. Expand the Logs and Traces folder.
- Double-click DataMigrator
Log and Statistics or right-click it and click View.
The Log and Statistics dialog box opens.
- From the Report Type drop-down menu, select Log or Statistics.
- Select values for the following fields and options to specify the information shown in the Log or Statistics report.
- Report Range
-
Allows you to select what time range you want to run the report for. The options are Last, All, or Specify Time. If Specify Time is selected, an area opens where you can specify the start and end date and time. If Statistics is selected, the default value is All. If Log is selected, the default value is Last.
- Completion Status
-
Allows you to view all reports, completed reports, reports completed successfully, or reports completed with errors. This option is only available when running a Statistics report.
- Run by
-
Allows you to view reports for all flows, and those initiated by the scheduler or submit. This includes flows initiated from the DMC, WC, and CMRUN. This option is only available when running a Statistics report.
- Application or Flow Name
-
Allows you to specify a specific application, flow, or procedure to run the report on.
- Click View Report.
The report opens in the workspace.
An example of a Log report is shown in the following image.
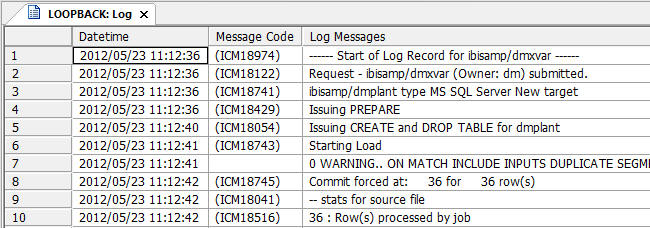
Note: For process flows, you can drill down to details of the flow components by double-clicking the blue Job ID line in a Log report.
An example of a Statistics report is shown in the following image
To view the message log for an individual flow, double-click its link or right-click the link and click Show Log in a Statistics report. If the log has output, right-click the log, and click Output. Failed flows will be shown in red.
To delete a log and its output, select its corresponding check box in a Statistics report, and on the Report tab, in the Tools group, click Delete Selected.
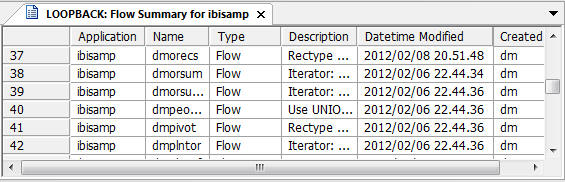
Procedure: How to Run a Summary Flow Report
A Summary Flow Report displays all of the flows on the server or in a specific application directory.
- In the navigation pane, right-click Application Directories or a specific application directory folder. Point to Impact Analysis, then Flow Report, and then click Summary.
- If you select to view the report from Application Directories, all of the flows will be included. If you selected a specific application directory, the flows in that particular application directory are displayed.
The report opens in the workspace, as shown in the following image.
| WebFOCUS | |
|
Feedback |