Menu Options
|
Topics: |
Each Console page provides options on the ribbon, the menu icon (if the ribbon is hidden), and the right-click options from the top node of its tree.
To hide the ribbon, click the up arrow on the right portion of the menu bar. Once the ribbon is hidden, the arrow changes to a down arrow. To show the ribbon, click the down arrow on the right portion of the menu bar.
The left portion of the menu bar provides quick links to the main Web Console pages.
The following options are available on the right portion of the Main Menu bar.
Scalability
This option provides the ability to run stress tests on the server. For more information, see Recording and Reproducing User Actions.
User Menu Options
|
Topics: |
The following options are available from the User menu on the right portion of the Main Menu bar.
End Current Session
This option signs the user out and opens the Web Console Sign in page.
My Console
These options provide users with functionality that supports the tasks they are authorized to perform. The options that a user has under My Console depend on the user role and general privileges assigned to the user.
In the descriptions that follow, each option applies to the user who is connected to the current Web Console session.
Show My General Privileges. Shows the privileges set by the Server Administrator for the user who is logged in to the current Web Console session. Privileges can be customized for each role, group, or user. See General Privileges, for details on the information supplied on the General Privileges pane.
Change My Password. Enables you to specify a new password to replace your current password. When you click this console option, the dialog box shown in the following image is displayed. Supply the requested information, and click Update.
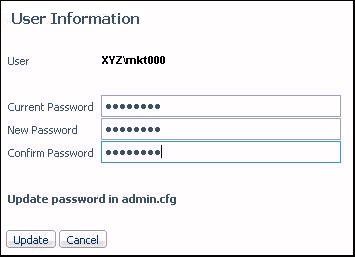
Note: The LDAP security mode also allows you to change your password in the LDAP directory.
Manage My Agents. Enables you to monitor and manage Data Service Agents, based on your role and privileges. For example, if you are a Basic user, by default you can monitor and manage your own agents (that is, the agents that match your user ID). If granted the applicable privileges, you can also monitor, or monitor and manage, the agents of the other users in your group (that is, users with the same group ID).
When you click Manage My Agents, a Performance Report for Data Service Agents is displayed, showing statistics for the agents that you are authorized to see. You can customize and filter the report to display only those statistics that you are interested in.
To determine your privileges, click Show General Privileges from the Web Console menu bar. See General Privileges for details on the information supplied on the General Privileges pane.
Save My Last Report. Saves the last report (procedure) that you ran with the values that you chose for the amper variables. The report is saved as a new, separate procedure. You can run the saved report without having to manually supply the values for the amper variables as you did before.
When you click this console option, you can select for the application directory in which to save the report and enter a file name for the report.
Edit My Profile. Enables you to make changes to your current user profile settings.
Login Info
This option displays user login status and browser-related information. Login status information includes user name, group, and role, location of all profiles (user, group, and role) if they exist, and type of authentication (explicit or cookie). HTTP information reflects the properties of the current browser session, for example, the cookie.
Clear Session Log
This option deletes all lines from the session log.
Session Log
This option opens the Session Log window, which provides a record of server configuration and activity.
Enable Traces
This option enables traces to provide diagnostics assistance. For more information, see Tracing Server Activity.
Export for Printing
If a report, such as a Data Services Agents report, is open in the Web Console, clicking this option opens the report in a web browser.
Preferences
This option enables you to indicate preferences for Run Options, Web Console Appearance, Reporting Options, and Diagnostic Options, as shown in the following image.
Run Options are:
- Default Data Service The choices for Default Data Service are DEFAULT, WF_DEFAULT, SCHED_DEFAULT, and DFM_DEFAULT.
- Maximum number of seconds before the popup timer appears
The Web Console Appearance options are:
- Show Web Console reports in the following location. The choices are Right Frame, Same detached window, and Different detached window.
- Appearance. The choices are Adhere to server appearance default, RIA-Blue, RIA-CarbonRounded, RIA-Default, and RIA-OceanRounded.
- Icons. The choices are Adhere to server appearance default, IBI default, Google Material Icons.
- Report Style. The choices are Warm, Standard, and Flat.
- Default page on User Login. The choices are Applications, Adapters, Resource Management, Workspace/Monitor, Access Control, Scalability, and Upload Wizard.
- Menu or Ribbon. The choices are Menu, Ribbon, and Adhere to server appearance default.
The Reporting Options are:
- Maximum number of rows for test reports. The default is 50.
- Maximum number of columns for test reports. The default is 999,999.
- Maximum number of identical error messages. The default is 10.
The Diagnostic Options are:
- Enable recording for diagnostic. The choices are Yes and No.
Indicate your preferences, and click Update.
Language
This option controls the language in which the Web Console is displayed. For example, all menu options are translated into the selected language. This console option is available if the server is configured for National Language Support (NLS).
| WebFOCUS | |
|
Feedback |