Generating Narrative Charts
|
Topics: |
Narrative charts use a text generation server to generate a natural language summary of and insight into a chart.
Natural Language Generation (NLG) is a branch of artificial intelligence (AI) that produces language as output on the basis of data input. This helps you to get an easily understandable explanation of a chart that adds value by identifying the most relevant information and conveying it through conversational language.
To generate a narrative chart, you add narrative chart properties to a chart request. Using these properties, you can control some of the features of the narrative that is generated.
Configuring WebFOCUS to Generate Narrative Charts
|
How to: |
In order to configure WebFOCUS to generate narrative charts, you must install the WebFOCUS Narrative Charts Server and, optionally, configure the URL to the WebFOCUS Narrative Charts Server in the WebFOCUS Administration Console.
Note: If you do not configure the URL to the WebFOCUS Narrative Charts Server in the WebFOCUS Administration Console, the Narrative charts button will not be activated in InfoAssist+. If you do configure the URL in the WebFOCUS Administration Console, you will find the Narrative button on the Format menu under Features when you create an HTML5 (FORMAT JSCHART) bar, line, area, or pie chart.
The WebFOCUS Narrative Charts Server is a separately licensed product that can be installed on Windows or Linux. Once you have licensed this feature, you can install the server using the instructions in the WebFOCUS Narrative Charts Installation and Configuration manual.
In order generate WebFOCUS narrative charts, you must either include the narrative text in your chart procedure or StyleSheet, configure the URL to the WebFOCUS Narrative Charts Server in the WebFOCUS Administration Console, or include the URL in the narrative chart properties in your chart procedure or StyleSheet. The order of precedence is:
- The URL configured in the WebFOCUS Administration Console. If neither the content nor the url property is specified in your procedure or StyleSheet, the URL configured in the WebFOCUS Administration Console will be used.
- A URL specified in the procedure or StyleSheet. If your procedure or the StyleSheet included in your procedure has a url property pointing to the WebFOCUS Narrative Charts Server, and the content property is omitted or set to undefined, the last URL found when parsing the procedure or StyleSheet will be used.
- Your own content. If you supply narrative text in the content property of your procedure or StyleSheet, it will be used.
Reference: Usage Notes for Narrative Charts
Narrative charts can have a maximum of 1,024 data points. This limit is imposed by the WebFOCUS Narrative Charts Server and will be removed in a future release. If the limit is exceeded, the message returned from the WebFOCUS Narrative Charts Server is
Failed to retrieve narrative text
Procedure: How to Configure the URL to the WebFOCUS Narrative Charts Server in the WebFOCUS Administration Console
- From the WebFOCUS Home Page, click Administration at the top right of the page, and click Administration Console.
The WebFOCUS Administration Console opens.
- Select Text Generation Server under Application Settings in the left pane, as shown in the following image.
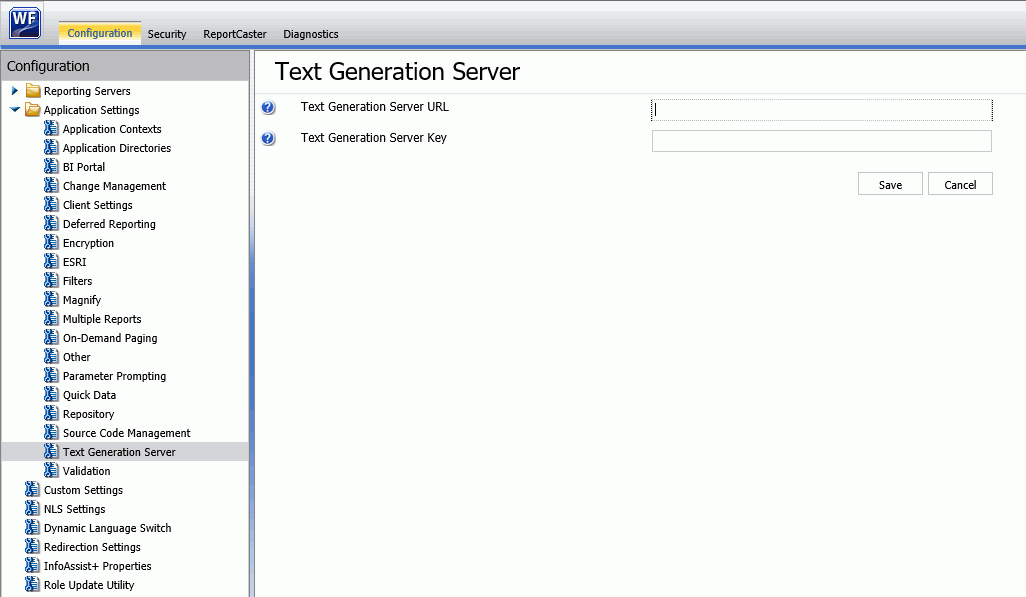
- Enter the URL to the WebFOCUS Narrative Charts Server in the Text Generation Server URL text box.
Note: The Text Generation Server Key field is not used.
- Click Save.
- Clear the cache in the WebFOCUS Administration Console by clicking Clear Cache at the top right of the console page.
Chart Types Supported for Narration
The following chart types are supported for narrative text generation when creating an HTML5 (FORMAT JSCHART) chart.
- Bar. Horizontal and vertical bars are supported, including stacked bars, and percent bars.
- Line. Horizontal and vertical lines are supported, including stacked lines and absolute lines.
Note: Line charts require an ordered axis, such as date.
- Area. Horizontal and vertical area charts are supported, including stacked lines and absolute lines.
Note: Area charts require an ordered axis, such as date.
- Pie. Both pie and ring pie charts are supported, including percent pies.
Narrative chart requests can include up to two dimensions as long as they are concatenated and if there is only one measure, or up to two measures if there is only one dimension.
Adding Narrative Chart Properties
Note: For JSON formatting, object names, property names, and string property values should be enclosed in double quotation marks.
For an introduction to JSON syntax for WebFOCUS HTML5 charts and the supported methods for specifying colors, see the Creating HTML5 Charts With WebFOCUS Language manual.
The following properties can be used to add a narrative to a chart, format the narrative, and control features of the generated narrative.
*GRAPH_JS
"narrativeText":
   {
     "enabled": boolean,
     "hideChart": boolean,
     "position": "string",
     "maxSize": "string",
     "url": "string",
     "content": "string",
     "label": {
             "font": "string",
             "color": "string",
             "align": "string"
            },
     "backgroundColor": "string",
     "border": {
              "width": number,
              "color": "string",
              "dash": "string"
             },
     "dockButton": {
                  "enabled": boolean,
                  "animationDelay": number,
                  "size": number,
                  "color": "string",
                  "hoverColor": "string"
                },
 "textGenerationAPI":
            {
              "inputChart":
               {
                "mainDimensionOrdered": boolean,
                "multiSeriesType": "string",
                "disableInterpolation": boolean,
                "singularExceptions": ["string", "string"...],
                "pluralExceptions": ["string", "string"...],
               },
               "outputText": {
                            "levelOfDetail": number,
                            "lang": "string",
                            "useBulletPoints": boolean
                            },
              "measures":   [
                            {
                             "defaultValue": "string",
                             "meaningOfUp": "string",
                             "unit": "string"
                            },
                            {
                             "defaultValue": "string",
                             "meaningOfUp": "string",
                             "unit": "string"
                            }
                           ]
            }
   }
*END
where:
- "narrativeText":
-
Starts the narrative chart properties section of a *GRAPH_JS block in the StyleSheet.
- "enabled": boolean
-
Enables or disables the narrative text generation. Valid values are true, which generates a narrative on the chart output, and false, which does not generate a narrative on the chart output. The default value is false.
- "hideChart": boolean
-
Controls whether the chart displays along with the narrative. Valid values are true, which displays only the narrative, not the chart, and false, which displays both the narrative and the chart. The default value is false.
- "position": "string"
-
Defines the position of the narrative text in relation to the chart. Valid values are "top", "bottom", "left", or "right". The default value is "top".
- "maxSize": "string"
-
Is a string that includes a percent symbol (%) that defines the maximum percent of the chart draw area that will be dedicated to the narrative text. This value takes position into account. If position is "left" or "right", this defines the maximum width of the text box for the narrative. If position is "top" or "bottom", this value defines the maximum height of the text box for the narrative. The default value is "20%".
- "url": "string"
-
Identifies the URL to the text generation server. Optional if the URL is configured in the WebFOCUS Administration Console. Omit both the property name and value if you want to supply content using the content property.
- "content": "string"
-
Should be undefined, if the text will be generated by the WebFOCUS Charts Narrative Server. If the url property is missing or commented out and the URL is not configured in the WebFOCUS Administration Console, provide a string containing the text of the narrative you want to display. Simple HTML tags such as < br > and < ol > can be used. An amper variable can be used if the Narrative Chart properties are defined in the chart request and not in an external WebFOCUS StyleSheet The default value is undefined.
Note: All of the content string must be entered as a single line in the procedure. Any breaks that you want to appear on the narrative output should be entered as HTML tags.
- "label":
-
These properties define the format and alignment of the generated narrative text.
- "font": "string"
-
Is a string that defines the font of the narrative text. The default value is "11pt Sans-Serif".
- "color": "string"
-
Is a string that defines the color of the narrative text using a color name, an RGB color string, or a hex color string. The default value is "black".
- "align": "string"
-
Is a string that defines the alignment of the narrative text within the text box. Valid values are "left", "middle", "center", and "right". The default value is "left".
- "backgroundColor": "string"
-
Is a string that defines the background color of the text using a color name, an RGB color string, or a hex color string. The default value is undefined.
- "border":
-
These properties define the border of the text box.
- "width": number
-
Is a number that defines the width in pixels of the border around the narrative text box. The value zero (0) does not draw a border around the text box. The default value is 0.
- "color": "string"
-
Is a string that defines the color of the border around the text box using a color name, an RGB color string, or a hex color string. The default color is "black".
- "dash": "string"
-
Is a string that defines the dash style of the border around the text box. The default value is "" (a solid line). Use a string of numbers that defines the width of a dash in pixels followed by the width of the gap between dashes in pixels (for example, dash: "1 1" draws a dotted line).
- "dockButton":
-
These properties define a button that can be drawn pointing to the chart that, when clicked, expands the narrative text box as much as required, up to the size of the entire chart frame. After expansion, the button becomes a collapse button that collapses the text box to its original size.
- "enabled": boolean
-
Controls whether a dock button will be drawn. Valid values are true, which draws a dock button, and false, which does not draw a dock button. The default value is false.
- "animationDelay": number
-
Is a number that defines the length of time (in ms) to animate the sliding transition when expanding and collapsing the text box. The default value is 300.
- "size": number
-
Is a number that defines the diameter of the dock button in pixels. The default value is undefined.
- "color": "string"
-
Is a string that defines the color of the dock button using a color name, an RGB color string, or a hex color string. The default value is "rgb(50, 50, 50)".
- "hoverColor": "string"
-
Is a string that defines the color of the dock button when the mouse hovers over it. the default value is "black".
- "textGenerationAPI":
-
These properties define the parameters sent to the WebFOCUS Narrative Charts Server to be used in generating the narrative text.
- "inputChart":
-
These properties define aspects of the data being sent to the WebFOCUS Narrative Chart Server.
- "mainDimensionOrdered": boolean
Specifies whether the dimension represents a range of values or a categorical list. To have the type of ordering automatically detected, omit this property. Valid values are:
- true, which indicates that the dimension values can be expressed as a range of values. This type of ordering is appropriate for time, date, or numeric dimensions. The generated text will describe the dimension values as a from-to range of values. This is the default value for bar, line, and area charts.
- false, which indicates that the dimension values do not represent a range. This type of ordering is appropriate for alphanumeric dimensions. The generated text will express the dimension values as a categorical list. This is the default value for pie charts.
- "multiSeriesType": "string"
Indicates if the measures are related to each other. Valid values are:
- "UNRELATED", which means the measures are not related to each other. This is the default value.
- "VALUE_VS_REFERENCE", which means that the measures are related. Value refers to the first measure, say, Actual Sales, and the second measure is the Reference (that is, the target or objective). This option requires a date axis, and the format must be YYMD.
- "disableInterpolation": boolean
Determines whether missing values will be approximated or replaced with a default value. Valid values are:
- true, which uses a default value for missing values. The default value is specified in the defaultValue property for each measure. This is the default option.
- false, which computes an approximate value when a data value is missing.
- "singularExceptions": ["string", "string" ...]
Is an array of strings that identify nouns that seem plural but should be treated as singular. Examples are the nouns mathematics, physics, and ethics. The default value is not to have singular exceptions.
- "pluralExceptions": ["string", "string" ...]
Is an array of strings that identify nouns that seem singular but should be treated as plural. Examples are the nouns pliers, tongs, and tweezers. The default value is not to have plural exceptions.
- "mainDimensionOrdered": boolean
- "outputText":
-
These properties control some of the aspects of the returned narrative text.
- "levelOfDetail": number
Is an integer from 1 to 7 that controls how much text is generated, with 7 generating the most detailed text and 1 generating the simplest text. The default value is 7.
- "lang": "string"
Defines the language for the generated text. At this time, the supported values are "en" (English) or "fr" (French). You can be licensed to use either English or French, but not both. The default value is "en".
- "useBulletPoints": boolean
Defines whether key points in the narrative should be displayed as bullets or paragraphs. Valid values are true, which displays key points as bullets, or false, which uses paragraphs. The default value is false.
- "levelOfDetail": number
- "measures":
-
Is an array that defines the properties of up to two measures.
Note: If your chart request has only one measure, do not include properties for a second measure or the chart will not draw.
- "defaultValue": "string"
Is a string that specifies default value to be used for missing data values if the disableInterpolation property is set to true. The default value is "0".
- "meaningOfUp": "string"
Identifies whether high values represent positive information (for example, sales or profit) or negative information (for example, expenses). Valid values are:
- "GOOD", which means higher values represent positive information. This is the default value.
- "BAD", which means higher values represent negative information.
- "unit": "string"
Defines the units to be applied to measure values. Valid values are:
- "$". Should be used for currency values.
- "%". When "%" is used, an automatic scale is applied to the data (.1 will be displayed as 10%).
- "". This is the default value.
- "defaultValue": "string"
Note:
- For all examples, the application containing the Master File must be on the APP PATH or be included in the GRAPH FILE command.
For example:
GRAPH FILE app1/wf_retail_lite
- The text generation server purposely creates varying narratives, even for the same chart output. Therefore, the narrative output you get if you run the following examples may differ from the narrative output displayed here.
Example: Generating a Bar Chart With Narrative Text
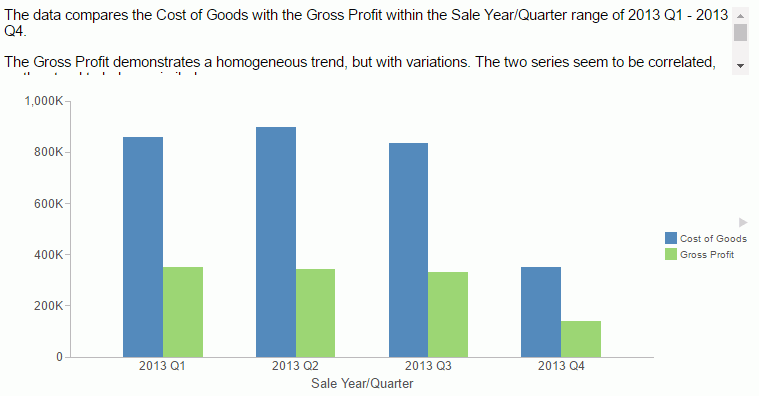
The following request generates a vertical bar chart with narrative text enabled. Default values are accepted for all other properties.
GRAPH FILE WF_RETAIL_LITE
SUM COGS_US GROSS_PROFIT_US
BY TIME_DATE_QTR_COMPONENT
ON GRAPH PCHOLD FORMAT JSCHART
ON GRAPH SET LOOKGRAPH BAR
ON GRAPH SET STYLE *
INCLUDE=IBFS:/FILE/IBI_HTML_DIR/ibi_themes/Warm.sty,$
TYPE=DATA, COLUMN=COGS_US, BUCKET=y-axis, $
TYPE=DATA, COLUMN=GROSS_PROFIT_US, BUCKET=y-axis, $
TYPE=DATA, COLUMN=TIME_DATE_QTR_COMPONENT, BUCKET=x-axis, $
*GRAPH_JS
"narrativeText": {
                "enabled": true,
"textGenerationAPI": {
                     "measures": [
                                 {"unit": "$"},
                                 {"unit": "$"}
                                 ],
                     }
                 }
*END
ENDSTYLE
END
The output is shown in the following image.
Example: Formatting the Narrative Text and Border
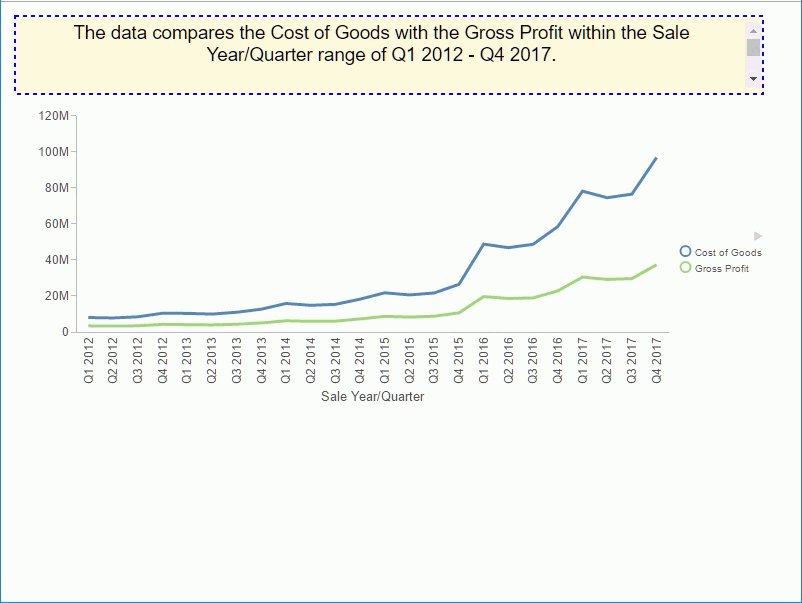
The following request generates a line chart and makes the text larger and center aligned, draws a blue dashed border around the text, and makes the background color corn silk.
GRAPH FILE WF_RETAIL_LITE
SUM COGS_US GROSS_PROFIT_US
BY TIME_DATE_QTR_COMPONENT
ON GRAPH PCHOLD FORMAT JSCHART
ON GRAPH SET LOOKGRAPH LINE
ON GRAPH SET STYLE *
INCLUDE=IBFS:/FILE/IBI_HTML_DIR/ibi_themes/Warm.sty,$
TYPE=DATA, COLUMN=COGS_US, BUCKET=y-axis, $
TYPE=DATA, COLUMN=GROSS_PROFIT_US, BUCKET=y-axis, $
TYPE=DATA, COLUMN=TIME_DATE_QTR_COMPONENT, BUCKET=x-axis, $
*GRAPH_JS
"narrativeText": {
                "enabled": true,
                "label": {
                                "font": "14pt Sans-Serif",
                                "color": "black",
                                "align": "center"
                      },
                "backgroundColor": "cornsilk",
                "border": {
                                "width": 2,
                                "color": "blue",
                                "dash": "4 4"
                        },
              }
*END
ENDSTYLE
END
The output is shown in the following image.
Example: Generating a Narrative-Only Chart
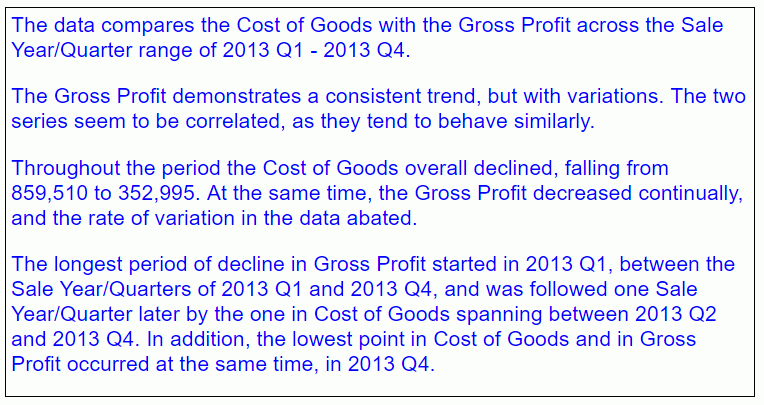
The following request hides the chart output so that only the narrative displays.
GRAPH FILE WF_RETAIL_LITE
SUM COGS_US GROSS_PROFIT_US
BY TIME_DATE_QTR_COMPONENT
ON GRAPH PCHOLD FORMAT JSCHART
ON GRAPH SET LOOKGRAPH BAR
ON GRAPH SET STYLE *
INCLUDE=IBFS:/FILE/IBI_HTML_DIR/ibi_themes/Warm.sty,$
TYPE=DATA, COLUMN=COGS_US, BUCKET=y-axis, $
TYPE=DATA, COLUMN=GROSS_PROFIT_US, BUCKET=y-axis, $
TYPE=DATA, COLUMN=TIME_DATE_QTR_COMPONENT, BUCKET=x-axis, $
*GRAPH_JS
"narrativeText": {
                "enabled": true,
                "hideChart": true,

                "label": {
                                "font": "16pt Sans-Serif",
                                "color": "blue",
                                "align": "left"
                      },

             }
*END
ENDSTYLE
END
The output is shown in the following image.
Example: Generating a Narrative Using an Unordered Dimension
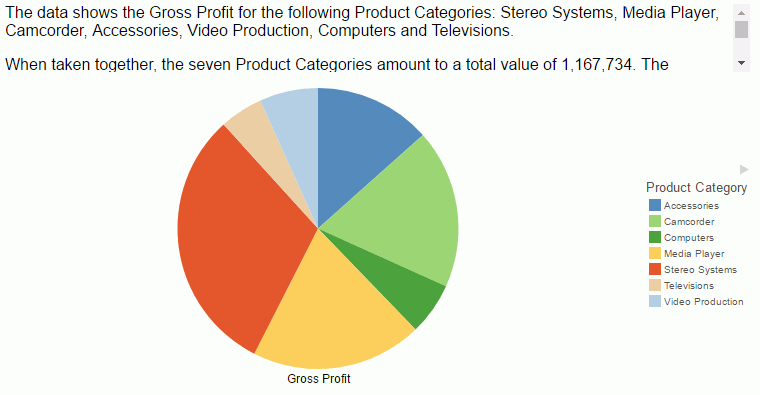
The following request generates a pie with a dimension (PRODUCT_CATEGORY) that should not be expressed as a range.
GRAPH FILE WF_RETAIL_LITE
SUM GROSS_PROFIT_US
BY PRODUCT_CATEGORY
ON GRAPH PCHOLD FORMAT JSCHART
ON GRAPH SET LOOKGRAPH PIE
ON GRAPH SET STYLE *
INCLUDE=IBFS:/FILE/IBI_HTML_DIR/ibi_themes/Warm.sty,$
TYPE=DATA, COLUMN=GROSS_PROFIT_US, BUCKET=measure, $
TYPE=DATA, COLUMN=PRODUCT_CATEGORY, BUCKET=color, $
*GRAPH_JS
"narrativeText": {
                "enabled": true,
                "label": {
                        "font": "12pt Sans-Serif",
                        "color": "black",
                        "align": "left"
                      },
                "textGenerationAPI":
                      {
                        "inputChart": {
                        "mainDimensionOrdered": false
                                    },
                      }
              }
*END
ENDSTYLE
END
The output is shown in the following image. The dimension values are expressed as a list, not a range.
Example: Generating a Narrative With Less Detail
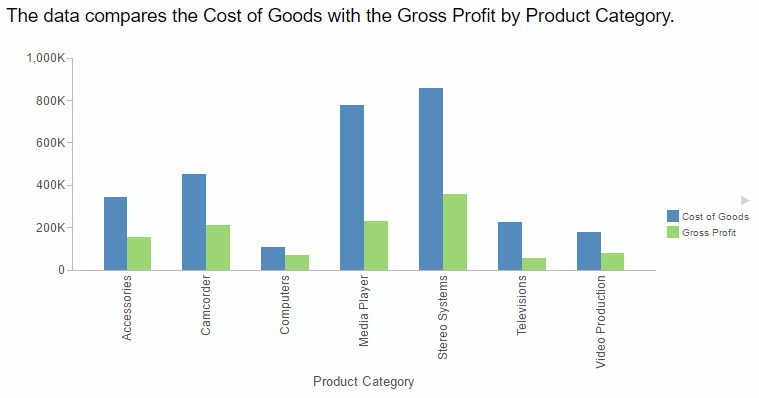
The following request generates a bar chart with a less detailed narrative (levelOfDetail:1).
GRAPH FILE WF_RETAIL_LITE
SUM COGS_US GROSS_PROFIT_US
BY PRODUCT_CATEGORY
ON GRAPH PCHOLD FORMAT JSCHART
ON GRAPH SET LOOKGRAPH BAR
ON GRAPH SET STYLE *
INCLUDE=IBFS:/FILE/IBI_HTML_DIR/ibi_themes/Warm.sty,$
TYPE=DATA, COLUMN=COGS_US, BUCKET=y-axis, $
TYPE=DATA, COLUMN=GROSS_PROFIT_US, BUCKET=y-axis, $
TYPE=DATA, COLUMN=PRODUCT_CATEGORY, BUCKET=x-axis, $
*GRAPH_JS
"narrativeText": {
                "enabled": true,
                "label": {
                        "font": "14pt Sans-Serif",
                        "color": "black",
                        "align": "left"
                      },
                "textGenerationAPI":
                      {
                       "outputText": {
                                    "levelOfDetail": 1
                                   },
                      }
              }
*END
ENDSTYLE
END
The output is shown in the following image.
Example: Displaying a Dock Button
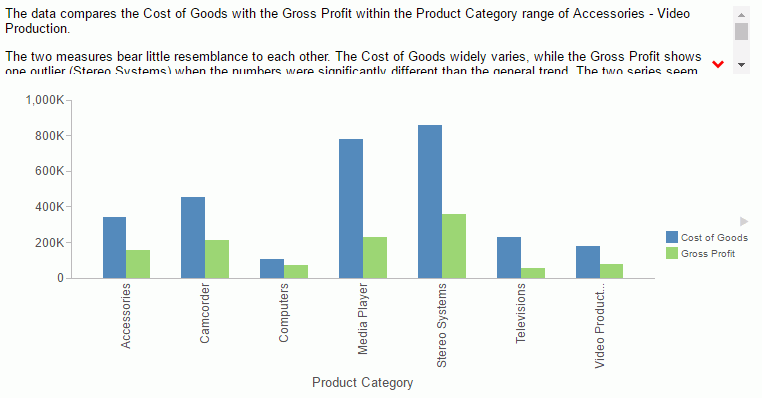
The following request generates a chart with a red dock button that has a diameter of 25 pixels.
GRAPH FILE WF_RETAIL_LITE
SUM COGS_US GROSS_PROFIT_US
BY PRODUCT_CATEGORY
ON GRAPH PCHOLD FORMAT JSCHART
ON GRAPH SET LOOKGRAPH BAR
ON GRAPH SET STYLE *
INCLUDE=IBFS:/FILE/IBI_HTML_DIR/ibi_themes/Warm.sty,$
TYPE=DATA, COLUMN=COGS_US, BUCKET=y-axis, $
TYPE=DATA, COLUMN=GROSS_PROFIT_US, BUCKET=y-axis, $
TYPE=DATA, COLUMN=PRODUCT_CATEGORY, BUCKET=x-axis, $
*GRAPH_JS
"narrativeText":
      {
       "enabled": true,
       "label": {
               "font": "10pt Sans-Serif",
               "color": "black",
               "align": "left"
              },
       "backgroundColor": "white",
       "dockButton":
               {
                "enabled": true,
                "size": 10,
                "color": "red"
               },
        }
*END
ENDSTYLE
END
The initial output is shown in the following image, where the button is pointing toward the chart.
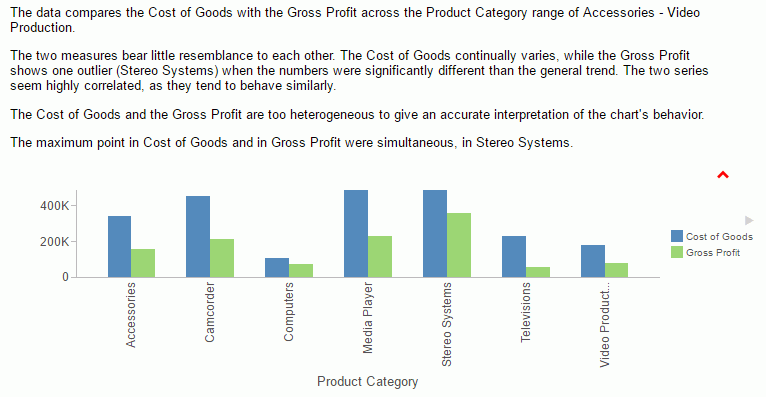
The following image shows the text box expanded after the dock button is clicked.
Example: Generating a Narrative for Related Measures
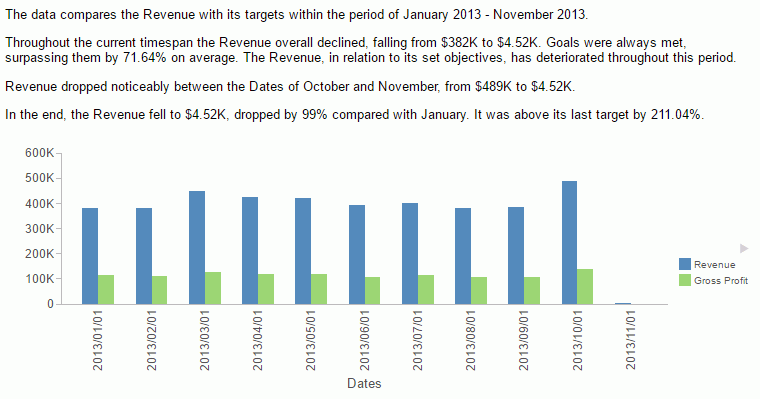
The following request describes revenue for the date period, using gross profit as its target values.
DEFINE FILE WF_RETAIL_LITE
Dates/YYMD=TIME_DATE_MONTH_COMPONENT;
END
GRAPH FILE WF_RETAIL_LITE
SUM REVENUE_US GROSS_PROFIT_US
BY Dates
ON GRAPH PCHOLD FORMAT JSCHART
ON GRAPH SET LOOKGRAPH BAR
ON GRAPH SET STYLE *
INCLUDE=IBFS:/FILE/IBI_HTML_DIR/ibi_themes/Warm.sty,$
TYPE=DATA, COLUMN=REVENUE_US , BUCKET=y-axis, $
TYPE=DATA, COLUMN=GROSS_PROFIT_US, BUCKET=y-axis, $
TYPE=DATA, COLUMN=Dates, BUCKET=x-axis, $
*GRAPH_JS
  "narrativeText":
   {
    "enabled": true,
    "maxSize": "40%",
    "label": {"font": "10pt Arial"},
    "textGenerationAPI":
       {
        "inputChart": {
            "mainDimensionOrdered": true,
            "multiSeriesType":  "VALUE_VS_REFERENCE",
            "disableInterpolation": true,
                    },
        "measures":
           [
            {"unit": "$"},
            {"unit": "$"}
           ],
       }
     }
*END
ENDSTYLE
END
The output is shown in the following image.
Example: Setting the Unit for Measures in the Narrative
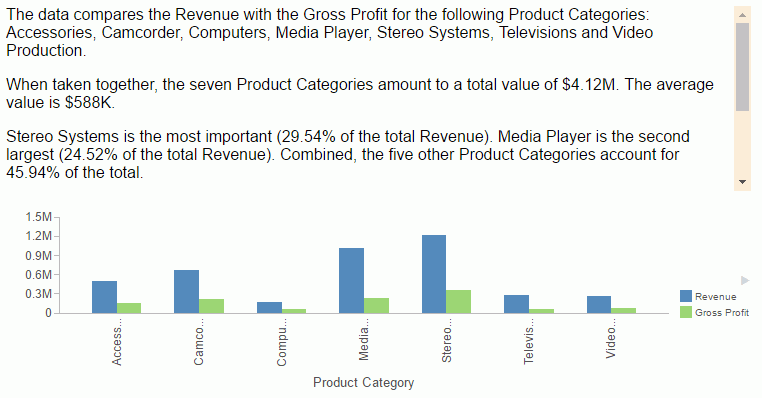
The following request sets the dollar sign ($) as the unit for both measures and makes the text box larger.
GRAPH FILE WF_RETAIL_LITE
SUM REVENUE_US GROSS_PROFIT_US
BY PRODUCT_CATEGORY
ON GRAPH PCHOLD FORMAT JSCHART
ON GRAPH SET LOOKGRAPH BAR
ON GRAPH SET STYLE *
INCLUDE=IBFS:/FILE/IBI_HTML_DIR/ibi_themes/Warm.sty,$
TYPE=DATA, COLUMN=REVENUE_US , BUCKET=y-axis, $
TYPE=DATA, COLUMN=GROSS_PROFIT_US, BUCKET=y-axis, $
TYPE=DATA, COLUMN=PRODUCT_CATEGORY, BUCKET=x-axis, $
*GRAPH_JS
  "narrativeText": {
    "enabled": true,
    "maxSize": "50%",
    "label": {"font": "12pt Arial"},
    "textGenerationAPI": {
        "inputChart": {
            "mainDimensionOrdered": false,
            "multiSeriesType":  "UNRELATED",
            "disableInterpolation": true,
                    },
        "measures": [
               {"unit": "$"},
               {"unit": "$"}
               ],
                       }
                 }
*END
ENDSTYLE
END
The output is shown in the following image.
Example: Providing Your Own Narrative
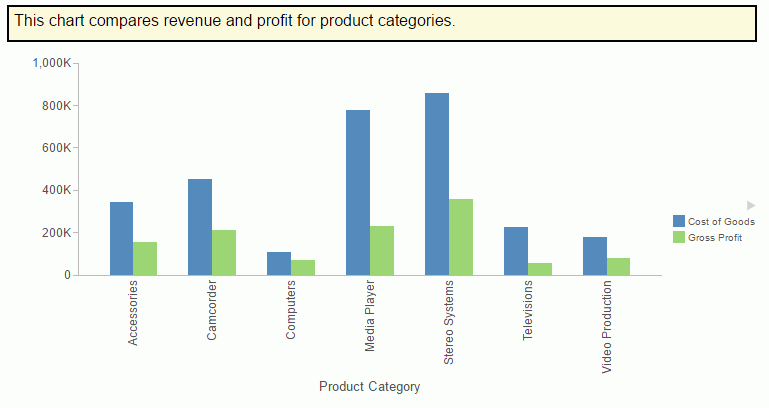
The following request provides a narrative as text in the content property. Note that all content must be supplied as a single line in the request.
GRAPH FILE WF_RETAIL_LITE
SUM COGS_US GROSS_PROFIT_US
BY PRODUCT_CATEGORY
ON GRAPH PCHOLD FORMAT JSCHART
ON GRAPH SET LOOKGRAPH BAR
ON GRAPH SET STYLE *
INCLUDE=IBFS:/FILE/IBI_HTML_DIR/ibi_themes/Warm.sty,$
TYPE=DATA, COLUMN=COGS_US, BUCKET=y-axis, $
TYPE=DATA, COLUMN=GROSS_PROFIT_US, BUCKET=y-axis, $
TYPE=DATA, COLUMN=PRODUCT_CATEGORY, BUCKET=x-axis, $
*GRAPH_JS
"narrativeText":
  {
    "enabled": true,
    "content": "This chart compares revenue and profit for product categories.",
    "label": {
             "font": "12pt Sans-Serif",
             "color": "black",
             "align": "left"
           },
    "backgroundColor": "cornsilk",
    "border": {
              "width": 2,
              "color": "black",
              "dash": ""
            },
    "textGenerationAPI":
     {
             "inputChart":
             {
               " mainDimensionOrdered": false,
                "multiSeriesType": "UNRELATED",
             },

     }
  }
*END
ENDSTYLE
END
The output is shown in the following image.
Example: Using Concatenated Dimensions
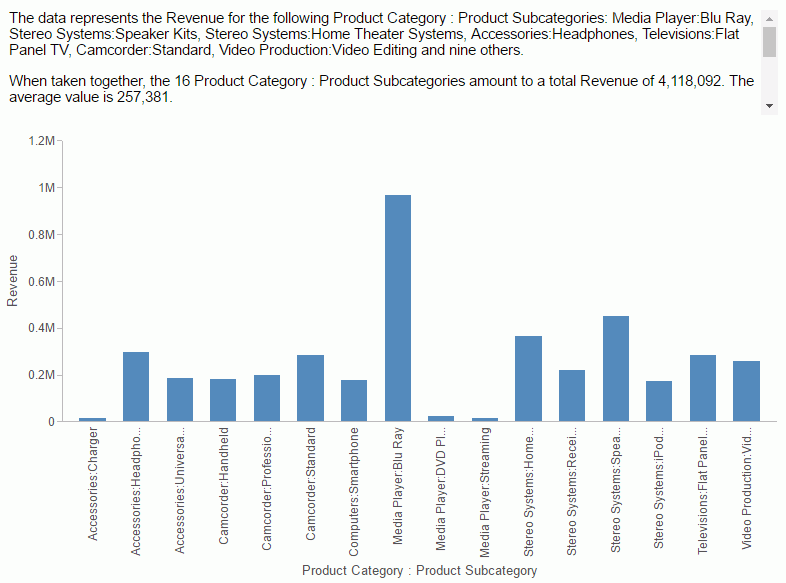
The following request uses two dimensions and one measure. The dimensions are required to be concatenated:
GRAPH FILE wfretail82/wf_retail_lite
SUM REVENUE_US
BY PRODUCT_CATEGORY
BY PRODUCT_SUBCATEG
ON GRAPH PCHOLD FORMAT JSCHART
ON GRAPH SET LOOKGRAPH BAR
ON GRAPH SET AUTOFIT ON
ON GRAPH SET STYLE *
INCLUDE=IBFS:/FILE/IBI_HTML_DIR/ibi_themes/Warm.sty,$
TYPE=REPORT, TITLETEXT='WebFOCUS Report', ORIENTATION=LANDSCAPE, $
TYPE=DATA, COLUMN=PRODUCT_CATEGORY, BUCKET=x-axis, $
TYPE=DATA, COLUMN=PRODUCT_SUBCATEG, BUCKET=x-axis, $
TYPE=DATA, COLUMN=REVENUE_US, BUCKET=y-axis, $
*GRAPH_JS
"narrativeText": {
                "enabled": true,
               "textGenerationAPI":
                      {
                        "inputChart": {
                        "mainDimensionOrdered": false
                                    },
                      }
                  },

"xaxis":{"labels":{"nestingConcatSymbol":":"}}
*END

ENDSTYLE
END

-RUN
Note: Concatenated labels are the default label option for the x-axis, and the default concatenation symbol is the colon (:). To concatenate dimensions manually, you can supply a concatenation symbol for the x-axis labels using the nestingConcatSymbol property, as shown in this example.
The output is shown in the following image.
| WebFOCUS | |
|
Feedback |