Administration Console Configuration
This section describes the enhancements to the Administration Console Configuration tab.
Consolidation of Autoprompt Parameters
|
Topics: |
In Release 8.2 Version 01, the Parameter Prompting Type, the Default Template, and Default HTML Template settings were consolidated. This consolidation streamlines the options that you need to select when choosing an Autoprompt Template.
Learn More
For more information, see Responsive Autoprompt.
InfoAssist+ Auto Drill Properties
The Auto Drill Properties section has been added to the InfoAssist+ Properties page of the Configuration Tab on the Administration Console. Settings in this section control the use of drill-down navigation options in reports and charts configured to use Auto Drill functionality, as shown in the following image.
These options enable you to control how certain aspects of Auto Drill display and function when working with reports and charts in InfoAssist+ with Auto Drill enabled. The new settings include:
-
Single Click Navigate. Enables the use of single click navigation when using Auto Drill in a report or chart. This option is disabled, by default. Therefore, top-level Auto Drill report entries display the Drilldown menu in response to a single click. If this check box is selected, single click navigation is enabled and you can navigate the hierarchy of your data without using standard Auto Drill menus.
-
Breadcrumbs. Controls the display of a breadcrumb trail when using Auto Drill in a report or chart. A breadcrumb trail defines your current location in the hierarchy of your data source and enables you to navigate back and forth between different levels in your data.
The Breadcrumbs option is enabled by default. Therefore, a breadcrumb trail automatically displays along the top of the canvas when navigating the hierarchy of your data. If this option is cleared, a breadcrumb trail does not display, giving you the option of hiding the navigation trail in your reports or charts.
-
Restore Original. Controls the display of the Restore Original option in the Drilldown menu when using Auto Drill in a report or chart. The Restore Original option enables you to start your data analysis over by re-executing the original Auto Drill request.
This Restore Original check box is selected, by default, and the option appears in the Drilldown menu. If this option is cleared, the Restore Original option does not appear in the Drilldown menu.
-
Drill Up. Controls the display of the Drill Up option when using Auto Drill in a report or chart. The Drill Up option refreshes the report with results based on the next level above the current level in your data source. The Drill Up option displays on the Drilldown menu when working with an Auto Drill-enabled report or chart. You can clear this checkbox so that the Drill Up option does not display on the Drilldown menu.
-
Drill Down. Controls the display of the Drill Down option when using Auto Drill in a report or chart. The Drill Down option refreshes the report with results based on the next level below the current level in your data source. The Drill Down option displays on the Drilldown menu when working with an Auto Drill-enabled report or chart. You can clear this check box so that the Drill Down option does not display on the Drilldown menu.
To open and review these properties:
- In the BI Portal, on the Menu bar, click Administration, and then click Administration Console.
- On the Configuration tab, under the Application Settings folder, click InfoAssist+ Properties.
- Scroll down to the Auto Drill section and review the default settings.
- Click each check box to select or clear the option it represents.
Library Item Default Action
You can now use the new Library Item Default Action setting to control the result when you view a library item in the WebFOCUS Environments Tree or BI Portal Resources tree. You can select the latest version of the report (Last) or a list of report versions (Versions).
To view the Library Item Default Action setting, in the Administration Console, on the Configuration tab, expand the Application Settings folder and click Other, as shown in the following image.
The value you select in this setting appears first in the shortcut menu when you right-click a library item in the WebFOCUS Environments Tree or BI Portal Resource tree and click View.
Adding Comments to WebFOCUS Configuration Files
When placed at the start of a line in a configuration file, the number sign (#) character converts that line into a comment, excluding the variables or commands in that line from execution when WebFOCUS invokes this file. You can use this feature to convert a variable into a comment. You can also use this feature to add comments that include notes, explanations, and reminders about settings and the values assigned to them that appear in these files.
To convert a variable into a comment, type a number sign (#) as the first character of the line in which the variable appears. To add a comment, start a new line, type the number sign (#), and then type a brief note, explanation, or reminder. When your changes are complete, click Clear Cache from the Administration Console menu bar to save your changes to the configuration file.
Add Namespace When Creating Users by Group Administrators (IBI_USER_NAMESPACE)
To allow Group Administrators to create users in SaaS multi-tenant implementations, you can utilize the Add Namespace (IBI_USER_NAMESPACE) setting, which will automatically add the namespace of the Group Administrator who is creating a new user to the name of that user.
The additional level of identification provided by the use of a namespace helps prevent conflicts when the same name is assigned to users in more than one group, and supports SaaS installations that assign users to multiple tenant groups.
When set to (NONE), the default setting, user names do not include a namespace.
When set to PREFIX, the namespace, followed by a slash (\), precedes the user name. For example, if a Group Administrator signs in as tenant1\groupadmin, tenant1 is the namespace for this Group Administrator and all of the users for whom this Group Administrator is responsible. When creating users, the namespace of the Group Administrator is automatically prepended to all new user names when created: tenant1\username.
When set to SUFFIX, the namespace, preceded by an at sign (@), follows the user name. For example, if a Group Administrator signs in as groupadmin@tenant1.com, the namespace of the Group Administrator is tenant1.com. The namespace of the Group Administrator is appended to all new user names when created: username@tenant1.com.
To view the Add Namespace when creating users by Group Administrators (IBI_USER_NAMESPACE) setting, in the Administration Console, on the Security tab, click the Advanced page under the Security Configuration folder. The new setting appears at the bottom of the list, as shown in the following image.
Event Log Repository Database Error Messages
When setting the log level for org.eclipse.persistence to DEBUG or TRACE, the event.log will contain tracing information that includes a list of the bound parameters for SQL queries. You can set the log level for org.eclipse.persistence on the Log Files page of the Administration Console, Diagnostics tab.
Maximum content size of multipart requests (IBI_MAX_CONTENT_SIZE)
You can now use the Maximum content size of multipart requests setting to define the maximum size for data files uploaded to the Repository or the EDA Server. Data files that are larger than the value in this setting cannot be uploaded. The default value is 2048 megabytes. The maximum allowable value is 10240 megabytes. A value of -1 deactivates this setting.
To view this setting, in the Administration Console, on the Configuration tab, expand the Application Settings folder and click Filters.
Maximum memory size of uploads, before cached (IBI_UPLOAD_MAX_MEMORY)
You can now use the Maximum memory size of uploads, before cached setting to define the maximum amount of memory that data from files uploaded to the Repository or the EDA Server can occupy. During the upload process, data moves into memory until it reaches the limit defined in this setting. Any additional data is temporarily cached to disk. The default value is 256 megabytes. A value of -1 deactivates caching.
To view this setting, in the Administration Console, on the Configuration tab, expand the Application Settings folder and click Filters.
Allowed File Extensions to Upload (IBI_UPLOAD_EXTENSIONS)
The Allowed File Extensions to Upload setting now limits the type of file you can create or upload through the BI Portal. Files that do not use one of the extensions listed in this setting cannot be uploaded to the BI Portal or created within it. The list includes the following file extensions, by default: .acx, .bmp, .css, .doc, .docx, .fex, .gif, .htm, .html, .ico, .jpeg, .jpg, .js, .mas, .pdf, .png, .ppt, .pptx, .sty, .svg, .txt, .xls, .xlsx, .xml.
To view the Allowed File Extensions to Upload setting, in the Administration Console, on the Configuration tab, expand the Application Settings folder and click BI Portal.
Working With Log Files
The new Log Files page displays links to all log files in a single location where you can review or capture copies of them instantaneously. This centralized location makes it easy to locate log files and the system events they contain, whenever you must provide them to the Customer Support Team for troubleshooting or analysis. The Log Files page appears on the Diagnostics tab of the Administration Console. The main grid lists log files in alphabetical order by name, identifies the pages or events that contributed entries to that log, and identifies the level of events captured by that log, from high level events to low level events. The Zip All button saves copies of the current version of all log files into a single zip file. You can use this button to capture records of system events from the current day whenever necessary.
Working With Log Pages
Log pages list detailed system event records in order of the time of their occurrence, from the earliest event on a specific day to the most recent. Features on this page help you navigate through the log, or retrieve a copy of the log from a previous date. To open a log file for review, click the link to that log file from the Log Name column on the Log Files page. The page for your selected log file opens in a separate window. You can use the Save or Print command in your browser to save or print a copy of the log page, or you can capture a zipped copy of it using the Zip All button from the Log Files page.
Custom Sign-In Messages
Using the Sign-In Message property, you can now display a custom text message to users as they sign in to the BI Portal. In the Configuration tab of the Administration Console, expand the Application Settings folder, and click BI Portal. You can paste your text or type text in the Sign-In Message field, as shown in the following image.
You can make this a general message, or make it topical and update it as needed. This message appears in the Messages dialog box, as shown in the following image.
If you leave the Sign-in Message field blank, the Messages dialog box does not display when a user signs in to the BI Portal.
Change Management Package Zip File Downloads
|
How to: |
The change management export process now creates zip files containing change management packages as well as folders that contain the expanded contents of the zip file. The creation of this zip file takes place automatically during the export process, and it stores zip files on the server, in the change management export directory, drive:\ibi\WebFOCUS82\cm\export, by default.
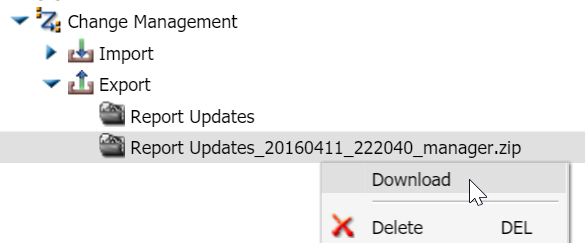
Procedure: How to Download a Change Management Package Zip File
The export process saves a CM zip file to drive:\ibi\WebFOCUS82\cm\export. The download process takes that CM zip file, and downloads it to your local machine. You can then transfer the copy of that CM zip file to another WebFOCUS environment for use as a change management package.
- In the Resources tree, expand the Change Management node.
- Expand the Export node.
- Right-click the change management package zip file you
want to download, and then click Download,
as shown in the following image.
Change Management Package Zip File Uploads
|
How to: |
The change management export process now accommodates updates from change management package zip files as well as folders that contain the expanded contents of a CM zip file.
Procedure: How to Upload a Change Management Package Zip File
The zip file upload process saves a copy of a CM zip file stored on your local machine to the change management import directory on the server, drive:\ibi\WebFOCUS82\cm\import. You can then import the copy of that CM zip file to WebFOCUS.
- Open the Change Management node, right-click Import, and then click Upload a Zip File.
- In the Upload a Zip File dialog box, click Browse, navigate to the location where you have saved the change management package, click the CM zip file you want to upload, and then click Open.
- Ensure that the correct CM zip file appears in the File
to Upload field, and decide whether or not to import files from
the package as published or unpublished files.
- To establish the CM zip file as published after the upload is complete, select the Publish Documents check box. This is the default setting.
- To establish the CM zip file as private after the upload is complete, clear the Publish Documents check box.
- Click Upload.
A confirmation dialog box opens. Click OK to complete the upload.
- In the Upload a Zip File dialog box, click Close.
If an entry for the new zip file does not appear below the Import node, right-click it, and then click Refresh.
Sending WebFOCUS Variables to the Reporting Server Profile
You can now send secure requests from the WebFOCUS Client to the Reporting Server that include a list of variables and their associated values that enable the Reporting Server profile, using conditional logic, to activate different DBMS settings and create a customized server environment in response. For example, one set of values could activate a test environment and a different set of values could activate a production environment.
By including variables in the request, the Reporting Server can tailor its environment to the specific needs of each individual client. The Custom Settings page allows Administrators to establish the variables and their accompanying values that will invoke an appropriate server response directly from the client.
To open the Custom Settings page, from the BI Portal Menu bar, click Administration, and then click Administration Console. Under the Application Settings folder, click Custom Settings. You can use this page to type the variables and their accompanying values that are to be included in Reporting Server Requests.
Paths to be Executed on User Sign-in (IBI_SIGNIN_PATHS)
You can now use the Paths to be executed on user Sign-in setting to define the paths to all procedures that run when a user signs in to a portal or to web services. This setting is blank, by default, and no procedures run in response to user sign in. To configure a list of one or more procedures to run in response to user sign in, type the path name for each of those procedures in this setting, and separate each path name with a comma.
The ability to run multiple procedures can serve a variety of purposes. For example, administrators can use this setting to run a procedure that sends a message of the day to users upon sign in, or to run a procedure that initializes the environment and establishes a procedure within the repository that creates a single foccache ticket that can be used for all subsequent requests.
To view the Library Item Default Action setting, from the BI Portal Menu bar, click Administration, and then click Administration Console. On the Configuration tab, expand the Application Settings folder and click Other.
Administration Console Security Tab
A new tab dedicated to the configuration of security settings appears in the Administration Console. This tab contains the Internal, External, and Advanced pages that configure general security settings for your installation of WebFOCUS. It also contains folders for four zones, Default, Mobile, Portlet, and Alternate, which contain pages that enable Administrators to customize user authentication, URL request matching, and session management settings to meet the varying requirements of users in each of these four zones.
This new tab makes all security configuration and testing resources available in a single location within the WebFOCUS graphic user interface. There is no need to open, inspect, and update settings in external security configuration files. The interface also helps protect the quality of information added to the Reporting Server configurations by prompting Administrators when they enter duplicate records or data that does not conform to the requirements of a setting.
To open the External Security pages, from the BI Portal Menu bar, click Administration, and then click Administration Console. Click the Security Tab. Nodes for the general security settings appear under the Security Configuration folder. Folders for the four zones appear beneath the general security settings. Each zone folder contains the same three nodes, Authentication, Request Matching, and Session Management.
Reporting Servers Features
New features on the Administration Console Configuration tab provide Administrators with the server configuration and management tools that maintain client-server connections for an installation of WebFOCUS. These features appear under the Server Connections folder, the Alternate Server Mapping folder, the Cluster Manager folder, and the Legacy Cluster folder. Once configured, individual connections, mappings, and clusters appear under these folders as nodes. When you click an individual node, configuration information about the connection, mapping, or cluster appears on the associated configuration page. When you right-click an individual node, you can edit, test, or delete an individual connection, mapping, or cluster.
These new features make all reporting server connection configuration and testing resources available in a single location within the WebFOCUS graphic user interface. There is no need to open or inspect settings in external configuration files. The interface also helps protect the quality of information added to the Reporting Server configurations by prompting Administrators when they enter duplicate records or data does not conform to the requirements of a setting.
To open the new Reporting Server features, from the BI Portal Menu bar, click Administration, and then click Administration Console. On the Configuration tab, expand the Reporting Servers folder, and then expand the Server Connections folder. Click a node to open the corresponding page containing configuration details for that server connection, mapping, or cluster. Expand the Advanced tab on the configuration page to display advanced configuration settings. To test any server, right-click the icon for it, point to Test, and then click TABLE Request, GRAPH Request, or Stored Procedure.
Display Deferred Request Submitted Notification Setting
You can now use the new Display Deferred Request Submitted Notification setting to control the display of the Deferred Report Notification and eliminate the confirmation that the request to run a deferred report has been successfully submitted. If you select this check box, the default setting, whenever a user runs a deferred report, a notification appears prompting the user that the report has been submitted and providing a link directly to the Deferred Report Status interface that shows the status of the deferred report. If you clear this check box, no notification appears after a user submits a deferred report.
The ability to suppress the Deferred Report Notification enables an Administrator to free users who must run a large number of reports from having to close the notification for every individual report, speeding the process and requiring less effort.
To view the Display Deferred Request Submitted Notification setting, from the BI Portal Menu bar, click Administration, and then click Administration Console. Under the Application Settings folder, click Deferred Reporting.
Prompt for Custom Deferred Report Description Setting
You can use the new Prompt for Custom Deferred Report Description setting to control the display of the Deferred Report Description option in a new page or within the Autoprompt page when users submit a new deferred report request. If you select this check box, the default setting, users are prompted to optionally customize the description of the deferred report, which defaults to the title of the report being run deferred. When this check box is cleared, the title of the report being submitted to run deferred is assigned to the deferred report description automatically, and the Deferred Report Description prompt does not appear.
This setting allows Administrators to suppress the display of the Deferred Report Description option when end users do not need to customize the descriptions of deferred reports, or to retain it if they believe end users require the opportunity to customize the description of each deferred report.
Note: When the Custom Deferred Report Descriptions setting is selected, users can select the Use Title for Deferred Report Description reports (FEX) property to specify the use of the title value of the report for the deferred description. This allows the user to suppress the Deferred Report Description option for specific reports. This property is available in the Properties option for a report (FEX).
To view the Prompt for Custom Deferred Report Description setting, from the BI Portal Menu bar, click Administration, and then click Administration Console. On the Configuration tab, under the Application Settings folder, click Deferred Reporting.
Support for Embedded BI Applications and Cross-Origin Resource Sharing
In Release 8.2 Version 01M, the new Cross-Origin Settings dialog box now appears on the Security tab of the Administration Console, as shown in the following image.
This dialog box contains two settings that activate and secure the use of embedded WebFOCUS content and resources in external applications. The Allow Embedding check box allows WebFOCUS content and resources to be embedded within a Frame or Iframe served from a third party application. The range of applications can include all third party applications, if the Allowed Origins field beneath it contains the asterisk wild card character (*), or it can be limited to specific applications, if the Allowed Origins field contains a comma-delimited whitelist of allowed URLs.
The Allow Cross-Origin Resource Sharing check box allows WebFOCUS content and resources to be utilized within Ajax requests issued from the browser of a user of one of the comma-delimited whitelisted URLs identified in the Allowed Origins field beneath it. This section of the dialog box also contains a default configuration of allowed methods, headers, and other components of the cross-origin resource sharing standard established by the World Wide Web Consortium.
For more information about embedding WebFOCUS content in third party applications, see the WebFOCUS Embedded Business Intelligence User's Guide. For more information about the configuration of this dialog box, see the topic Allowing Embedding, and the topic Allowing Cross-Origin Resource Sharing in the Security and Administration Manual.
To open the Cross-Origin Settings dialog box, from the BI Portal Menu bar, click Administration, and then click Administration Console. On the Administration Console, click the Security tab. On the Security tab, click the Authentication node under any of the folders for the four security zones. On the Authentication page, click Cross-Origin Settings.
Allow Account Creation On Sign In
In Release 8.2 Version 01M, the Allow Account Creation On Sign In setting, found on the External Page of the Administration Console Security Tab, now includes the value. Off. This value deactivates the automatic creation of a user account whenever a new user attempts to sign in to WebFOCUS for the first time. When this value is selected, administrators must use the Security Center commands New User or Import Users to create or upload accounts for all new users before their first sign in attempt.
To locate this updated setting, from the BI Portal Menu bar, click Administration, and then click Administration Console. On the Administration Console, click the Security tab, and then, under the Security Configuration folder, click the External node. To make this setting available, select the Enable External Security check box. Type the Server Administrator ID and click Connect.
For more information about this updated setting, see the topic Understanding External Security Page Settings in the Security and Administration Manual.
Synchronize User Information Check Box
In WebFOCUS Release 8.2 Version 01M, the Synchronize User Information check box, found on the External page of the Security tab in the Administration Console, includes two new options that are activated when this check box is selected. These options identify the source of automatic updates made to the Description and EMail Address fields assigned to a WebFOCUS User whenever that user signs in.
When the With Authentication Provider option is selected, WebFOCUS receives updated Description and EMail Address field information from the authentication provider. This option is selected, by default.
When the With Authorization Provider option is selected, WebFOCUS receives updated Description and EMail Address field information from the authorization provider.
These options apply to users who sign in to a security zone using Form Based authentication as well as Pre-authentication, as long as they use External Security.
To locate these new options, in the Administration Console, click the Security tab, and then, under the Security folder, click the External node. The Synchronize User Information check box becomes available only after you select the Enable External Security check box, type a valid Server Administrator ID, and click Connect. The new options become available only after you select the Synchronize User Information check box.
| WebFOCUS | |
|
Feedback |