General Reports
|
Topics: |
These reports provide overviews of the data sources and procedures being monitored, as well as those procedures in the server application path that have never been executed. General Reports appear only on the Web Console.
To access any of the reports in the Web Console, click Resource Management on the toolbarsidebar and expand the Reports folder. Right-click the desired report, and click Run from the context menu. After specifying report filters, click View Report.
Monitored Sessions
The Monitored Sessions report provides an overview of the procedures and commands that are being monitored, including the number of records processed, and the rows returned.
The following image shows the Monitored Sessions report.

This report has one hyperlink that allows you to drill down to other reports, as described in the following table.
|
Click a hyperlink in the: |
Report Generated |
Description |
|---|---|---|
|
Date column |
Session Summary Report by Hour |
Lists the procedures and commands that are being monitored by hour. Allows you to drill down to see this report by quarter, and then by detail. |
Monitored Commands
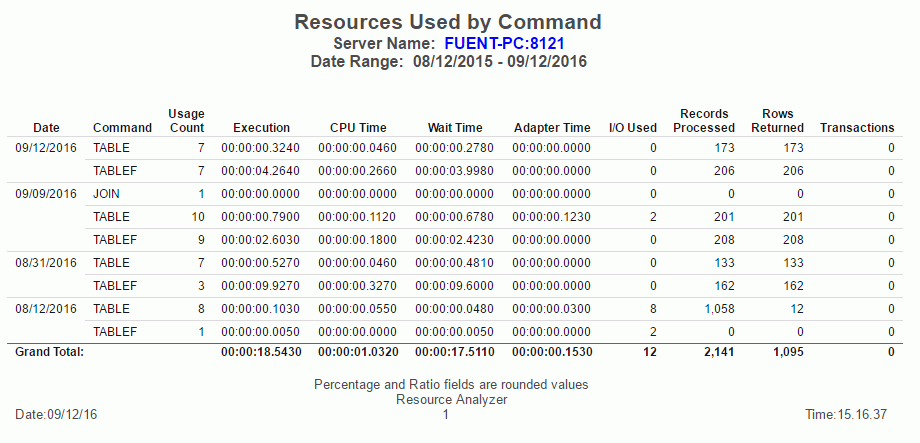
The Monitored Commands report provides an overview of the resources being used by each command, including the execution, CPU, and wait time.
The following image shows the Monitored Commands report.

Repository Statistics
The Repository Statistics report provides an overview of the total number of records collected during the time period specified.
The following image shows the Repository Statistics report.

Data Sources Never Used
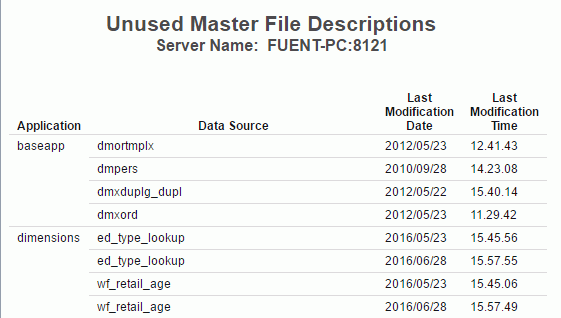
The Data Sources Never Used report provides an overview of unused data sources, including the application directory they are found in, and the last modification date and time.
The following image shows the Data Sources Never Used report.

Procedures Never Used
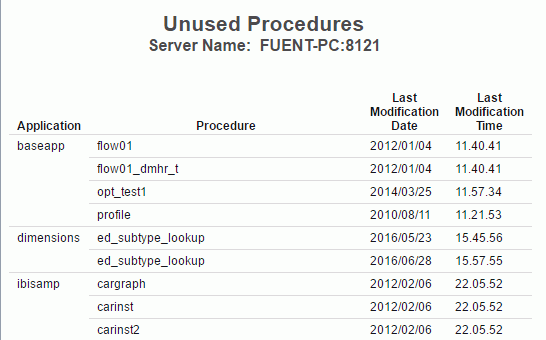
The Procedures Never Used report lists those procedures in the application path of the server that have never been executed.
The following image shows the Procedures Never Used report.

ACI Monitoring
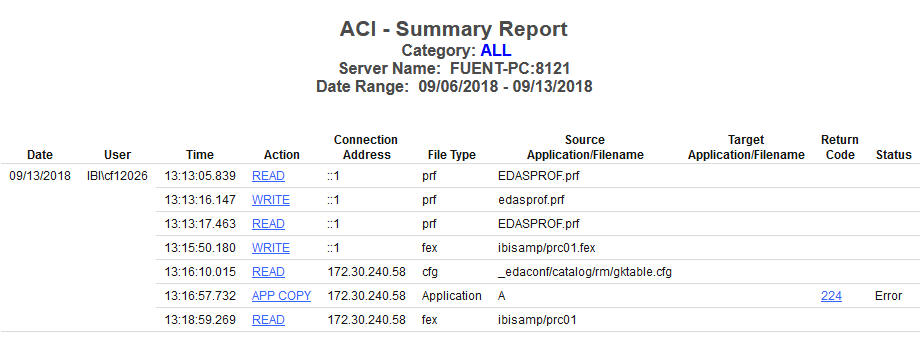
The ACI Monitoring report provides information about changes to the server configuration files, and user application files. Actual changes made are not reported, but who, when, and the type of access is shown. To access this report, you must have the Access Control setting that can be found in the Repository Properties pane enabled.
You can specify the following parameters in the Report Management report filter page for this report:
-
User name. Allows you to run the report based on user. The default value is All.
- Option. Allows you to filter based on the type of access. The available options are All, Read file, Write file, Delete File, Error, and E-Mail. The default option is All.
- Category. Allows you to specify the types of files that you want to audit. Options are All, System files, or User files. The default value is All.
- E-Mail. Allows you to view the sender and receiver information in the form of their individual email address for any email messages that were sent in the Web Console.
The following image shows the ACI Monitoring report.

This report has two hyperlinks that allow you to drill down to additional information. The following table lists and describes these hyperlinks.
|
Click a hyperlink in the: |
Description |
|---|---|
|
Action column |
Opens a dialog box that shows the actual command that was issued for the operation. If you filter a report by E-Mail, the hyperlink will open a dialog box that shows the email address for both the sender and receiver of an email sent in the Web Console. |
|
Return Code column |
Opens a dialog box that provides further explanation on the error code listed. |
| WebFOCUS | |
|
Feedback |