Using the Chart Template Engine to Customize Tooltips
|
Reference: |
A template is a special string of characters that the chart engine will dynamically replace with chart component information when it renders the chart. A template is made up of macros. Macros are strings enclosed in a double set of curly braces. Each macro is parsed and replaced independently to build a final string. The chart engine includes many pre-defined macros.
Macros can be parameterized. Parameters are a comma-separated list of strings, delimited with parentheses. The built in row_label and col_label macros are parameterized, so you can choose which row or column label to include. The first row is row zero (0). For example:
{{row_label(0)}}Some macros apply to chart attribute syntax. For information about chart attribute syntax, see WebFOCUS Chart Attribute Syntax.
Reference: Template Macros
The following lists the pre-defined macros for the chart template engine:
|
Macro |
Definition |
|---|---|
|
auto_tooltip_content |
Automatically generated tooltip text |
|
col_id |
Column number in a matrix chart |
|
col_label |
Column label in a matrix chart |
|
coloraxis_title |
|
|
data_page_slider_current_index |
Index position of the slider |
|
data_page_slider_current_label |
Label of the current slider position |
|
group_count |
Number of groups |
|
group_id |
Group number |
|
group_label |
Group label |
|
group_percent |
Percent for each series within the group |
|
group_sum |
Series sum for current group |
|
misc_id |
|
|
nested_label |
Group label |
|
object_id |
|
|
row_id |
Row number in a matrix chart |
|
row_label |
Row label in a matrix chart |
|
series_count |
Number of series in the request |
|
series_id |
Series number |
|
series_label |
Series label |
|
series_percent |
Percent of current series within all groups. |
|
series_sum |
Sum of current series for all groups. |
|
tooltipn |
The nth field in the tooltip attribute category. |
|
value |
The value represented by the series when using chart attribute syntax. |
|
xaxis_title |
x-axis title |
|
yaxis_title |
y-axis title |
|
zaxis_title |
z-axis title |
Example: Using the Template Engine in Tooltips
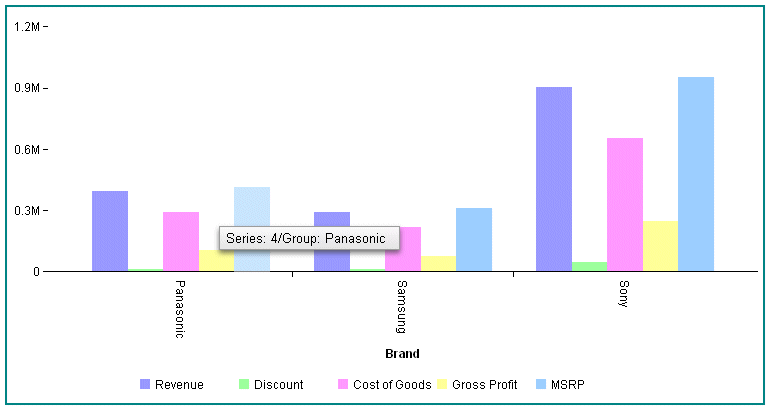
The following request generates tooltips that contain the series id and the group label:
GRAPH FILE WF_RETAIL_LITE
SUM REVENUE_US DISCOUNT_US COGS_US GROSS_PROFIT_US MSRP_US
BY BRAND
WHERE BRAND EQ 'Sony' OR 'Samsung' OR 'Panasonic'
ON GRAPH PCHOLD FORMAT JSCHART
ON GRAPH SET LOOKGRAPH VBAR
ON GRAPH SET STYLE *
*GRAPH_JS
border: {width: 2, color: 'teal'},
series: [
   {series: 'reset',
tooltip: 'Series: {{series_id}}/Group: {{group_label}}'},
]
*END
ENDSTYLE
END
The tooltip for series 4 in group 0 is shown in the following image:

Note: If your request uses chart attribute syntax, you must put tooltip customization properties in a *GRAPH_JS_FINAL block in the WebFOCUS StyleSheet. For information about chart attribute syntax, see WebFOCUS Chart Attribute Syntax.
| WebFOCUS | |
|
Feedback |