Filling Alternate Segments of Axis Grid Lines With a Specified Color
|
How to: |
The altFrameColor property fills every other segment of axis grid lines with a specified color.
Syntax: How to Fill Alternate Segments of Axis Grid Lines With a Specified Color
axisname:
{
  altFrameColor: color},
where:
- axisname
-
Can be:
- xaxis
- yaxis
- y2axis
- zaxis
- altFrameColor: color
-
Can be:
- A color defined by a color name or numeric specification string, or a gradient defined by a string.
- A JSON gradient definition.
For information about defining colors and gradients, see Colors and Gradients.
Example: Filling Alternate Segments of Axis Grid Lines With a Specified Color
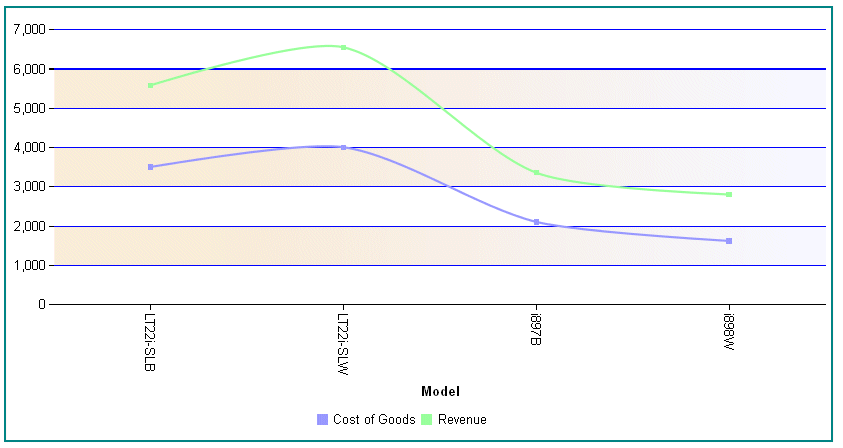
The following request against the WF_RETAIL_LITE data source generates a vertical line chart in which the sections between the yaxis major grid lines alternate between being transparent and having a gradient fill that transitions from antique white to ghost white:
GRAPH FILE WF_RETAIL_LITE
SUM COGS_US REVENUE_US
BY MODEL
WHERE PRODUCT_CATEGORY EQ 'Computers'
ON GRAPH PCHOLD FORMAT JSCHART
ON GRAPH SET LOOKGRAPH VLINE
ON GRAPH SET STYLE *
*GRAPH_JS
border: {width: 2, color: 'teal'},
blaProperties: {lineConnection: 'curved'},
yaxis: {altFrameColor:
'linear-gradient(0%,0%,100%,0%, 20% antiquewhite, 95% ghostwhite)',
  majorGrid: {visible:true,
  lineStyle: {width: 1,color: 'blue'}}
}
*END
ENDSTYLE
END
The output is:

| WebFOCUS | |
|
Feedback |