Controlling Chart Type Using the JSON chartType Property
This JSON property defines the chart type. However, it is recommended that you use the WebFOCUS LOOKGRAPH parameter to establish the chart type, when a corresponding LOOKGRAPH value exists. For information about the LOOKGRAPH parameter, see Controlling Chart Type Using LOOKGRAPH.
chartType: 'string'
where:
- string
-
Is a string enclosed in single quotation marks (') that defines the chart type. The default value is 'bar'.
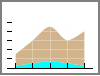
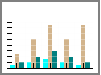
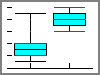
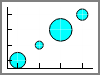
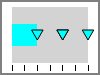
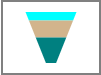
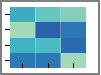
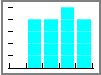
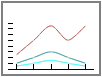
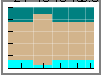
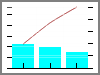
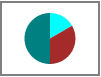
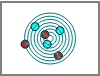
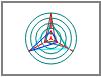
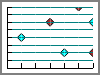
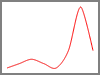
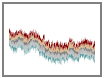
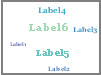
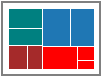
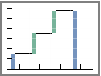
The valid chartType values, with illustrations of each chart type follow:
 |
 |
 |
 |
|
area |
area3d |
bar |
bar3d |
 |
 |
 |
 |
|
boxplot |
bubble |
bubblemap |
bullet |
|
|
 |
 |
 |
|
choropleth |
funnel |
gauge |
heatmap |
 |
 |
 |
 |
|
histogram |
line |
mekko |
parabox |
 |
 |
 |
 |
|
pareto |
pie |
polar |
radar |
 |
 |
 |
|
scatter |
sparkline |
streamgraph |
 |
 |
 |
 |
|
surface3d |
tagcloud |
treemap |
waterfall |
| WebFOCUS | |
|
Feedback |