Graph Invocation and Generation Options
There are several ways to create WebFOCUS graphs.
- Using FORMAT JSCHART to generate HTML5 graphs. HTML5 graphs are delivered to the browser as java code and run in the browser.
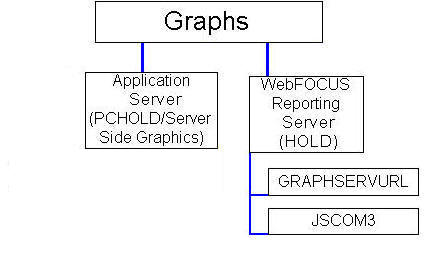
- On the web or application server (Server Side Graphics/PCHOLD), as explained in PCHOLD (Server Side) Graphics Overview.
- On the WebFOCUS Reporting Server (HOLD), as explained in HOLD Graphs Overview.
| WebFOCUS | |
|
Feedback |