Generating a Chart From a Report
In Developer Studio, when you generate a graph from a report, that graph is created on the right-side of the report, as shown in the following image.
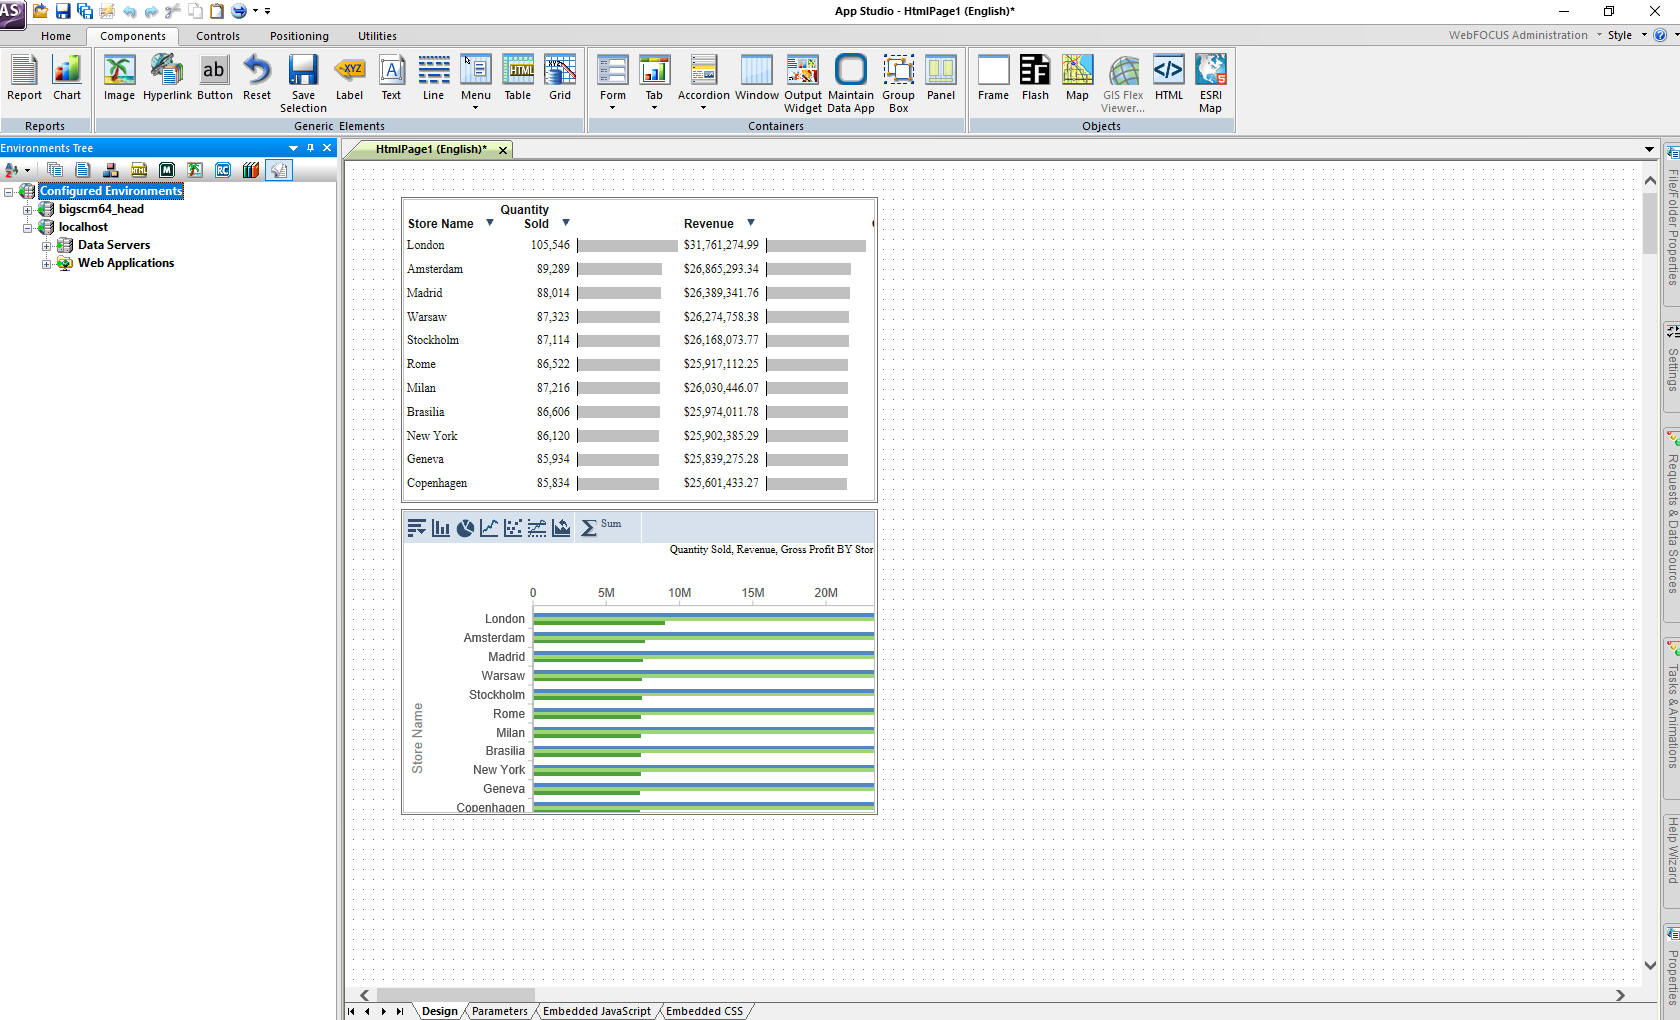
In App Studio, when you generate a chart from a report, that chart is created below the report, as shown in the following image.
| WebFOCUS | |
|
Feedback |