POLY_REGRESS: Polynomial Regression
Polynomial regression fits the target column to a polynomial expression of the predictor columns. The degree of the polynomial is specified as an input argument to the function.
Reference: Calculate a Polynomial Regression Column
POLY_REGRESS(options, degree, terms_generated,
        predictor_field1, predictor_field2, [...,] target_field)
where:
- options
-
Reserved for future use.
- degree
-
Integer
Is the degree of the polynomial. Low degree polynomials are recommended.
- terms_generated
-
Keyword
Controls the terms that are generated in the polynomial equation.
- ALL_TERMS generates the most general polynomial of degree degree based on the predictor fields.
- INTERACTION_ONLY generates only terms linear in each predictor X0, X1, . . ., and cross-terms of the form X0*X1*X2 of at most degree predictors are used.
- predictor_field1, predictor_field2, [...,]
-
Numeric
Are at least two predictor field names.
- target_field
-
Numeric
Is the target field.
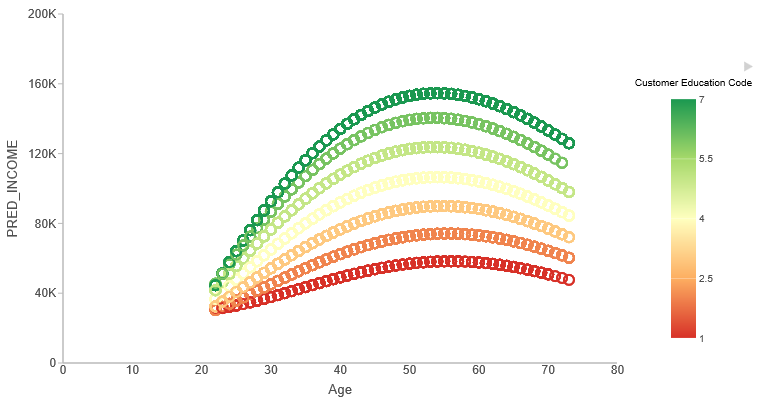
Example: Using POLY_REGRESS to Predict Income
The following scatter plot shows the predicted income values using polynomial regression of degree 4, with predictors education level, and age. The DEFINE FILE command creates virtual fields with correct numeric formats for use in the function.
DEFINE FILE wf_retail
EDUC_CODE/I2 TITLE 'Education Code'= DECODE
WF_RETAIL_EDUCATION_CUSTOMER.EDUCATION_DEGREE_TYPE (
'Professional Doctorates' 7,
'Doctorates' 6,
'Master''s Degrees' 5,
'Bachelor''s Degree' 4,
'Associate Degree' 3,
'High School' 2,
'No High School' 1,
ELSE 0);
END
GRAPH FILE wf_retail
PRINT
AGE
EDUC_CODE
COMPUTE PRED_INCOME/D20.2 =POLY_REGRESS('', 4, ALL_TERMS,
                                        AGE,
                                        EDUC_CODE,
                                        INCOME);
WHERE EDUC_CODE GT 0;
WHERE INCOME GT 12001.00;
WHERE AGE GT 21
ON TABLE PCHOLD
FORMAT JSCHART
ON TABLE SET LOOKGRAPH SCATTER
ON TABLE SET STYLE *
INCLUDE=IBFS:/FILE/IBI_HTML_DIR/ibi_themes/Warm.sty,$
TYPE=REPORT, CHART-ORIENTATION=HORIZONTAL, $
TYPE=DATA, COLUMN=N3, BUCKET=Y-AXIS, /*PRED_INCOME*/
$
TYPE=DATA, COLUMN=N1, BUCKET=X-AXIS, /*AGE*/
$
TYPE=DATA, COLUMN=N2, BUCKET=COLOR, /*EDUC_CODE*/
$
ENDSTYLE
END
The output is shown in the following image. Predicted income versus age is plotted, with education level as a parameter visualized by color.
| WebFOCUS | |
|
Feedback |