DataMigrator Workspace
|
Topics: |
Flows are built and modified in the DataMigrator workspace. Objects can be dragged into the workspace from the navigation pane and, when in process flow mode, from the process flow toolbar.
For data flows and process flows, the workspace consists of the following tabs:
- Data Flow tab. Build data flows to extract and move data from data source objects to data target objects. Arrows connect the objects and support the flow.
- Process Flow tab. Build process flows. Arrows connect the objects and support the flow.
- Text View tab. Allows you to view the underlying code for a flow.
Other tabs are available when creating different types of data flows:
- Direct Load Flow tab. Builds direct load flows. For information, see Creating a Direct Load Flow.
- DBMS SQL Flow tab. Builds DBMS SQL flows. For information, see Creating a DBMSSQL Flow.
Note: When building different types of data flows, a Process Flow and Text View tab are also available.
For synonyms, the workspace consists of the following tabs:
- Field View. Shows a combined view of the segment and field names used. A tree of the segments and columns in the synonym are shown on the left, with the attributes and values of the selected item on the right.
- Segment View. Shows the name used to identify the specified segment in a tree format.
- List View. Shows the field names used in a grid format.
- Modeling View. Shows a graphical representation of the synonym, which can be double clicked to access columns, sample data, and sample data with parent keys.
- Text View. Shows the code that describes the segments and fields of a synonym.
- Access File Text View. Shows the syntax behind an Access File of a synonym.
For details about synonyms, see Working With Synonyms.
Data Flow Tab
|
How to: |
|
Reference: |
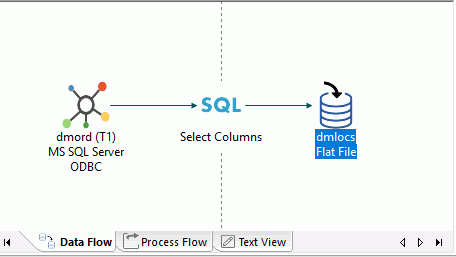
The Data Flow tab is where you build data flows to extract and move data from data source objects to data target objects. Arrows connect the objects and support the flow.
The following image is a sample of a simple data flow in the Data Flow tab.
For more information on working with process flows, see Designing a Data Flow.
Procedure: How to Validate a Flow
- On the Flow
tab, in the Tools group, click Validate.
The flow is checked for errors.
- If there
are no errors, the Valid dialog box opens, confirming that no errors or warnings were found.
If errors are found, a warning message appears.
- To exit the window, click OK. For more information about the error, click Details in the Warning window.
Reference: Moving Objects in the Workspace
Multiple objects can be selected in the workspace by selecting them while pressing the Shift or Ctrl keys. You can also hold down the Ctrl key while clicking the right mouse button. This will allow you to move or delete the selected items as a group.
Working With Columns, Variables, and Functions
|
How to: |
|
Reference: |
DataMigrator features a number of calculators for creating transformations and filters using columns, variables, and functions. These columns, variables, and functions can be used in the Synonym Editor to create virtual columns.
These items can be displayed either in a tree or in a list. When displayed in a list, they can be sorted either ascending or descending. You can also search for items.
You can customize the information that is available for columns, as well as how they are displayed.
Note: Tree view is the default for the calculators and for Synonym Editor. List view is the default for Join Properties and Column Selection (SQL object).
Reference: Column Symbols
Next to each column name, there is a symbol that indicates the type of column it is. The columns symbols are:
|
Symbol |
Description |
|---|---|
|
|
Key column |
|
|
Regular column Note: The icon will vary based on the format of the data source. |
|
|
Index column |
|
|
Virtual column Note: The symbol for columns in the synonym is gray, while the background for a source transformation (virtual column in the flow) is white. |
|
|
Source Transformation Note: This is only available in the Source Transformations dialog box. |
Reference: Column Header Shortcut Menu
To access the column header shortcut menu, right-click any column header.
The column header shortcut menu has the following options:
- Sort Ascending
-
Sorts the list of items in the selected column in ascending order.
- Sort Descending
-
Sorts the list of items in the selected column in descending order.
- Find
-
Allows you to search for a column
- Field View
-
Switches views of the synonyms.
- List View
-
Switches views of the synonyms.
Note: When in List View, clicking a column heading will sort the column grid on that heading.
- Best Fit
-
Optimizes the column widths for best viewing.
- Customize
-
Allows you to select what information is displayed for each column.
- Column naming display strategy
-
Controls the information that appears in trees and grids. The available options are Name, Title, and Description. If no title or description exists, the display will default to the alias.
- Paste Transforms
-
Pastes transformations from memory into the transformation list.
Procedure: How to Change the Display of Columns and Variables in a Calculator
To
open a calculator, click the Insert icon ![]() or the Compute icon
or the Compute icon  ,
or right-click the SQL object and click WHERE Filter or HAVING Filter.
Calculators open to the Columns/Variables tab using the default tree view. To change it:
- Right-click
the Display Name heading bar, as shown in the following
image.
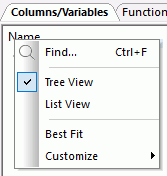
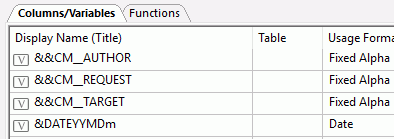
- Click List
View.
The columns and variables are now shown in a list, as shown in the following image.
Procedure: How to Change the Display of Functions in a Calculator
To open a calculator, click the Insert icon or the Compute icon, or right-click the SQL object and click WHERE Filter.
Calculators open to the Columns/Variables tab using the default tree view.
To change the display of functions:
- Click the Functions tab.
- Right-click the Display Name heading bar.
- Click List
View.
The functions are now shown in a list.
- Optionally, you can choose Sort Ascending or Sort Descending.
- Optionally, you can choose Best Fit, which will resize the column to fit its data.
Procedure: How to Change the Display of Columns in the Synonym Editor
Double-clicking a synonym opens the Synonym Editor.
- Right-click the Display Name heading bar.
- Select List
View.
The columns are now shown in a list.
- Optionally, you can choose Best Fit, which will resize the column to fit its data.
Procedure: How to Change the Information Displayed for Columns
The information displayed for columns is controlled by the Column Management pane of the Options dialog box.
In a calculator or the Synonym Editor:
- Right-click
the Display Name heading bar.
- Point to Customize and then click a column to add or remove from the shortcut menu.
- Optionally,
click More to add or remove multiple columns
or reorder them.
The Column Management pane of the Options dialog box opens.
For more information on the options available in the Column Management pane, see User Preferences - Column Management.
- Select the columns you want to appear by selecting their check boxes.
- Optionally, you can change the display order of the columns by moving them up or down in the Selected Columns field.
- Optionally, you can change the Column Name Display Strategy to control what appears in trees and grids. By default, the Title is displayed, but you can change it back to Name, which is more readable in calculations. You can have columns listed by Name, Alias, Title, or Description. If no Title or Description exists, the display will default to the Alias.
- Click OK.
The columns will now appear in the order you specify in calculators or the Synonym Editor.
Process Flow Tab
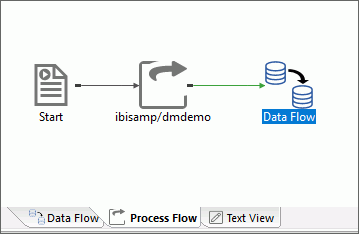
The Process Flow tab is where you build process flows. Arrows connect the objects and support the flow.
The following image is a sample of a simple process flow in the Process Flow tab.
For more information on working with process flows, see Designing a Process Flow.
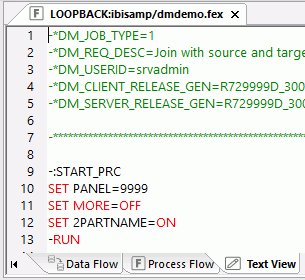
Text View Tab
The Text View tab allows you to view the underlying code for a flow.
Note: You can use Ctrl + F or select Find from the Edit menu to search the text. After you close the Find dialog box, you can press the F3 key to find the next occurrence and Shift + F3 to search backwards.
| WebFOCUS | |
|
Feedback |