|
|
|
Syntax: How to Create an Accordion Report With the Enhanced Interface
SET EXPANDBYROWTREE = {OFF|ON|ALL|n}
ON TABLE SET EXPANDBYROWTREE {OFF|ON|ALL|n}
where:
- OFF
-
Does not create an accordion report, with the enhanced interface. OFF is the default value.
- ON
-
Creates an accordion report, with the enhanced interface. This setting initially displays only the highest sort field level. To see rows on lower levels, click the plus sign (+) next to one of the displayed sort field values.
- ALL
-
Creates an accordion report, with the enhanced interface. This setting displays all sort field levels initially expanded. To roll up a sort field level, click the minus sign (-) row next to one of the sort field values on that level.
- n
-
Creates an accordion report, with the enhanced interface. This setting displays then sort field levels initially expanded. To roll up an expanded sort field level, click the minus sign (-) next to one of the sort field values on that level.
|
|
|
Example: Creating an Accordion Report With the Enhanced Interface
The following request against the GGSALES data source has four sort fields, REGION, ST, CATEGORY, and PRODUCT. The request uses the default StyleSheet and the default plus sign (+) and minus sign (-) to expand or collapse a row. In order to create the accordion report, with the enhanced interface, the SET EXPANDBYROWTREE command must be set to ON. In order to automatically resize the data to fit the size of the container, the SET AUTOFIT command must be set to ON.
TABLE FILE GGSALES
SUM DOLLARS/D8MC
UNITS/D8C
BUDDOLLARS/D8MC BUDUNITS/D8C
BY REGION
BY ST
BY CATEGORY
BY PRODUCT
ON TABLE SET EXPANDBYROWTREE ON
ON TABLE SET DROPBLNKLINE ON
ON TABLE SET AUTOFIT ON
ON TABLE PCHOLD FORMAT HTML
ON TABLE SET STYLE *
INCLUDE=IBFS:/FILE/IBI_HTML_DIR/ibi_themes/Warm.sty,$
ENDSTYLE
END
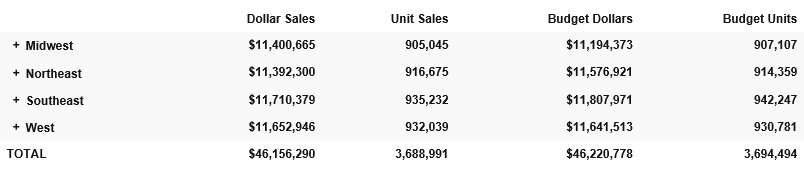
The initial output shows only the top level BY field (REGION), as shown in the following image.
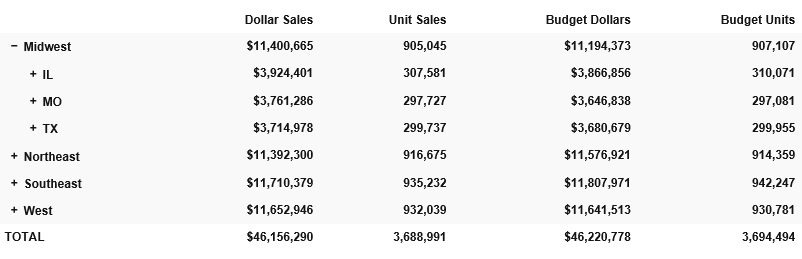
Clicking the plus sign (+) next to the Midwest region opens the rows that show the states associated with that region, as shown in the following image.
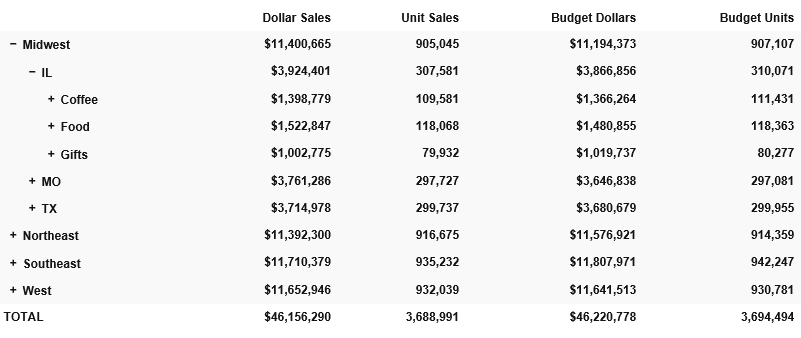
Clicking the plus sign (+) next to the state IL opens the rows that show the categories associated with that state, as shown in the following image.
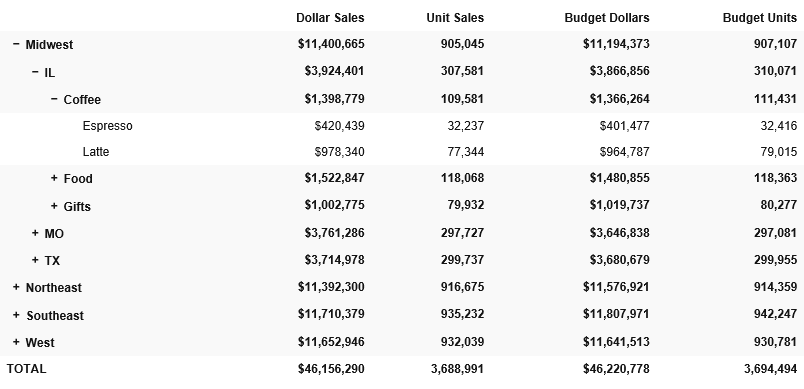
Clicking the plus sign (+) next to the Coffee category shows the products associated with that category, as shown in the following image. This is the lowest level of the Accordion By Row report.
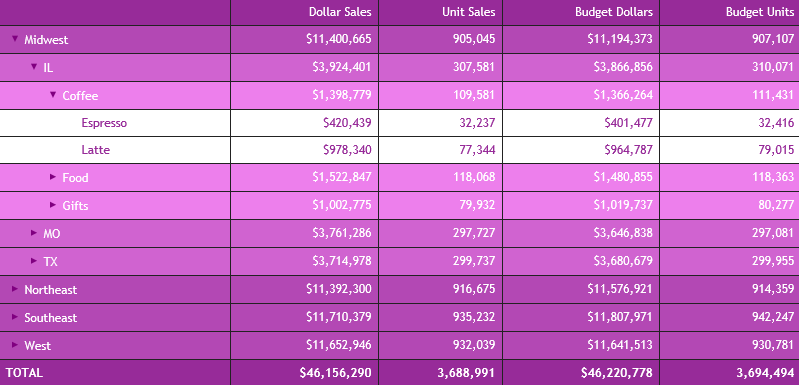
You can use the EBRT_ANCHOR stylesheet attribute to change the default plus sign (+) and minus sign (-) to an arrow. Valid settings for the EBRT_ANCHOR attribute are PLUSMINUS and ARROWS. The following request changes the default plus sign (+) and minus sign (-) to an arrow, and applies StyleSheet formatting to the request to change the color of the text to white and the background color to different shades of purple.
Note: The color of the arrows match the color of the SUBTOTAL line, in this case, white.
TABLE FILE GGSALES
SUM DOLLARS/D8MC
UNITS/D8C
BUDDOLLARS/D8MC BUDUNITS/D8C
BY REGION
BY ST
BY CATEGORY
BY PRODUCT
ON TABLE SET EXPANDBYROWTREE ON
ON TABLE SET DROPBLNKLINE ON
ON TABLE SET AUTOFIT ON
ON TABLE PCHOLD FORMAT HTML
ON TABLE SET STYLE *
TYPE=REPORT, EBRT_ANCHOR=ARROWS,
COLOR=RGB(66 70 73), FONT='TREBUCHET MS', SIZE=9, SQUEEZE=ON,$
TYPE=REPORT, FONT='TREBUCHET MS', COLOR=RGB(151 43 153),$
TYPE=TITLE, COLOR='WHITE', BACKCOLOR=RGB(151 43 153), STYLE=-UNDERLINE,$
TYPE=HEADING, COLOR='WHITE', BACKCOLOR=RGB(151 43 153),$
TYPE=FOOTING, COLOR='WHITE', BACKCOLOR=RGB(151 43 153),$
TYPE=SUBTOTAL, COLOR=WHITE, BACKCOLOR=RGB(179 72 180),$
TYPE=SUBTOTAL, BY=2, BACKCOLOR=RGB(208 99 208),$
TYPE=SUBTOTAL, BY=3, BACKCOLOR=RGB(237 127 236),$
TYPE=GRANDTOTAL, COLOR='WHITE', BACKCOLOR=RGB(151 43 153), STYLE=BOLD,$
ENDSTYLE
END
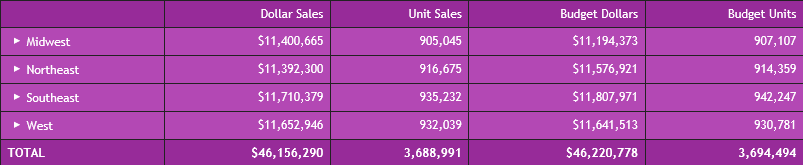
The initial output shows only the top level BY field (REGION), as shown in the following image.
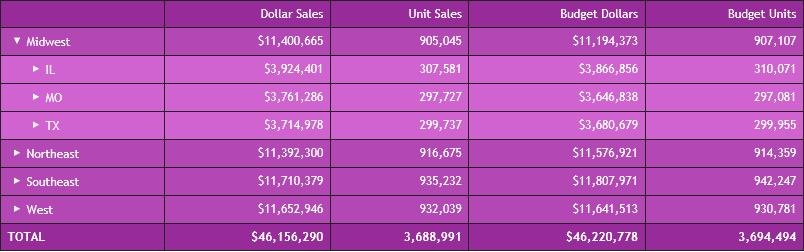
Clicking the arrow next to the Midwest region opens the rows that show the states associated with that region, as shown in the following image.
Clicking the right arrow next to the state IL opens the rows that show the categories associated with that state, as shown in the following image.
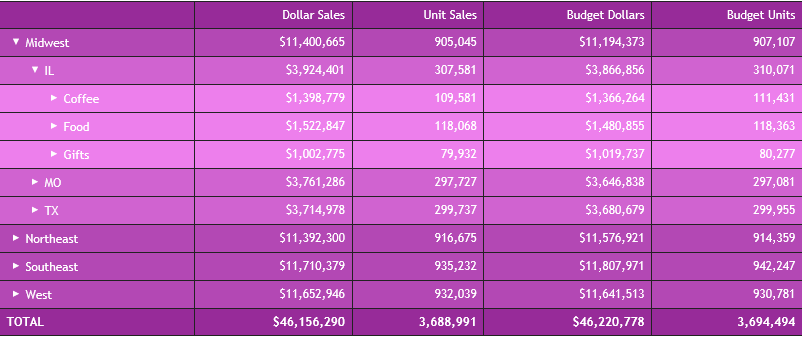
Clicking the right arrow next to the Coffee category shows the products associated with that category, as shown in the following image. This is the lowest level of the Accordion By Row report.
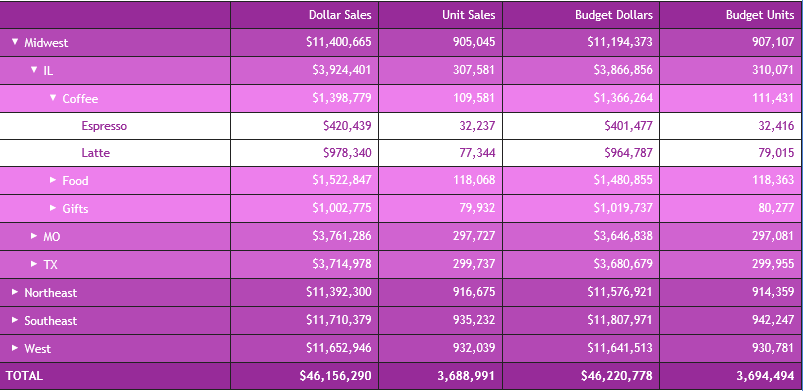
You can use the CONTROLCOLOR StyleSheet attribute on the SUBTOTAL line to specify the color of the arrows. The following syntax shows how to change the color of the arrows to purple.
TABLE FILE GGSALES
SUM DOLLARS/D8MC
UNITS/D8C
BUDDOLLARS/D8MC BUDUNITS/D8C
BY REGION
BY ST
BY CATEGORY
BY PRODUCT
ON TABLE SET EXPANDBYROWTREE ON
ON TABLE SET DROPBLNKLINE ON
ON TABLE SET AUTOFIT ON
ON TABLE PCHOLD FORMAT HTML
ON TABLE SET STYLE *
TYPE=REPORT, EBRT_ANCHOR=ARROWS,
COLOR=RGB(66 70 73), FONT='TREBUCHET MS', SIZE=9, SQUEEZE=ON,$
TYPE=REPORT, FONT='TREBUCHET MS', COLOR=RGB(151 43 153),$
TYPE=TITLE, COLOR='WHITE', BACKCOLOR=RGB(151 43 153), STYLE=-UNDERLINE,$
TYPE=HEADING, COLOR='WHITE', BACKCOLOR=RGB(151 43 153),$
TYPE=FOOTING, COLOR='WHITE', BACKCOLOR=RGB(151 43 153),$
TYPE=SUBTOTAL, COLOR=WHITE, BACKCOLOR=RGB(179 72 180), CONTROLCOLOR=PURPLE,$
TYPE=SUBTOTAL, BY=2, BACKCOLOR=RGB(208 99 208),$
TYPE=SUBTOTAL, BY=3, BACKCOLOR=RGB(237 127 236),$
TYPE=GRANDTOTAL, COLOR='WHITE', BACKCOLOR=RGB(151 43 153), STYLE=BOLD,$
ENDSTYLE
END
The following output shows the lowest level of the Accordion By Row report, with purple arrows.