Active Technologies
The following are known issues with charts in Active Technologies:
- When reformatting a field to show the % sign in an AHTML chart, the tooltip does not reflect the percent format at run time.
- If you are working with an AHTML chart that does not have the new chart properties (specifically, non-bucket AHTML charts),
you will encounter problems if you change the chart type to one of the following chart types using the Advanced Chart tool
at run time:
- Funnel
- Pyramid
- Waterfall
- Histogram
- Radar Line
- Radar Area
- 3D Area
By default, these chart types are hidden in the Advanced Chart tool when the original chart is an AHTML bucket chart. These chart types are available under the following circumstances:- When the original chart is a non-bucket chart
- When the chart is created from a tabular report
- When creating a chart in AHTML format, if you include a DEFINE field in the chart heading, at run time, the value of the DEFINE field is not resolved and does not display in the heading. As a workaround, you may also add the DEFINE field as a NOPRINT sort field in the chart.
- When working with AHTML pie charts, as you lasso over one or more pie slices in certain areas of the chart, extra slices get highlighted, resulting in the wrong number of points being selected when you release the mouse.
- If you create an AHTML Hexagon Bin scatter chart, which is a publicly available chart extension, filtering options are not available. You can lasso an area of the chart. However, the expected Filter Chart option does not filter the chart. In addition, the Exclude from Chart option does not exclude the designated values.
- If you convert a report to a scatter chart in AHTML format, the chart is displayed with square markers, as opposed to the expected circles.
- If you are creating an active chart that does not have the new chart attribute syntax applied, and you add a field to the Legend field container, an ACROSS field is generated. This is not supported in Active. As a result, you may encounter incorrect chart output at run time.
- When running an AHTML streamgraph chart with a Color BY field, if you hover over a section of the chart, no data value appears to the right of the field name in the tooltip.
- If you are working in AHTML format and you attempt to run an open-hi-lo-close candle stock chart, a bar chart displays instead of a stock chart. Stock charts are available on the Stock tab in the Other Chart Types dialog box in InfoAssist.
-
The Chart/Rollup Tool displays incorrect values in an active report or chart when active cache is enabled.
The following is a known issue with reports in Active Technologies:
- When working with an AHTML report that has HFREEZE enabled, if you select Window and then select Tabs from the column menu after having performed run-time analysis that resulted in open windows, the windows disappear from view. To bring the windows into view again, from the column menu, select Window, and then select Cascade.
The following support and known issues apply to Active Technologies for mobile web apps. These may include issues that occur
on mobile in a non-adaptive view.
- When running a compound active document with multiple charts on a mobile device, or on a desktop environment where the size of the browser window has been reduced so that the chart tooltip menu is larger than the chart container, the tooltip menu disappears behind an adjoining chart when hovering the mouse over the various charts in the document.
The following is a known issue that applies to Active Dashboard:
- If you are using large fonts in an AHTML report heading, the report title is positioned too close to the Report tab. Proper spacing should reflect a gap between the Report tab label and the report heading.
The following are known issues in Active Technologies:
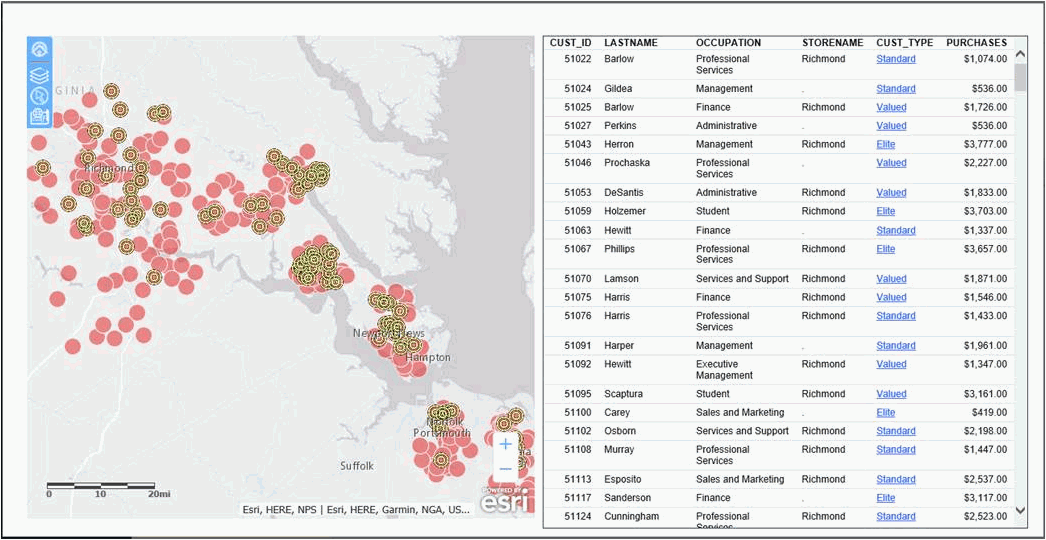
- When viewing an HTML page created by App Studio that runs a map and an AHTML report with a column value drill down that uses
a JavaScript function to highlight information on the map, and then selecting a drilldown value incurs error "the layer 'undefined'
could not be found in the map" .
For example, clicking on a value in the CUST_TYPE column in the AHTML report shown in the image below will display the error message when it is expected to highlight the locations of the respective valued customers in Richmond stores in the map, as noted by the yellow circles, as shown in the following image.

- If you are running an active document with chained (linked) filter prompt controls, you may not see the correct values in the lower level (children) filter prompt controls when selecting a value from the primary (parent) filter prompt control. To remedy this, you can add ARDATA_FILTERONLY=ON to the children filter components in the COMPOUND LAYOUT syntax.
| WebFOCUS | |
|
Feedback |