Support for Pictograms
|
How to: |
Using the chart type "pictogram", you can use images as markers on the chart. The chart consists of bars, for each series, that are comprised of either repeated images that are stacked to the height of the bar or a single image that is stretched or shrunk to represent the height of the bar. The image for each series is specified in the marker:shape property as either a URL reference or a standard marker shape.
Syntax: How to Use Pictograms as Chart Markers
*GRAPH_JS
"chartType": "pictogram",
"pictogramProperties": {
	   "fillMode": "string",
	   "backFill": "string",
	   "lockToGrid": boolean
},
"series":
[
  {
	  "series": number,
	  "color": "string",
	  "marker":
     {
		    "shape": "string",
		    "color": "string",
		    "border": {"width": number, "color": "string"}
	     }
   }
]
where:
- "pictogramProperties"
-
Defines the properties of the pictogram images.
- "fillMode": "string"
-
Controls how each bar is filled. Valid values are:
- "repeatClip", which repeatedly stacks the image to the height of the bar. This is the default value.
- "stretch", which stretches or shrinks the image to the height of the bar.
- "backFill": "string"
-
Defines a color specification string to use with a standard marker shape and the property "fillMode": "repeatClip". It repeats the marker shape all the way to the top of the axis space instead of to the height of the bar, but fills the markers above the height of the bar with this color. The default value is "undefined".
- "lockToGrid": boolean
-
If true, shrinks the chart so that exactly one pictogram glyph fits between each y-axis gridline. The default value is false.
- "series"
-
Defines the properties of the series that will be represented by the images.
- "series": number
-
Is the number of the series to be represented by the pictogram.
- "color": "string"
-
Is a color specification string for the series. To see the pictograms without the series bars, use the property "color": "transparent".
- "marker"
-
Defines the properties of the marker for the series.
- "shape": "string"
-
Can be either a URL reference to an image file, or a standard marker shape. A URL reference must be in the following format.
"url(url_to_image_file)"
Image types supported include .gif, .jpg, .png, and .svg.
- "color": "string"
-
Defines the color for the marker when it is a standard marker shape. This property is ignored for an image file.
- "border"
-
Defines the width in pixels and a color specification string for the marker border. Border properties are ignored when the marker shape is an image file.
Example: Using a Repeated Image File as a Pictogram
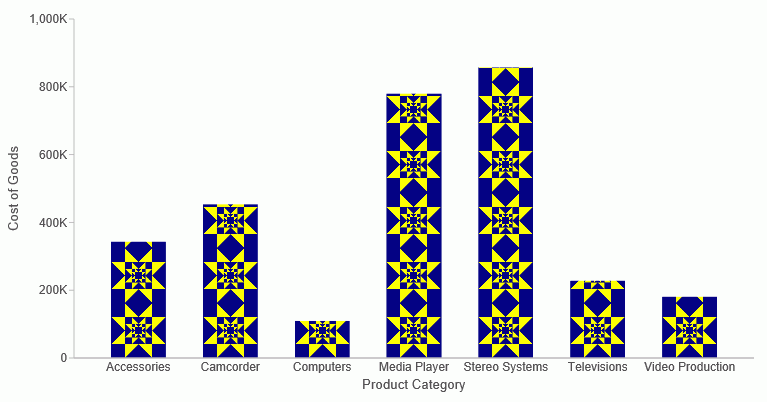
The following request uses a repeated quilt block image to generate the bars on the chart.
GRAPH FILE WF_RETAIL_LITE
SUM COGS_US
BY PRODUCT_CATEGORY
ON GRAPH PCHOLD FORMAT JSCHART
ON GRAPH SET LOOKGRAPH BAR
ON GRAPH SET STYLE *
type=data, column=N1, bucket=x-axis, $
type=data, column=n2, bucket=y-axis, $
INCLUDE=IBFS:/FILE/IBI_HTML_DIR/ibi_themes/Warm.sty,$
*GRAPH_JS
"chartType": "pictogram",
"pictogramProperties": {
	"fillMode": "repeatClip",
	"backFill": "undefined",
},
"series": [{
	"series": 0,
	"color": "transparent",
	"marker": {
	"shape": "url(http://ecl.informationbuilders.com/jschart/quilt.gif)",
		"color": "undefined",
		"border": {"width": 1, "color": "#DDDDDD"}
	}
}]
*END
ENDSTYLE
END
The output is shown in the following image.

Example: Using a Stretched Image File as a Pictogram
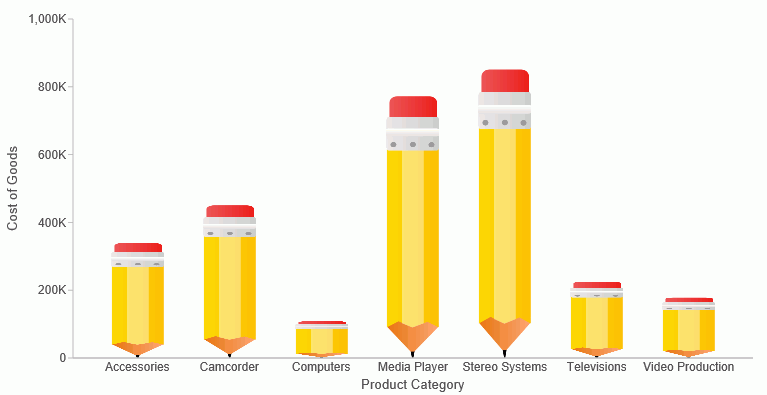
The following request uses a stretched image file to generate the bars on the chart.
GRAPH FILE WF_RETAIL_LITE
SUM COGS_US
BY PRODUCT_CATEGORY
ON GRAPH PCHOLD FORMAT JSCHART
ON GRAPH SET LOOKGRAPH BAR
ON GRAPH SET STYLE *
type=data, column=N1, bucket=x-axis, $
type=data, column=n2, bucket=y-axis, $
INCLUDE=IBFS:/FILE/IBI_HTML_DIR/ibi_themes/Warm.sty,$
*GRAPH_JS_FINAL
"chartType": "pictogram",
"pictogramProperties": {
	"fillMode": "stretch",
	"backFill": "undefined",
},
"series": [{
 "series": 0,
	"color": "transparent",
	"marker": {
	"shape": "url(http://ecl.informationbuilders.com/jschart/pencil.gif)",
		"color": "red",
		"border": {"width": 1, "color": "#DDDDDD"}
	}
}]
*END
ENDSTYLE
END
The output is shown in the following image.

Example: Using a Standard Marker Shape With Backfill as a Pictogram
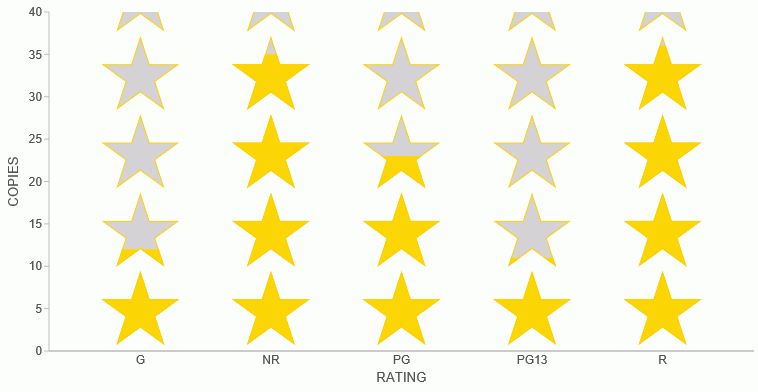
The following request uses the fivestar maker shape with light gray backfill to generate the chart.
GRAPH FILE MOVIES
SUM COPIES
BY RATING
ON GRAPH PCHOLD FORMAT JSCHART
ON GRAPH SET LOOKGRAPH BAR
ON GRAPH SET STYLE *
type=data, column=N1, bucket=x-axis, $
type=data, column=n2, bucket=y-axis, $
INCLUDE=IBFS:/FILE/IBI_HTML_DIR/ibi_themes/Warm.sty,$
*GRAPH_JS
"chartType": "pictogram",
"pictogramProperties": {
	"fillMode": "repeatClip",
	"backFill": "lightgray",
},
"series": [{
	"series": 0,
	"color": "transparent",
	"marker": {
		"shape": "fivestar",
		"color": "gold",
		"border": {"width": 1, "color": "#FECF01"}
	}
}]
*END
ENDSTYLE
END
The output is shown in the following image.

| WebFOCUS | |
|
Feedback |