The GraphType Property
|
Topics: |
Use the GraphType property to select and display a particular graph type.
Example:
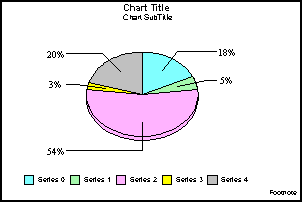
/* Set the graph type to Pie */
perspective1.setGraphType(55);
GraphType Values
The following graph types can be selected with the GraphType property.
|
GraphType Values |
Graph Category |
|---|---|
|
0...16 |
3D (three-dimensional) |
|
17...23 |
vertical bar |
|
24...30 |
horizontal bar |
|
31...35 |
vertical area |
|
36...40 |
horizontal area |
|
55...60 |
pie |
|
61...64 |
scatter |
|
65...66 |
polar |
|
67...69 |
radar |
|
70...84 & 88 |
stock |
|
85...82 |
histogram |
|
87 |
spectral map |
|
90...92 |
bubble graph |
|
93...94 |
pie-bar graph |
|
99 |
unreserved |
|
100...101 |
waterfall graph |
|
102 |
Pareto |
|
103...105 |
multi-Y axes graph |
|
106 |
funnel graph |
|
110 |
gauge graph |
|
111 |
pyramid graph |
|
124 |
boxplot |
|
130 |
hboxplot |
See Graph Types and 3D Preset Viewing Angles for a complete list of graph types and an illustration of each graph.
GraphType Methods
You can use these methods to determine the graph type that is currently selected:
- isChart3DType(); Returns true or false indicating whether or not the GraphType property is currently set to a value in the range: 0...7, 9, 10, or 12...14 (a 3D graph).
- isChartBiPolar(); Returns true or false indicating whether or not the GraphType property is currently set to a bi-polar graph type. For example, GraphType 21 (vertical bi-polar clustered bars), 22 (vertical bi-polar stacked bars), and so on.
- isChartBLAType(); Returns true or false indicating whether or not the GraphType property is currently set to a bar, line, or area (BLA) graph type (GraphTypes 17...54).
- isChartDualY(); Returns true or false indicating whether or not the GraphType property is currently set to a dual Y-axes graph type. For example, GraphType 19 (vertical dual-axis clustered bars), 20 (vertical dual-axis stacked bars), and so on.
- isChartOrientHorz(); Returns true or false indicating whether or not the GraphType property is currently set to a horizontally-oriented graph type. For example, GraphType 24 (horizontal clustered bars), 25 (horizontal stacked bars), and so on.
- isChartPieType(); Returns true or false indicating whether or not the GraphType property is currently set to a pie graph type (GraphTypes 55...60).
- isChartScatter(); Returns true or false indicating whether or not the GraphType property is currently set to a scatter graph type (GraphTypes 61...64).
- isChartStockType(); Returns true or false indicating whether or not the GraphType property is currently set to a stock graph type (GraphTypes 70...84 or 88).
| WebFOCUS | |
|
Feedback |