Creating a WebFOCUS Infographic Template
|
How to: |
You can begin creating your infographic template, once you have registered your WebFOCUS Infographics account. This allows you to access to WebFOCUS Infographics powered by Easelly, which provides a library of infographic templates, and a design tool that contains a WebFOCUS tag option and placeholder objects that can be linked to WebFOCUS charts once you upload your template into WebFOCUS.
You can access the Creation Tool in one of the following ways:
- From the WebFOCUS Home Page, click the User menu, point to Tools, and then click WebFOCUS Infographics.
- In a web browser, such as Google Chrome™, type the following address: https://webfocus.easel.ly.
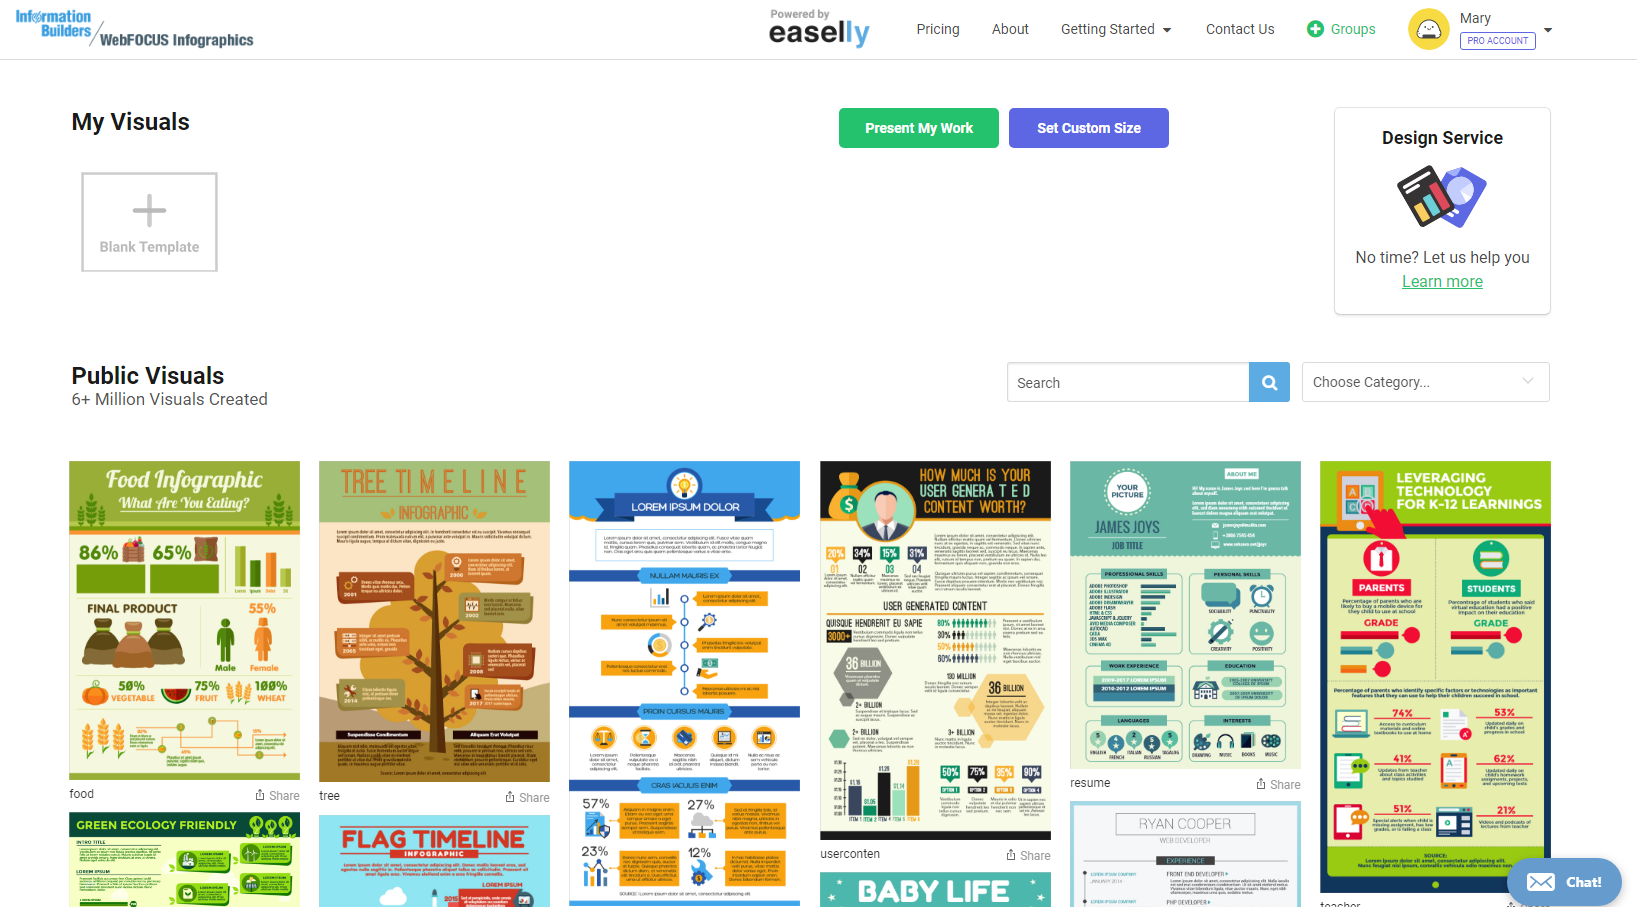
When you sign in with your account, you can immediately begin using the extensive resource library of templates and user-created public visuals, as shown in the following image.
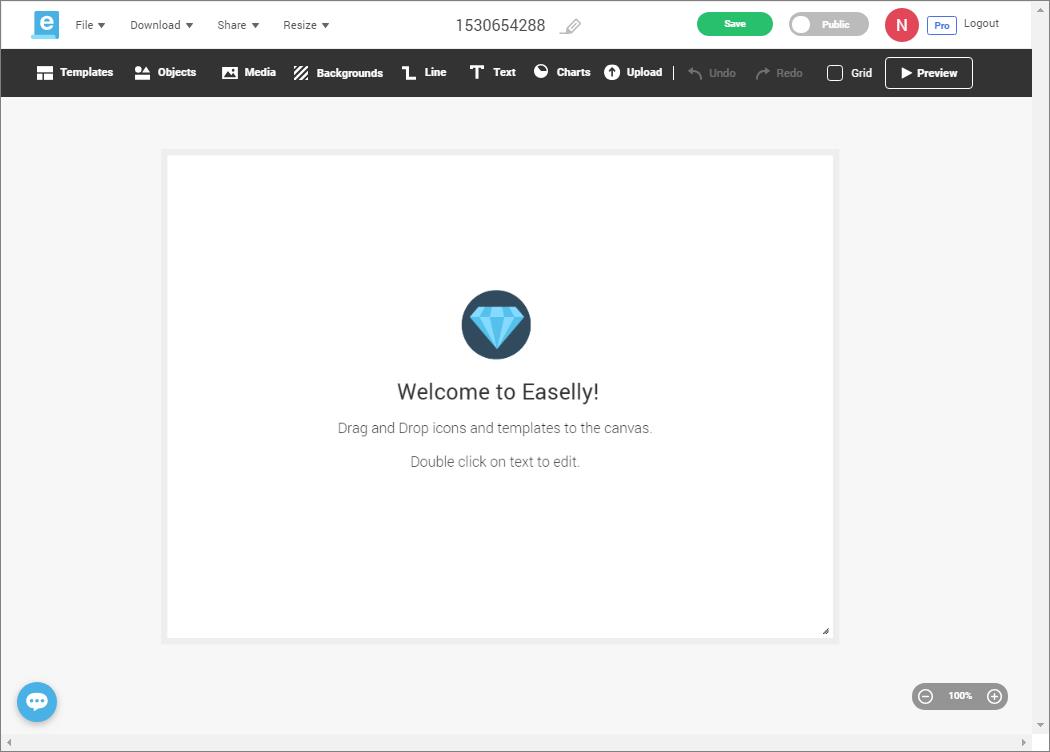
You can choose any template and adapt it to fit your purpose. You can also select a blank canvas, and build your template from scratch. Once you select a template, the Creation Tool opens. The following image shows an example of the WebFOCUS Infographics Creation Tool view with the blank template.
You can begin to customize your infographic template using the options that are available to you on the ribbon, which is shown in the following image.

From the ribbon, you can:
- Change the default template.
- Add objects, icons, images.
- Add media, such as stock photos and videos.
- Customize the background.
- Draw lines and arrows.
- Add text components.
- Add charts.
Note: The chart options include a WebFOCUS chart placeholder that you can fill with a WebFOCUS chart in InfoAssist.
- Upload images and icons.
Note: The supported formats are .gif and .png.
- Undo and restore your latest actions.
- Display a grid for ease of formatting.
- Preview your finished result.
You can use the File, Download, Share, and Resize menus, which are shown in the following image, to save your template to your own local directory, download it in various formats, resize it, share it, invite other users to collaborate with your design, view your template in the browser, export your template to WebFOCUS, and modify the size of your template.

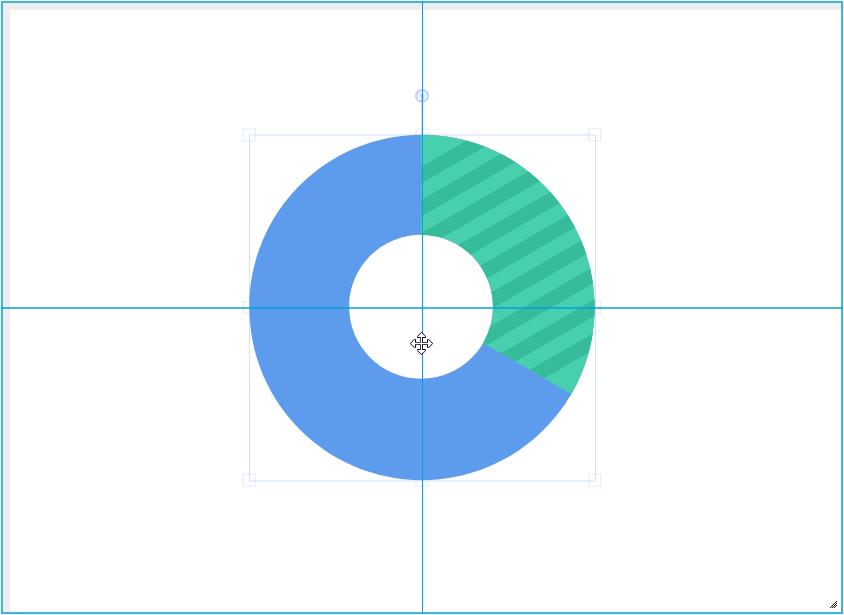
The canvas is interactive. As you drag an object from the ribbon, the canvas automatically displays placement lines that you can use to position the object, as shown in the following image.
When you click an object on the canvas, the ribbon expands and shows additional options that you can use to modify the object. For example, if you click a text box, the following options become available.

The options available to you change, depending on the type of object you select. For example, these options may include:
- Lock. Locks the object and prevents you from accidently moving or deleting it. This option is especially useful when creating backgrounds and watermarks.
- Opacity. Controls transparency of the object.
- Hyperlink. Adds a link to an object, making it a click-through action for the recipient.
Note: This option is not yet available for use with WebFOCUS data.
- Text size and font. Modifies the font type and size of the text.
- Color. Applies a custom color to an object.
Note: The color option is only available for single-tone icons and images and text objects.
- Text formatting and alignment options. Customizes formatting and alignment of the text.
- Position. Controls how the object is layered in relation to other objects.
- Copy. Copies the object.
- Delete. Deletes the object.
- WebFOCUS Tag. Marks an object for data replacement in InfoAssist.
Procedure: How to Create a WebFOCUS Infographics Template
- Sign in to WebFOCUS.
- On the User menu, point to Tools, and click WebFOCUS Infographics.
- In the browser window, sign in to WebFOCUS Infographics powered by Easelly.
Note: If you have not registered your WebFOCUS Infographics account, click Register here.
- Select a template that you want to adapt to your infographic.
Alternatively, select Blank Template, if you want to build your own infographic template.
The template opens in a new window with features that you can use to edit it.
- Edit your template to fit your requirements.
Using the ribbon options, you can manipulate a template in the following ways:
- Add objects and media.
- Resize shapes, images, and text.
- Delete objects and sections.
- Change colors.
- Edit entries.
- As you develop your infographic, decide which objects you want to replace with data in WebFOCUS. Click these objects, and
then click WebFOCUS Tag, as shown in the following image.
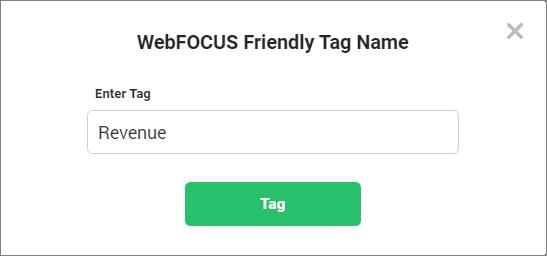
The WebFOCUS Friendly Tag Name dialog box opens. Here, you can assign a name to the object. These names appear in the InfoAssist Query pane as components, such as charts or reports in the compound document. The more descriptive the tags, the easier it is to identify components, and connect your data to those components in InfoAssist.
Note: You can add WebFOCUS tags to text, images, icons, or charts.
- Type a name for the tag in the Enter Tag field and click Tag, as shown in the following image.
In our example, we define points of revenue for each consecutive year to ensure that the tag can be easily identified when we upload the template into InfoAssist. The tag, in this case, Revenue, is used as the name of the component in Document mode in InfoAssist.
A star appears next to the object that you tagged, indicating that the tag has been applied, as shown in the following image.

- Tag any other text components that you want to fill with WebFOCUS data.
- Add placeholders for WebFOCUS charts. On the ribbon, click Charts, and then drag the WebFOCUS chart icon onto the canvas. Use the placement lines to position your chart.
- Optionally, add images from the library or upload your own images. You can upload images from your machine, or select from
a large array of images available as part of the WebFOCUS Infographics toolset. To upload images, on the ribbon, click Upload, and then click Choose Files. Select the files on your machine, and close the window. These uploaded images are now available under the My images category
of Objects. To add images from the library, click Objects and use the drop-down list to navigate through the available images and shapes.
In our example, we added four alternating map images as watermarks for each region title. In the template, however, we only needed one image as a placeholder. When you connect this object to data in InfoAssist, you can create a simple DEFINE expression to automate the changing images at run time. To add a watermark image to your template:
- On the ribbon, click Upload.
- Browse to a file from your machine or drag it to the Upload Files window.
- Once you have selected the desired files, close the Upload Files window.
- Click Objects, select My images from the drop-down list, and drag your image to the canvas. This image will serve as a placeholder for all alternating images
that we will use in the infographic procedure.
Note: You do not need to upload all your alternating images, but make sure they are approximately the same size.
- Select the image on the canvas and change the opacity to be 40-50%.
- Click Text and drag a Header object to the canvas.
- Edit the text so it displays on top of the watermark image, by clicking the up Position arrow
 on the ribbon.
 - Add WebFOCUS tags to both the image and the header.
- Add any extra elements that you want to include in your template, such as text objects, dividing lines, or icons.
The following image shows an example of a completed template.

- Save your infographic with a meaningful name, in one of the following ways:
- Edit the name in the control at the top of your browser window, shown in the following image.
Click outside the text box to save the edit.
- From the menu bar, click File, and then click Save As.
Type a name for your template in the Enter a name field, and click Save.
When you return to the Creation Tool, the new name of your infographic template appears.
- Edit the name in the control at the top of your browser window, shown in the following image.
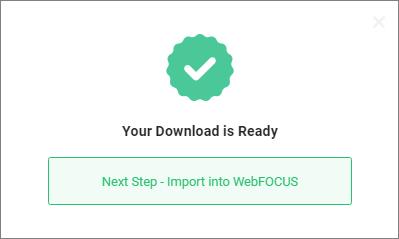
- In the header menu, click Download, and then click Export to WebFOCUS.
The pop-up message appears, informing you that the download is ready to import into WebFOCUS, as shown in the following image.
Note: When you download the infographic template for use in WebFOCUS, a copy of the template saves to the Downloads folder on your machine, following the standard of each individual browser. If you download the file more than once, it does not overwrite the previously downloaded version, and appends it with a number that increases each time you download it. For example, if you name your template Infographic, it saves as Infographic.ely. If you download the same template a second time, it saves as Infographic (1).ely. You can continue to enhance your template and infographic procedure by overwriting the old template with your updated download. As long as the template name remains the same, the linked infographic procedure will continue to reference it. To ensure this link stays in place, delete the previous .ely file from the Downloads folder before you issue a new download, or rename the template before uploading it.
| WebFOCUS | |
|
Feedback |