Replacing Data in a WebFOCUS Infographic
|
How to: |
You can modify your infographic at any time to reflect new data that is available to you. For example, you may create an infographic that sends information monthly or quarterly. Once you set up the initial infographic template, and Reporting Object, you can easily distribute an updated infographic.
In our example, we created an infographic for the first quarter of a year. You can reuse the same template and Reporting Object for subsequent quarters without making any extensive changes. All you need to do is modify the Reporting Object so it uses data for a new quarter.
Procedure: How to Replace Data in a WebFOCUS Infographic
- On the Home Page, right-click the Reporting Object you used to create your initial infographic, and click Edit.
The Reporting Object interface opens.
- Expand the Where Statements node and double-click an existing Where statement.
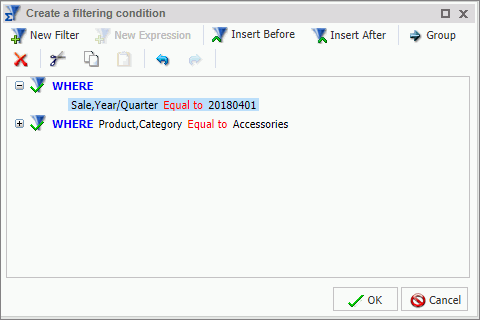
- Modify the Where statement so that it uses your new data values. For example, if you were creating an Infographic to reflect
revenue for the second quarter, you would change the value to April of that year, as shown in the following image.

- Click OK.
- Save your Reporting Object with the same name, and return to the WebFOCUS Home Page.
Note: If you rename your Reporting Object, the infographic will not run. If needed, create a backup of the Reporting Object before you edit it.
- If your infographic contained any static text, headings, or images related to the data for a specific quarter, you must edit
the Infographic in InfoAssist, and update those components accordingly.
Once you have edited your Infographic, you are ready to share it with others.
| WebFOCUS | |
|
Feedback |