Creating Reports
|
Topics: |
|
How to: |
You can use the following procedures to create a basic report in the WebFOCUS Home Page and InfoAssist.
Procedure: How to Create a Report
After you have signed in to , you can work with an existing folder, or create a new folder in the WebFOCUS Home Page to store your reports.
- Open InfoAssist in Report mode.
- Drag fields
onto the canvas or into the Query pane to begin building your report.
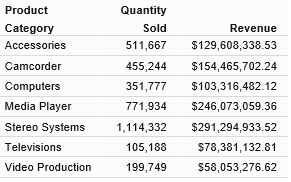
A basic report is shown in the following image.
Procedure: How to Create a Report From the Application Main Menu
- In the upper-left corner of the InfoAssist interface, click the IA button to open the Application Main Menu.
- From the
Application Main Menu, click New.
The InfoAssist splash screen opens.
- On the InfoAssist
splash screen, select Build a Report.
The Open dialog box opens.
- From the
Open dialog box, select the data source that you want to use, and
click Open.
The data source that you selected appears in the Data pane of the Resources panel.
- Drag fields onto the canvas or into the Query pane to begin building your report.
Procedure: How to Create a Report From the Quick Access Toolbar
- On the Quick
Access Toolbar, click the New icon.
The InfoAssist splash screen opens.
- On the InfoAssist
splash screen, select Build a Report.
The Open dialog box opens.
- From the
Open dialog box, select the data source that you want to use, and
click Open.
The data source that you selected appears in the Data pane of the Resources panel.
- Drag fields onto the canvas or into the Query pane to begin building your report.
Procedure: How to Create a Report From an Existing Chart
- Open the chart that contains the data that you want to present in a report.
- On the Home tab,
in the Format group, click Report.
The data is presented as a report.
Choosing a Report Output
The following output types are available for reports:
- HTML
- active report
- active PDF
- Excel
- PowerPoint
- Visual Discovery AE (only available with a Visual Discovery Analyst Edition license)
Note: When you create a report in Document mode, you have access to Excel only.
When you create a report in Live Preview or Query Design view, you have access to the following Excel output types:
- Excel (xlsx). Outputs the report in Excel 2007 (and higher) format.
- Excel. Outputs the report in Excel format.
- Excel Formula (xlsx). Outputs the report, using Excel formulas that calculate and display the results of any type of summed information, such as column totals, row totals, and subtotals. This format is for Excel 2007 (and higher).
- Excel Formula. Outputs the report, using native Excel formulas for totals and computed values.
- Excel (csv). Outputs the report to .csv format. This enables you to capture your data and work with it in an external program, such as Microsoft Excel.
Note: Additional output types can be enabled in the Administration Console, including Excel Pivot.
Downloading InfoAssist Report Data to Excel (CSV) Format
|
How to: |
When working with data in a report, you can download it into Excel (CSV) format. This enables you to capture your data and work with it in an external program, such as Excel.
When you use the File option to create a HOLD file from your report the output file is placed on the WebFOCUS reporting server. For users who do not have access to their reporting server this approach allows the data to be delivered directly to their desktops.
Note: You can select the Excel (CSV) output format in User Preferences, if you want to make this output format the default for each time you enter InfoAssist.
Procedure: How to Download InfoAssist Report Data to Excel (CSV) Format
- Open InfoAssist in Report mode.
- Create a report.
- On the ribbon, in the Output File Format list, click the right arrow next to Excel (xlsx) and then select Excel (csv), as shown in the following image.
- On the Quick Access toolbar, click Run to run the report.The CSV will be presented for download using the standard interface of your specific browser interface.
Using Procedure Settings
|
How to: |
Procedure Settings, also known as SET commands, enable you to specify and control items for inclusion in a procedure. If you want to include a Procedure Setting in a procedure (.fex), select the relevant check box to include that setting in the procedure (.fex). Procedure Settings are available in Report, Chart, and Document mode.
You can access Procedure Settings from the Quick Access toolbar. When you click Procedure Settings, the Procedure Settings dialog box displays, allowing you to select the options to apply to your procedure, as shown in the following image.

Options include:
- Collation Sequence (COLLATION). Establishes a binary or case-insensitive collation sequence. Options include Code Page (default), Binary, Case-Sensitive, and Case-Insensitive. This value will not be written into the procedure (.fex), by default. Therefore, you must select the check box to prompt this action.
- Summary Lines (SUMMARY LINES). Allows you to combine fields with and without prefix operators on summary lines in one request. Options include New (default value), Old, and Explicit. This value will not be written into the procedure (.fex), by default. Therefore, you must select the check box to prompt this action.
- Missing Value (NODATA). Specifies the missing data characters to be
printed in a report. This is a text box with a default value of
period ( . ). Common entries include N/A or NONE. In addition, this
field has a limit of six characters. This value will not be written
into the procedure (.fex), by default. Therefore, you must select
the check box to prompt this action.
Note: You can use amper (&) variables in the Missing Data field to allow the entry of values at run-time. In general, valid values include any string or amper (&) variable, which will print automatically. You can use &xx to activate autoprompt. For example, you can use &NONE to specify a value at run-time. In Live Preview, this value is set to _FOC_NULL or as many characters that will fit in the width as defined by the existing values in a column. Global variables (&&x) should not be entered as they do not activate autoprompt. Mixing strings with amper (&) variable can result in Focus error messages. For example, &&&&N& or &nn&n&).
- Decimal Notation (CDN). Ensures the correct display of currency for the target language. Radio buttons include On and Off (default value).
- HTML Encode (HTMLENCODE). Controls whether HTML tags are encoded when these tags are stored within the actual data or when they are created using a DEFINE or COMPUTE command. Radio buttons include On (default value) and Off. This option is selected for inclusion in the procedure (.fex), by default (the check box is selected), as it is not a default setting of the Reporting Server.
- Empty Report (EMPTY REPORT). Controls the output generated when a TABLE request retrieves zero records. Radio buttons include On (default value) and Off. When set to On, an empty report (column headings with no content) is generated. When set to Off, no report is generated. This option is selected for inclusion in the procedure (.fex), by default (the check box is selected), as it is not a default setting of the Reporting Server.
Note: In Report mode, all settings apply. In Chart mode, only Collation Sequence (COLLATION), Decimal Notation (CDN), and Empty Report (EMPTYREPORT) settings are applicable. In Document mode, Procedure Settings apply to the whole document. These settings are currently unavailable in Visualization mode.
Procedure: How to Create a Procedure Using the Missing Value Option
- Create a report with a dimension, a measure, and an across sort field that shows missing values, as shown in the following
image.
Note: The highlighted area indicates the default ( . ) for missing values.
- On the Quick Access toolbar, click Procedure Settings.
- Click the Missing Value check box.
- In the Missing Value text box, enter the characters to be used to represent missing values in your report. For example, NONE.
Note: By default, this is set to ( . ). However, common examples include N/A or NONE.
- Click OK.Fields with missing values are indicated by the word NONE, in this case, as that is what was specified. This value is shown in the following image.
- Save the procedure.
Procedure: How to Create a Procedure Using the Empty Report Option
- Create a report with one or more measures and two dimensions.
- Add a filter to create an empty report by filtering on a value that does not exist in the dimension that you select.
Note: The addition of a filter condition causes your report to have no records, and the default behavior (EMPTYREPORT=ON) displays the heading and column titles.
The following image shows an empty report.
- On the Quick Access toolbar, click Procedure Settings.
- Clear the Empty Report check box.
Note: This option is selected, by default. Notice that Empty Report can be set to On or Off. When enabled and set to On, the shell of the report (headings and titles) will be displayed. If the setting is turned off, the environment default will be used.
- Click OK.
When the Empty Report check box is cleared, no report is generated, as shown in the following image.

- Save the procedure.
Creating Thumbnails for Use With the WebFOCUS Home Page
|
How to: |
In InfoAssist, you can create and store thumbnail images for use in the WebFOCUS Home Page. Thumbnail images allow you to see a snapshot of a report or chart without opening the file. In InfoAssist, you can create a thumbnail image by clicking on the Create Thumbnail icon, which is located on the Quick Access toolbar.
You can create thumbnail images when working in Report and Chart mode in InfoAssist. These images are smaller renditions (220x160px) of your actual report or chart as it displays in Live Preview. Once you create the thumbnail and save the report or chart, you can access the thumbnail image from the file list on the WebFOCUS Home Page, as shown in the following image.

Note: Thumbnail images are stored as part of the procedure when it is saved in the repository.
Procedure: How to Create a Thumbnail Image of a Report or Chart
- Open InfoAssist in Report or Chart mode.
- Create a report or chart.
- On the Quick Access Toolbar, click Create Thumbnail, as shown outlined in blue in the following image.

The Create Thumbnail dialog box displays, as shown in the following image.
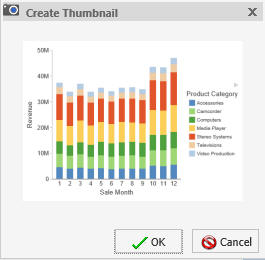
- On the Create Thumbnail dialog box, click OK.
- On the Message dialog box, a message displays stating that the Thumbnail has been created. Click OK.
- On the Quick Access Toolbar, click Save to save the chart or report along with the thumbnail. The thumbnail is stored with the procedure.
Procedure: How to View the Properties of a Thumbnail from the WebFOCUS Home Page
- Create a report or chart that contains a thumbnail.
- Save the procedure.
- In the Items list on the WebFOCUS Home Page, locate the procedure.The image that displays is the thumbnail that was saved with the procedure.
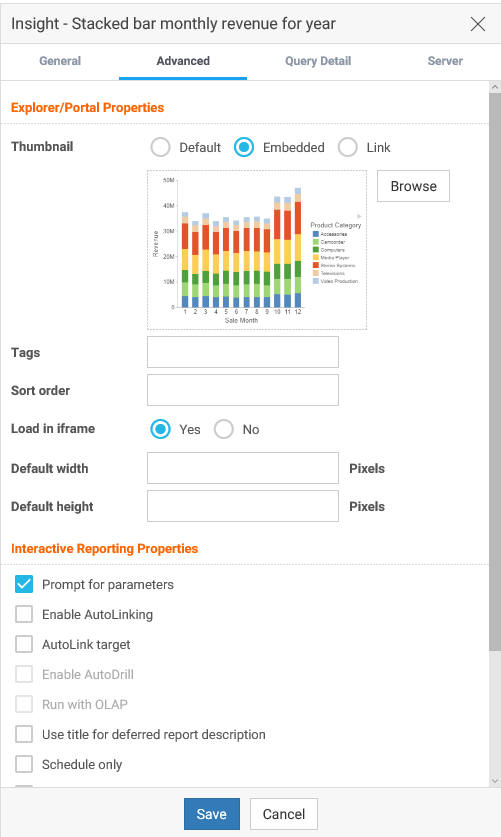
- Right-click the procedure and select Properties to view additional thumbnail options.
- Click the Advanced tab.The thumbnail displays in the Explorer/Portal Properties section of the panel, as shown in the following image.
| WebFOCUS | |
|
Feedback |