Standard Gesture Support
Active Technologies support the following standard interactive gestures that are used on a multi-touch screen.
|
Gesture |
Description |
|---|---|
|
Tap |
To press or select a control or item (analogous to a single mouse click). |
|
Drag |
To move columns left and right or up and down slowly when an active report is in a grid in full-screen web app view. |
|
Flick |
To move columns left and right or up and down quickly when an active report is in a grid in full-screen web app view. |
|
Swipe |
To page forward or backward in a pagination bar when an active report is in a grid in full-screen web app view. |
|
Double tap |
To zoom in and center a block of content or an image. If you are already zoomed in, a double tap zooms out. You can also double tap the screen to hide both the top and bottom toolbars, as well as the pagination bar. Double tap the screen again to show both toolbars and the pagination bar. |
The following table lists and describes gestures specific to mobile charts.
|
Gesture |
Description |
|---|---|
|
Tap |
The tap gesture is used to select or highlight an item, such as a riser, and show its tooltip (analogous to pausing the mouse over an object). |
|
Long touch |
Touching and holding an item, such as a riser, is used to trigger a drop-down menu on events that support it (analogous to a single mouse click). |
|
Short drag |
Can be used interchangeably with long drag for either scrolling (on charts with scroll bars or moving around on maps) or for marquee data selection. On charts that include both scrolling and marquee selections, a short drag will scroll and a long drag will do a marquee data selection. |
|
Long drag |
Can be used interchangeably with short drag for either scrolling (on charts with scroll bars or moving around on maps) or for marquee data selections. Note that if a chart supports only scrolling or only marquee selections, then a long drag does nothing. On charts that include both scrolling and marquee selections, a short drag will scroll and a long drag will do a marquee data selection. |
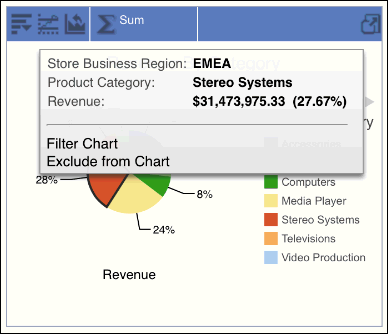
The following image shows a tooltip that appears when you tap on a riser (for example, the pie slice with the largest data value).
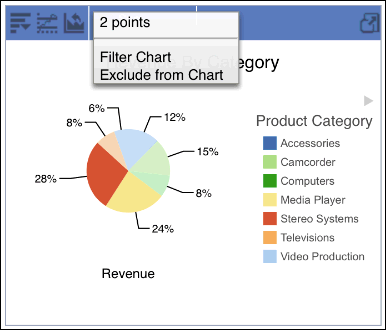
The following image shows the options available for a marquee data selection, also known as lassoing (for example, when a long drag is performed over the two pie slices with the largest data values).
| WebFOCUS | |
|
Feedback |