Statistics Adapters
|
|
Topics: |
This section contains descriptions of features for statistics adapters.
Adapter for Rserve Integration
|
Reference: |
The Adapter for Rserve enables you to define a connection to Rserve for remotely executing R scripts to be used with WebFOCUS reports and charts as a summary (Compute) or virtual field.
Rserve is a TCP/IP server that allows users to run R scripts directly from WebFOCUS or the Reporting Server without the need to initialize R or link to an R library. The original Rserve paper is available at http://www.ci.tuwien.ac.at/Conferences/DSC-2003/Proceedings/Urbanek.pdf.
For more information on Rserve, see https://rforge.net/Rserve/index.html.
Reference: Configuring the Adapter for Rserve
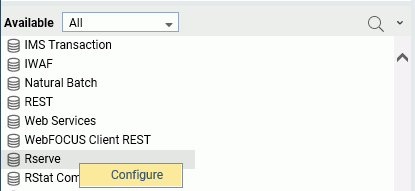
On the Connect to Data page of the Reporting Server Web Console, right-click Rserve on the Available list, and click Configure, as shown in the following image.

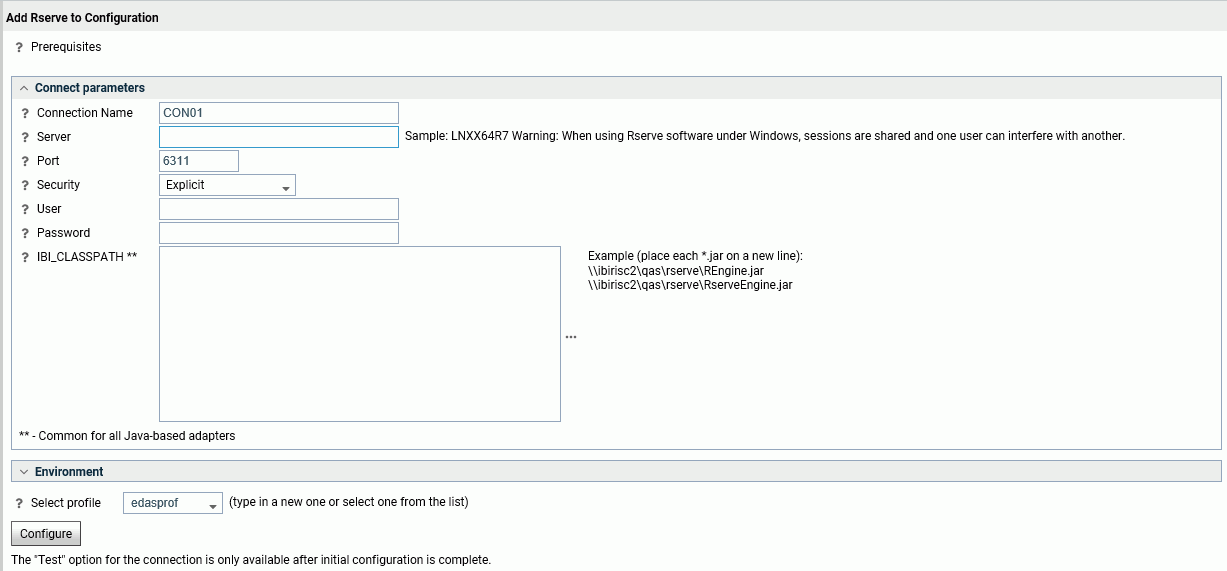
The Add Rserve to Configuration page opens, as shown in the following image.

Enter the following connection parameters.
- Connection Name
-
Is a name for this connection.
- Server
-
Is the hostname of the Rserve host.
Rserve does not have to be installed on the Reporting Server host machine. However, it must be accessible to the Reporting Server.
- Port
-
Is the port on which the Rserve host listens.
- Security
-
There are three methods by which a user can be authenticated when connecting to Rserve:
- Explicit. The user ID and password are explicitly specified for each connection and passed to Rserve, at connection time, for authentication.
If you select Explicit authentication, enter the Rserve user ID and password.
- Password Passthru. The user ID and password received from the client application are passed to Rserve, at connection time, for authentication.
- Trusted. The adapter connects to Rserve using the rules for an impersonated process that are relevant to the current operating system.
- Explicit. The user ID and password are explicitly specified for each connection and passed to Rserve, at connection time, for authentication.
- IBI_CLASSPATH
-
Are additional Java Class directories or full path jar names to be available for Java Services, each on a separate line.
The files REngine.jar and RServeEngine.jar are required. They are available on the Rserve web site, https://www.rforge.net/Rserve/files/. You must add the path to the location of these jar files to IBI_CLASSPATH.
Click Configure.
If the configuration is successful, the following message displays.
Rserve successfully added to configuration
In addition, you can click Test on the context menu for the connection.
Reference: Creating a Synonym for an R Script
Each R script used with the Adapter for Rserve must have a synonym that describes the script's independent variables and dependent variable. The Master File will contain the list of input (independent) variables and the output (dependent) variable. The Access File will contain information about the script and data files.
The synonym will be created using a sample file that contains only the fields that are input parameters for the script. A few rows of sample data are sufficient for the Adapter for Rserve to determine the appropriate data types and lengths of the parameters. The sample file must be a .csv file.
To create a synonym for an R script, right-click a connection for the Adapter for Rserve and click Create metadata objects. The Create Synonym for Rserve page opens, as shown in the following image, where the connection name is MyRserve.

Select or enter values for the following parameters.
- R Script location on R server
-
Is the remote location, including script name and extension, for the R script file (.R). Leave blank if the R script is in an application folder accessible to the Reporting Server.
- Select file with sample input data for the R Script
-
Open the file picker (...) to select the application directory and file that contains the sample data for creating the synonym. Click OK.
- Application
-
Open the file picker (...) to select the application that contains the R script. Select the R script file from the file picker and click OK.
- Synonym Name
-
Enter a name for the resulting synonym, or accept the default name.
When you have finished entering the synonym creation parameters, click Create Synonym on the ribbon, as shown in the following image.

Example: Creating a Synonym for an R Script
The following R script named wine_run_model.R predicts Bordeaux wine prices based on the average growing season temperature, the amount of rain during the harvest season, the amount of rain during the winter, and the age of the wine.
# filename: wine_run_model.r

args <- commandArgs(trailingOnly=TRUE)
input_file <- file.path(args[1])
output_file <- file.path(args[2])

wine_test <- read.csv(input_file)

wine_model <- readRDS('/prediction/wine_model.rds')

results <- predict(wine_model, newdata = wine_test)

results <- as.data.frame(results)
colnames(results) <- c('Price')
write.csv(results, file=output_file, row.names=FALSE)
The following sample data file named wine_input_sample.csv contains the names and sample values for the independent variables used in this model.
"AGST","HarvestRain","WinterRain","Age"
16.1667,122,717,4
16,74,578,3
The synonym creation page for this script is shown in the following image.

Clicking Create Synonym on the ribbon generates the wine_run_model synonym. The Master File, wine_run_model.mas, describes the independent (input) variables and the dependent (output) variable, as shown below:
FILENAME=WINE_RUN_MODEL, SUFFIX=RSERVE  , $
  SEGMENT=INPUT_DATA, SEGTYPE=S0, $
    FIELDNAME=AGST, ALIAS=AGST, USAGE=D9.4, ACTUAL=STRING,
      MISSING=ON,
      TITLE='AGST', $
    FIELDNAME=HARVESTRAIN, ALIAS=HarvestRain, USAGE=I11, ACTUAL=STRING,
      MISSING=ON,
      TITLE='HarvestRain', $
    FIELDNAME=WINTERRAIN, ALIAS=WinterRain, USAGE=I11, ACTUAL=STRING,
      MISSING=ON,
      TITLE='WinterRain', $
    FIELDNAME=AGE, ALIAS=Age, USAGE=I11, ACTUAL=STRING,
      MISSING=ON,
      TITLE='Age', $
  SEGMENT=OUTPUT_DATA, SEGTYPE=U, PARENT=INPUT_DATA, $
    FIELDNAME=PRICE, ALIAS=Price, USAGE=D18.14, ACTUAL=STRING,
      MISSING=ON,
      TITLE='Price', $
The Access File, wine_run_model.acx, describes the names and locations of the R script and the sample data file, as shown below.
SEGNAME=INPUT_DATA,
  CONNECTION=MyRserve,
  R_SCRIPT=/prediction/wine_run_model.r,
  R_SCRIPT_LOCATION=WFRS,
  R_INPUT_SAMPLE_DAT=prediction/wine_input_sample.csv, $
Now that the synonym has been created for the model, the model will be used to run against the following data file named wine_forecast.csv.
Year,Price,WinterRain,AGST,HarvestRain,Age,FrancePop
1952,7.495,600,17.1167,160,31,43183.569
1953,8.0393,690,16.7333,80,30,43495.03
1955,7.6858,502,17.15,130,28,44217.857
1957,6.9845,420,16.1333,110,26,45152.252
1958,6.7772,582,16.4167,187,25,45653.805
1959,8.0757,485,17.4833,187,24,46128.638
1960,6.5188,763,16.4167,290,23,46583.995
1961,8.4937,830,17.3333,38,22,47128.005
1962,7.388,697,16.3,52,21,48088.673
1963,6.7127,608,15.7167,155,20,48798.99
1964,7.3094,402,17.2667,96,19,49356.943
1965,6.2518,602,15.3667,267,18,49801.821
1966,7.7443,819,16.5333,86,17,50254.966
1967,6.8398,714,16.2333,118,16,50650.406
1968,6.2435,610,16.2,292,15,51034.413
1969,6.3459,575,16.55,244,14,51470.276
1970,7.5883,622,16.6667,89,13,51918.389
1971,7.1934,551,16.7667,112,12,52431.647
1972,6.2049,536,14.9833,158,11,52894.183
1973,6.6367,376,17.0667,123,10,53332.805
1974,6.2941,574,16.3,184,9,53689.61
1975,7.292,572,16.95,171,8,53955.042
1976,7.1211,418,17.65,247,7,54159.049
1977,6.2587,821,15.5833,87,6,54378.362
1978,7.186,763,15.8167,51,5,54602.193
The data file can be any type of file that R can read. In this case it is another .csv file. This file needs a synonym in order to be used in a report request.
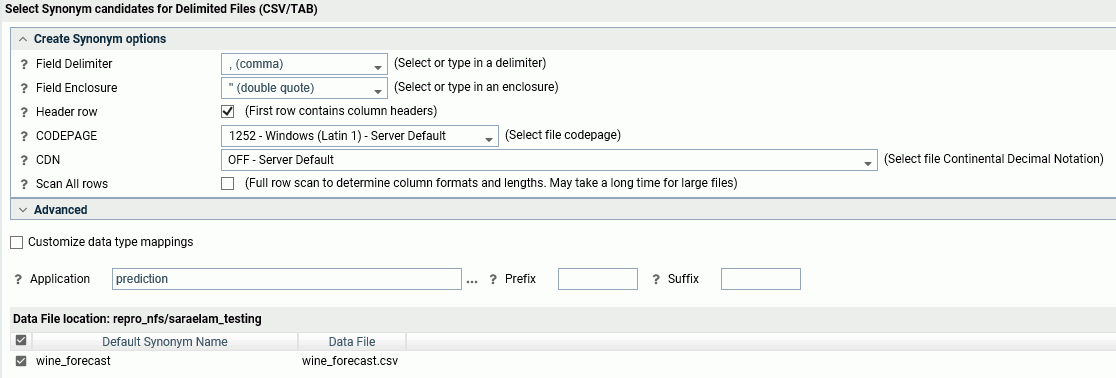
The following image shows the synonym creation page for wine_forecast.csv using the Adapter for Delimited Files.

Following is the generated Master File, wine_forecast.mas.
FILENAME=WINE_FORECAST, SUFFIX=DFIX    , CODEPAGE=1252,
   DATASET=prediction/wine_forecast.csv, $
SEGMENT=WINE_FORECAST, SEGTYPE=S0, $
    FIELDNAME=YEAR1, ALIAS=Year, USAGE=I6, ACTUAL=A5V,
      MISSING=ON,      TITLE='Year', $
    FIELDNAME=PRICE, ALIAS=Price, USAGE=D8.4, ACTUAL=A7V,
      MISSING=ON,      TITLE='Price', $
    FIELDNAME=WINTERRAIN, ALIAS=WinterRain, USAGE=I5, ACTUAL=A3V,
      MISSING=ON,      TITLE='WinterRain', $
    FIELDNAME=AGST, ALIAS=AGST, USAGE=D9.4, ACTUAL=A8V,
      MISSING=ON,      TITLE='AGST', $
    FIELDNAME=HARVESTRAIN, ALIAS=HarvestRain, USAGE=I5, ACTUAL=A3V,
      MISSING=ON,      TITLE='HarvestRain', $
    FIELDNAME=AGE, ALIAS=Age, USAGE=I4, ACTUAL=A2V,      MISSING=ON,      TITLE='Age', $
    FIELDNAME=FRANCEPOP, ALIAS=FrancePop, USAGE=D11.3, ACTUAL=A11V,
      MISSING=ON,      TITLE='FrancePop', $
Following is the generated Access File, wine_forecast.acx.
SEGNAME=WINE_FORECAST, DELIMITER=',', ENCLOSURE=", HEADER=YES, CDN=COMMAS_DOT, CONNECTION=<local>, $
The following request, wine_forecast_price_report.fex, uses the RSERVE bulit-in function to run the script and return a report.
-*wine_forecast_price_report.fex
TABLE FILE PREDICTION/WINE_FORECAST
PRINT
  YEAR
  WINTERRAIN
  AGST
  HARVESTRAIN
  AGE

  COMPUTE PREDICTED_PRICE/D18.2 MISSING ON ALL=
    RSERVE(prediction/wine_run_model, AGST, HARVESTRAIN, WINTERRAIN, AGE, Price);  AS 'Predicted,Price'

ON TABLE SET PAGE NOLEAD
ON TABLE SET STYLE *
GRID=OFF,$
ENDSTYLE
END
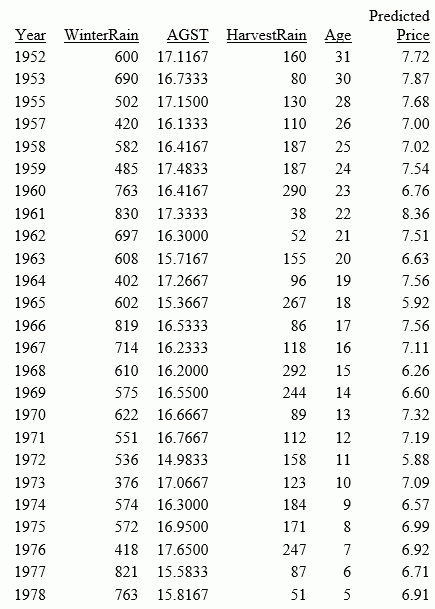
The output is shown in the following image.

| WebFOCUS | |
|
Feedback |