Debugging a Stored Procedure
|
Topics: |
The Web Console has a Dialogue Manager Debugger tool. Using this tool, you can execute a procedure that contains Dialogue Manager commands while watching and changing the values of the Dialogue Manager variables in the procedure. You can set and remove breakpoints in the procedure, step into each line of code, step over execution of external procedures, continue to a breakpoint, execute an ad-hoc procedure, and open HOLD files created in the procedure. You can save the session information of one debug session.
While the procedure is executing, the Dialogue Manager Debugger shows the values of all local variables, global variables, and, if requested, system variables. If a TABLE request is executed, the debugger shows the FOCUS stack with the commands being executed. If a variable that has not been defined is used in the procedure, the Dialogue Manager Debugger prompts you for a value.
Note that when the Dialogue Manager Debugger is executing a procedure, it is not running that procedure in an interactive FOCUS environment, so interactive Dialogue Manager commands (such as -PROMPT) that require a response from the user are not executed. While in a debugging session, you can open multiple procedures and Master Files. Each opens in its own tab.
Using the Dialogue Manager Debugger
The Dialogue Manager Debugger is for use with FOCUS procedures that contain Dialogue Manager commands.
To open a procedure in the Dialogue Manager Debugger, right-click the procedure, point to Run Advanced, and click Debug.
The procedure opens in the Dialogue Manager Debugger, as shown in the following image.
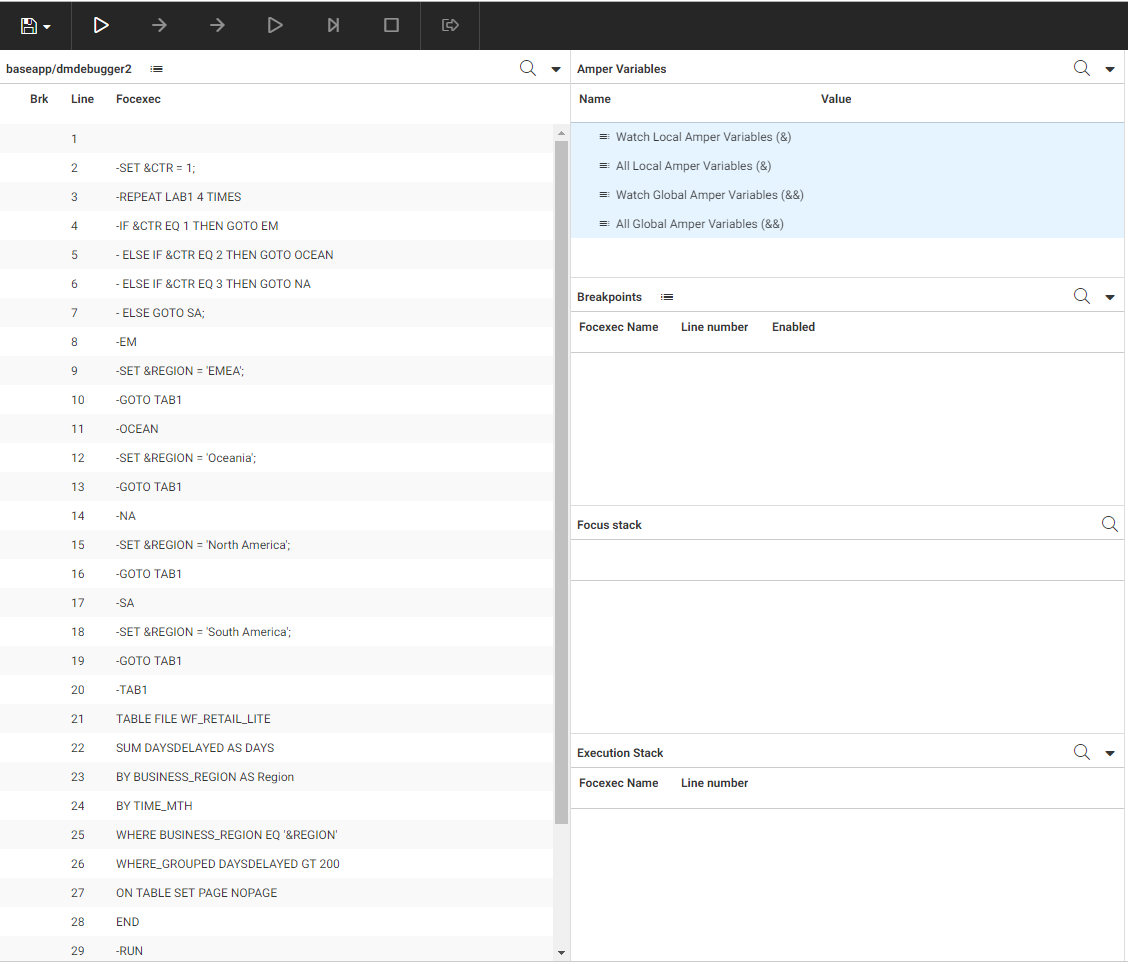
The left panel displays the procedure with line numbers. The Debug panel displays the variables and stacks used in the procedure. Once you start execution, an output panel opens on the right showing all output.
The Debug panel displays the following items.
- Watch Local Amper Variables (&). Displays values of the local variables you add to the list. Adding variables to this list enables you to change their values at breakpoints.
- All Local Amper Variables (&). Displays the values of all local variables in the procedure. You cannot change variable values from this list.
Note: If you want to include system variables, once the procedure is running, right-click All Local Amper Variables (&), and click Show system ampers.
- Watch Global Amper Variables (&&). Displays values of the global variables you add to the list. Adding variables to this list enables you to change their values at breakpoints.
- All Global Amper Variables (&&). Displays the values of all global variables in the procedure. You cannot change variable values from this list.
- Breakpoints. Lists the breakpoints you set.
- Focus stack. Lists the WebFOCUS commands being executed, for example, a TABLE request.
- Execution stack. Lists the procedures being executed. You can right-click a procedure and click View focexec to open the FOCEXEC in a tab in the left panel.
The Output panel shows report output and messages. It has an Output actions menu with the option Clear output, to clear the panel content.
Setting Breakpoints
To set a breakpoint, right-click a Dialogue Manager command line where you want the breakpoint to occur, and click Set Breakpoint.
A breakpoint is a stopping point for execution. You may want to set one or more breakpoints in order to examine or change variable values at those points, run an ad-hoc request, or open a HOLD file created in the procedure.
Once you set a breakpoint, a solid circle appears in the Brk column on that line of the procedure, and the breakpoint is added to the list of breakpoints in the Debug panel.
You can disable or clear a breakpoint by right-clicking the line where the breakpoint is set and clicking Disable Breakpoint or Clear Breakpoint. A disabled breakpoint appears as a white circle with only an outline.
You can also click the Breakpoint Actions menu in the Breakpoints section of the Debug panel and click one of the following options from the context menu.
- Add new breakpoint.
- Enable all breakpoints.
- Disable all breakpoints.
- Remove all breakpoints.
If you click Add new breakpoint, a dialog box opens for you to enter a procedure name and line number for the breakpoint.
If the breakpoint is for the current procedure, leave the Focexec text box blank.
If you want to set a breakpoint at the entry point of the procedure (whether or not it has a Dialogue Manager command), leave the line number blank.
Click Submit to set the breakpoint.
You can also set a breakpoint at the end of a file, even if there is no Dialogue Manager command on the line. Click the Breakpoint Actions menu in the Breakpoints section of the Debug panel and click Add new breakpoint. Enter the line number, and click Submit.
Watching Variables
To add variables to a watch list, right-click Watch Local Amper Variables (&) or Watch Global Amper Variables (&&), and click either Add new amper variable or Add all amper variables.
By default, as variables are set or changed, they are listed under All Local Amper Variables (&) or All Global Amper Variables (&&). You can add specific or all variables to the Watch Local Amper Variables (&) list or the Watch Global Amper Variables (&&) list, if you want to change their values at a breakpoint.
If you click Add new amper variable, a dialog box opens in which you enter the name of the variable to watch (without the preceding ampersands).
The variable is added to the watch list, as shown in the following image.
Debugging Steps
To start the debugger, click Start debugging on the ribbon.
The commands for executing the procedure and running an ad-hoc request become active.
If the procedure references a variable that has not been given a value, a dialog box opens to prompt you for a value when the variable is encountered.
The following options are available from the ribbon.
File Options
- Open Focexec. Opens a file picker dialog box that enables you to open a FOCEXEC file (.fex).
- Open Master. Opens a file picker dialog box that enables you to open a Master File (.mas).
- Open Hold File. Opens dialog box in which you can enter the name of a HOLD file created in the debugging session as long as the procedure is still running.
- Save Debug Session. Saves the current debugging session. Only one session can be saved. A new session will overwrite the existing saved session.
- Restore Debug Session. Restores the saved debugging session.
- Clear Debug Session. Clears the saved debugging session.
- Switch Viewing File. If you have opened or executed multiple files, lets you select among them.
- To close a file, click the X on its tab or open the Options menu on the tab and click Close. If only one file is open, it cannot be closed without closing the debugger.
- To close the debugger, along with any files open in the debugger, click the X at the top right of the debugger page.
Execution Options
- Start debugging. Starts the debugging session by activating the other execution buttons.
- Step into command. Steps into commands in an external procedure (invoked by the EX or -INCLUDE commands). Otherwise, Step into executes to the next Dialogue Manager command in the procedure.
- Step to next command. Executes to the next Dialogue Manager command in the procedure, bypassing commands in an external procedure (invoked by the EX or -INCLUDE command).
- Continue execution until next breakpoint. Executes all commands to the next breakpoint.
- Execute remainder of current focexec without stopping at breakpoints. Executes the remainder of the current procedure without stopping at breakpoints.
- Stop focexec execution. Ends the debugging session and stops the execution of all procedures in the execution stack. You can click Start to start a new debugging session.
- Enter and run ad hoc focexec. Opens a window for entering and running a FOCEXEC.
Enter a value and click Submit.
The following options are available on the Options menu for a file open in a tab:
- Scroll to line number. Opens a dialog box in which you can enter a line number. When you click OK, the file is scrolled to the specified line number.
- Edit. Opens the file in the text editor (not available for Master Files).
- Close. Closes the file.
Editing a FOCEXEC in the Debugger
On the Focexec/Master actions menu of a FOCEXEC tab, click Edit.
The file opens in the text editor, as shown in the following image.
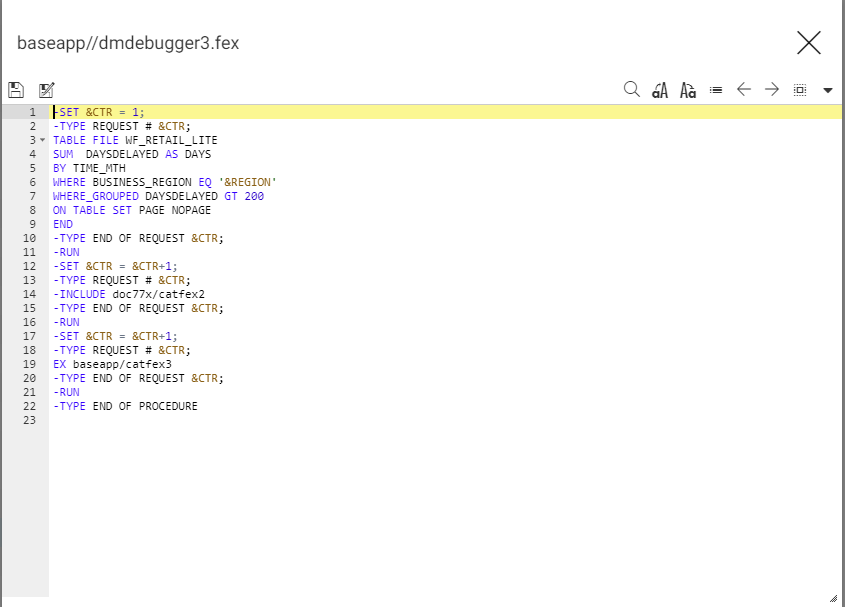
For information about using the text editor, see Editing a Stored Procedure.
Once you have made your edits, click Save. A message similar to the one in the following image displays.
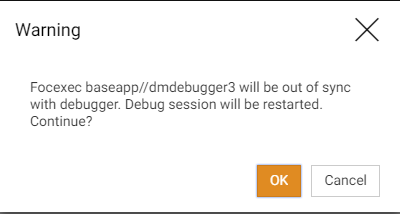
When you click OK, the file will be saved, and the debugging session will be restarted.
Note: Depending on the edits you made to the procedure, you may have to adjust your breakpoints so that they occur on the lines at which you want to break.
Dialogue Manager Debugger Sample Session
The following procedure is named dmdbugger3.fex. It includes a variable named &CTR whose value is set in the procedure, and a variable named ®ION whose value is not set in the procedure. The procedure contains a TABLE request and two external requests. The first external request displays output and the second creates a HOLD file named cathold.
-SET &CTR = 1; -TYPE REQUEST # &CTR; TABLE FILE WF_RETAIL_LITE SUM DAYSDELAYED AS DAYS BY TIME_MTH WHERE BUSINESS_REGION EQ '®ION' WHERE_GROUPED DAYSDELAYED GT 200 ON TABLE SET PAGE NOPAGE END -RUN -TYPE END OF REQUEST &CTR; -SET &CTR = &CTR+1; -TYPE REQUEST # &CTR; EX baseapp/catfex2 -RUN -TYPE END OF REQUEST &CTR; -SET &CTR = &CTR+1; -TYPE REQUEST # &CTR; EX baseapp/catfex3 -RUN -TYPE END OF REQUEST &CTR; -TYPE END OF PROCEDURE
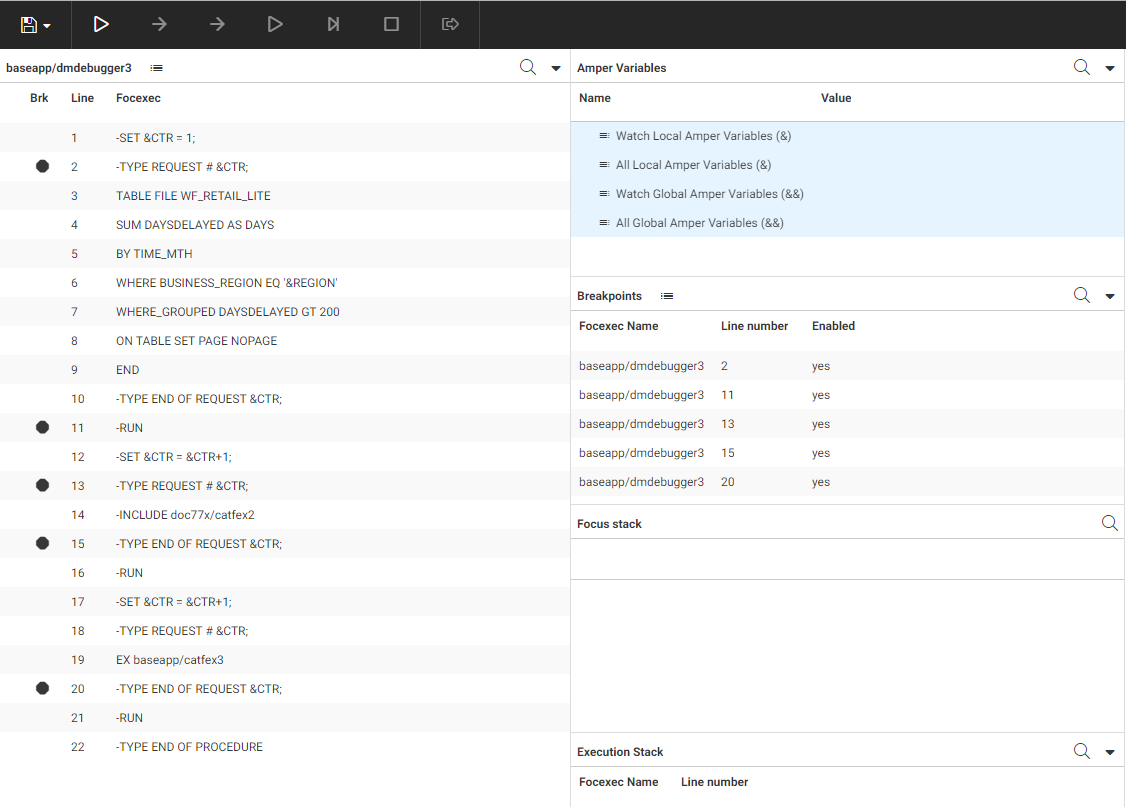
The following image shows this procedure open in the debugger, with breakpoints set on Dialogue Manager commands before and after each request. The breakpoints are listed on the Debug panel.
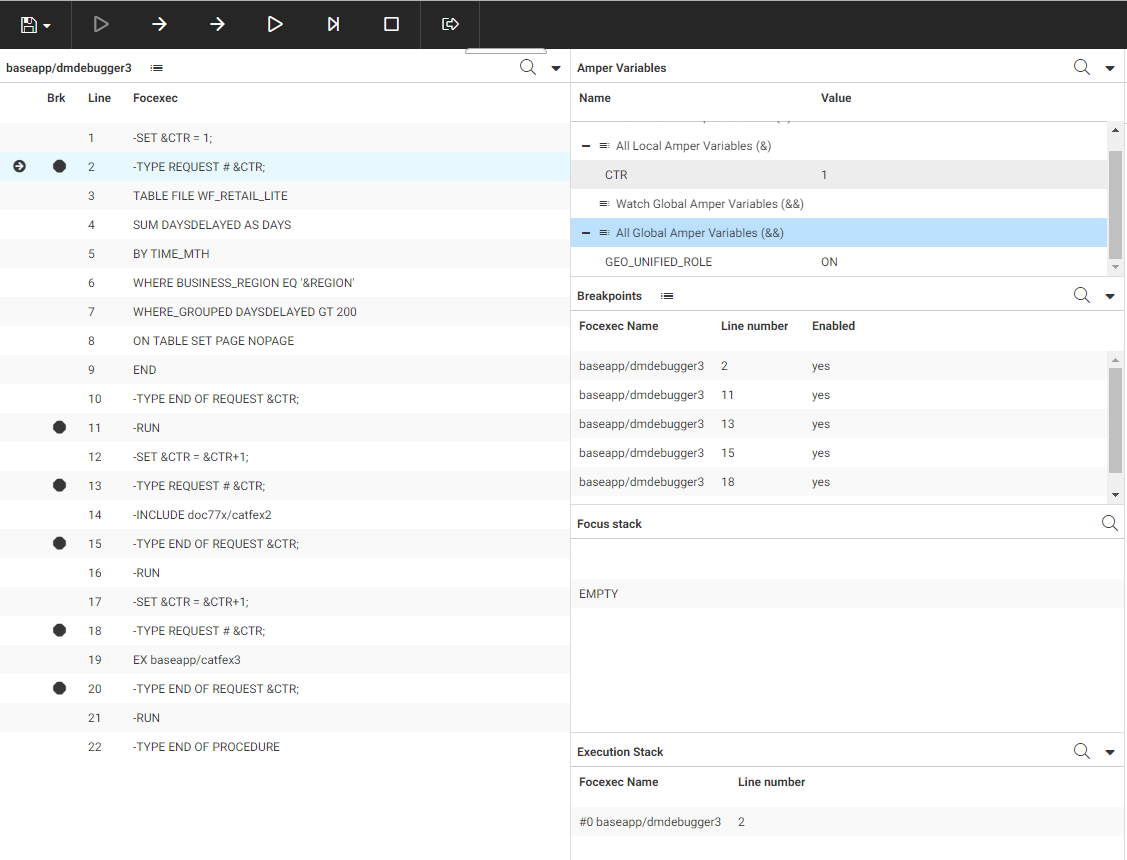
Clicking Start, then Step to next command stops at the first breakpoint. Click the plus signs (+) next to All Local Amper Variables (&) and All Global Amper Variables (&&). The value of the &CTR local variable is shown as 1. The value of the &&GEO_UNIFIED_ROLE global variable is shown as ON. The execution stack shows the name and line number of the procedure being executed, as shown in the following image.
Clicking Step into command opens the following dialog box that asks you to enter a value for the ®ION variable.
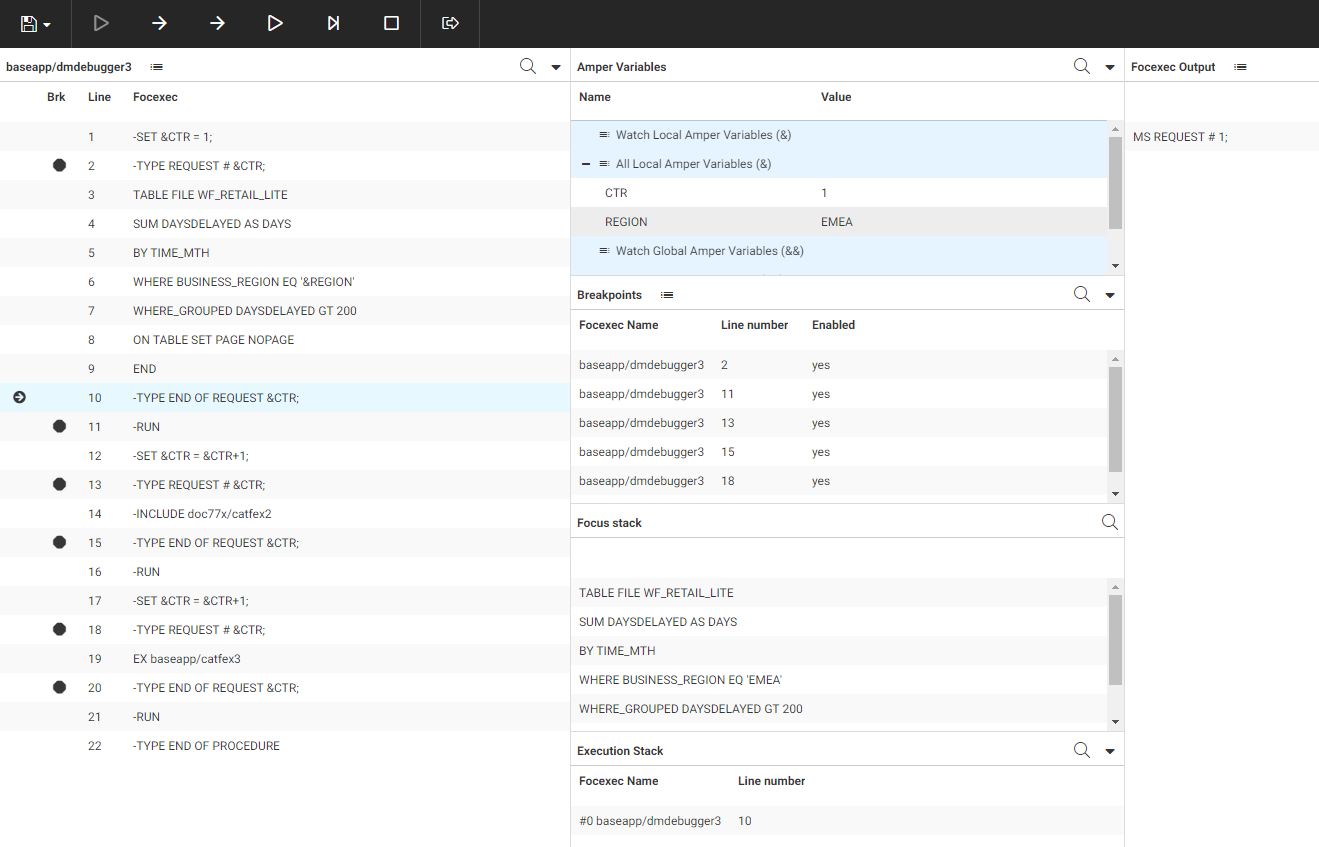
Entering EMEA and clicking Submit proceeds to the next Dialogue Manager command. REGION is added to the list of local variables, and the first -TYPE message displays in the output window. Also, before the request is actually run, the TABLE commands to be executed are listed on the Focus Stack, as shown in the following image.
After the request is run, the output displays in the output window. The next request in the procedure is issued using a -INCLUDE command. The external procedure is opened in the debugger if the last debugger command was Step into command, or the last debugger command was Step to next command and the external procedure contains a breakpoint on a line that will be executed.
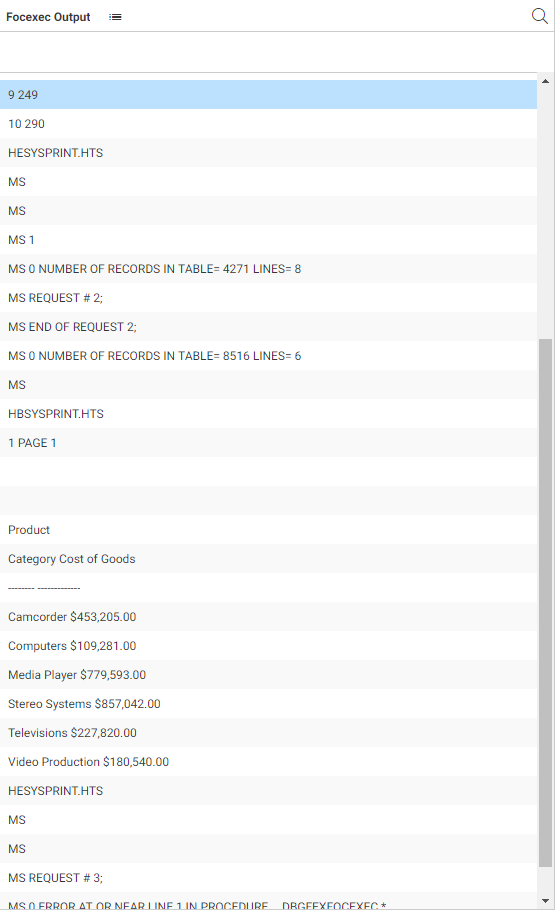
The last request in the procedure, run using an EX command, creates a HOLD file named cathold. After the request is run, but while the procedure is still running, you can open the HOLD file by clicking Open Hold File from the File menu, as shown in the following image.
A dialog box opens where you can enter the name of the hold file.
After you enter the name and click Submit, a report showing the HOLD file data displays in the output window, as shown in the following image.
To clear the output pane, click the Output actions menu, and click Clear output.
After the procedure finishes executing, the debugger stops. You can click Start to start a new execution.
| WebFOCUS | |
|
Feedback |