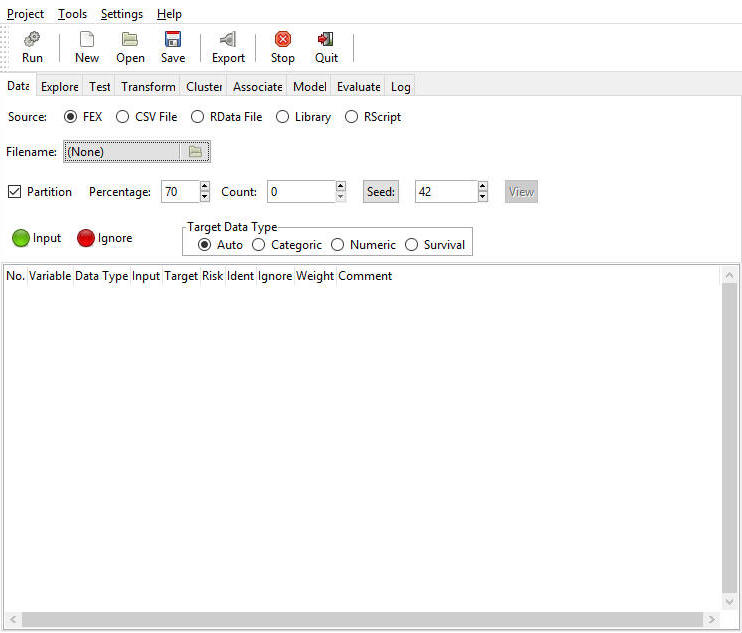
Loading Data From Within RStat
|
Topics: |
|
How to: |
If you have entered RStat without data loaded, or if you would like to load new data from within RStat, you can directly access the following data types for modeling:
- FEX
- CSV File
- RData File
- Library
- RScript
Note: A tooltip is available for all buttons listed.
Procedure: How to Load Data From a FEX
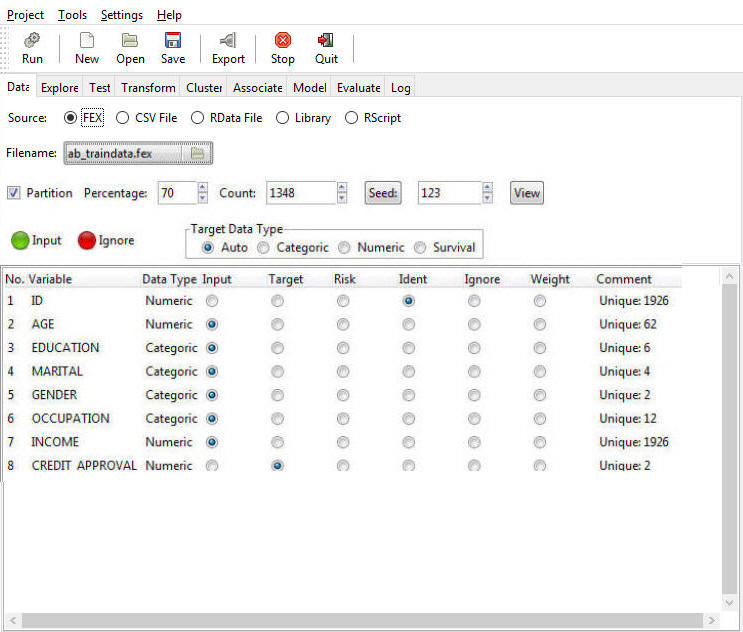
- On the Data tab, in the Source area, select FEX,
and then click the Filename button.
The Select FOCEXEC dialog box opens, as shown in the following image.
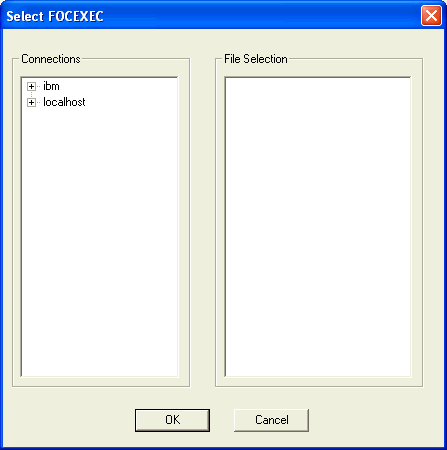
- Select the Reporting Server and application path containing
your FEX. The available FEXs are displayed in the right pane. An
example of the Select FOCEXEC dialog box is shown in the following
image.
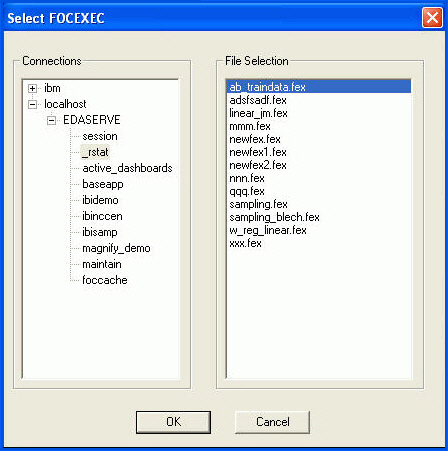
- Select the FEX you want to load and click OK.
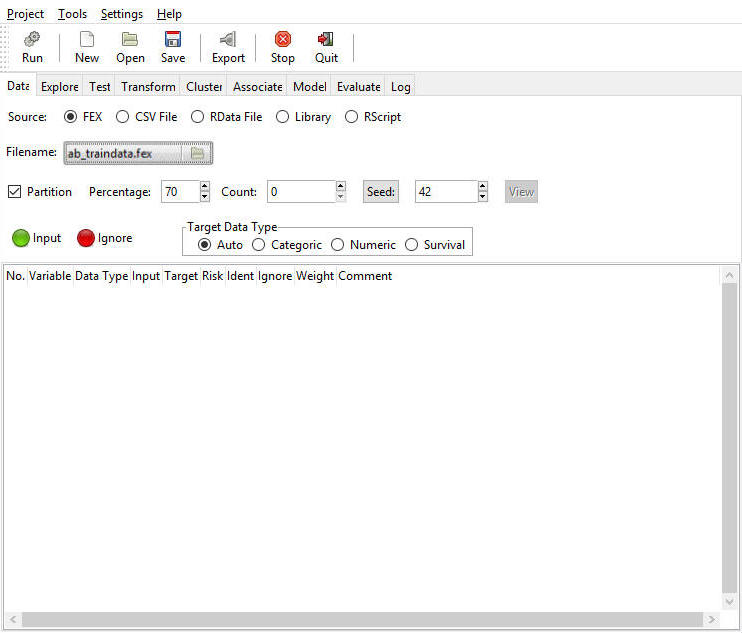
The file name of the FEX selected appears in the filename control, as shown in the following image.
- To run the selected FEX and load the data, click Run on
the toolbar.
The following image shows the results of running the selected FEX.
The FEX load process generates a HOLD file from the last TABLE FILE (Report canvas object) within the selected FEX. This HOLD file is named FEXNAME.CSV. In our example, we selected AB_TRAINDATA.FEX and App Studio generated and loaded AB_TRAINDATA.CSV.
With FEX selected as the Type option, you can see the path of the FEX that generated the CSV. If you select the CSV option, RStat shows that the generated CSV has been loaded, as shown in the following image.
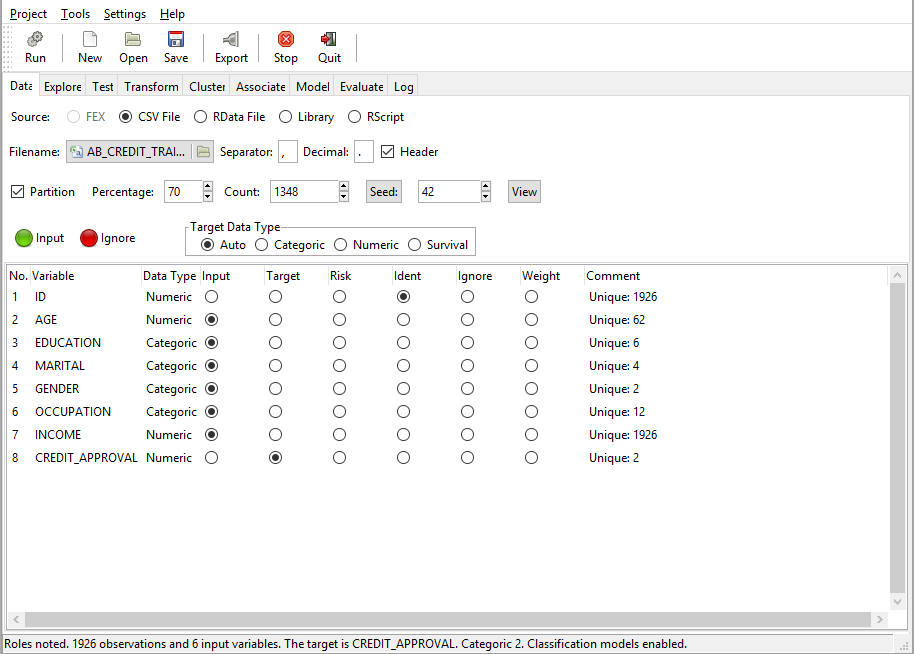
This offers the added benefit of allowing you to access the current data extract in the CSV HOLD file or to refresh the HOLD file from the data source by re-running the FEX.
Note: Each time you generate the FEX extract, the existing HOLD file will be overwritten with the new data extract. If you want to retain versions of the extract, rename it or save the file under a new name. You can use the Export function from RStat to create a copy of the extract under a new name.
Graphical Progress Bar
When working in RStat, information about the start, end or success of an execution or request is displayed in the status bar. The length of time taken is also shown for the models built.
The following images display an execution status on one or more of the following tabs:
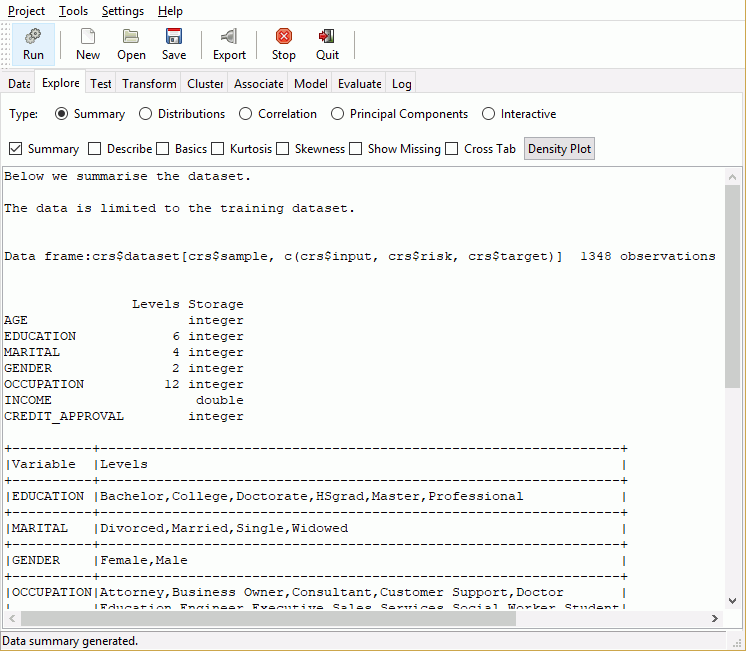
Data summary generated. Displayed on the Explore tab, this shows the data summary and offers additional information.
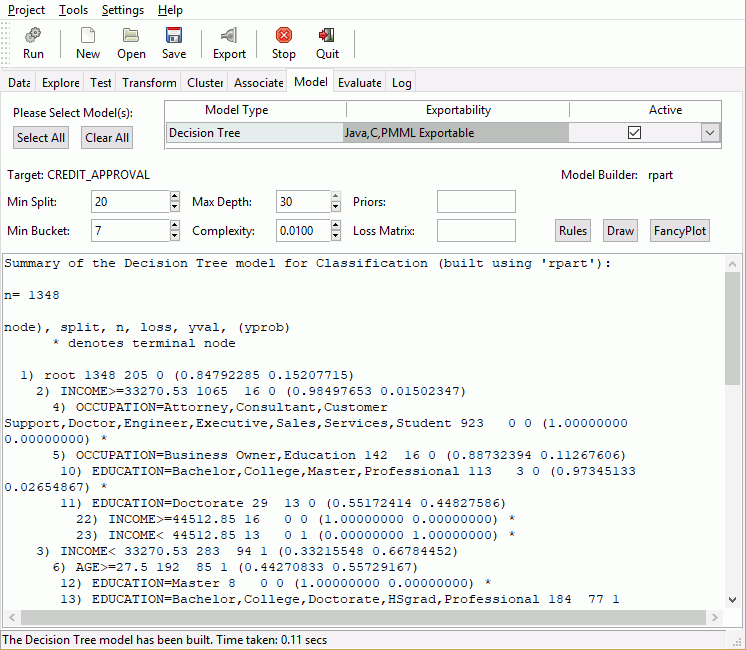
Model has been built. This information shows on the Model tab. Time taken is n seconds. It shows how long it took to build the model and the name of the model executed.
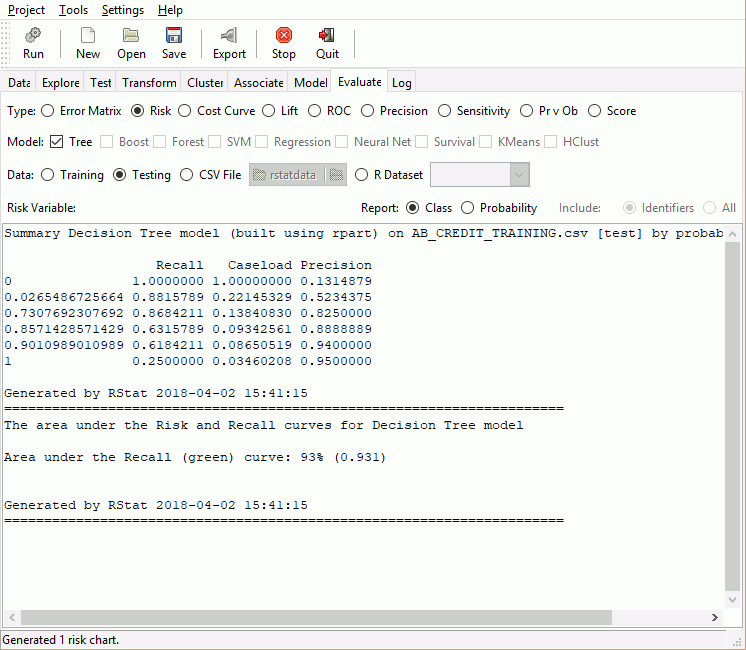
Generated 1 risk chart. Available on the Evaluation tab, this information displays when you run a Risk type of chart.
| WebFOCUS | |
|
Feedback |