Using JSON to Register Chart Events
|
How to: |
On an HTML5 chart, a DOM (Document Object Model) event, such as clicking an object on the chart, can be detected and used to trigger a response, such as invoking a callback function or going to a URL.
Syntax: How to Register Chart Events Using JSON
You can describe an array of events to the event dispatcher. Each event will trigger a corresponding response when the event occurs on the DOM nodes that match the properties listed in the event description.
"eventDispatcher": {
 "events" = [
  {response, event: 'string', object: 'string',
   userInfo: {custom: 'string'}, series: number, group: number,
   row: number, col: number,
   misc: 'string', userInfo: {custom: 'string'},
   context:  context, target:  'string' },
   .
   .
   .

 ]
}
where:
- response, ...
-
Required
Is the response to the event that matches the remaining parameters described by this entry in the array of events. Valid responses can be:
- Invoking a callback function.
callback: function(parm){function_code;}where:
- function(parm){function_code;}
-
Are the function parameters and the code invoked by the function.
- Going to a URL.
"url": "link_to_url"
where:
- "url": "link_to_url"
-
Is the URL to which you want to send the user.
- Invoking a callback function.
- event: 'string'
-
Required
Is a DOM event string such as 'mouseover', 'click', or 'keyup', that triggers the response for this event in the array of events.
- object: 'string'
-
Required
Is a string matching the object ID of the chart object (such as 'riser') on which to register the event.
- series: number
-
Optional
Is the series ID number of the riser series to match. If undefined, match all series.
- group: number
-
Optional
Is the group ID number of the riser groups to match. If undefined, match all groups.
- row: number
-
Optional
Is the matrix row ID to match. If undefined, match all rows.
- col: number
-
Optional
Is the matrix column ID to match. If undefined, match all columns.
- misc: 'string'
-
Optional
Is a miscellaneous object ID to match, for example, 'marker'. If undefined, match all misc IDs.
- userInfo: {custom: 'string'}
-
Optional
Is an extra, custom user-defined object to be passed back into the event callback.
- context: context
-
Optional
Defines 'this' in the event callback. If undefined, 'this' refers to the calling chart instance.
- target: 'string'
-
Optional
Is the target associated with a "url" property, used when triggering a URL click event. The default is '_blank', which instructs the browser to create a new browser tab or window when the user clicks the link.
Example: Registering Chart Events
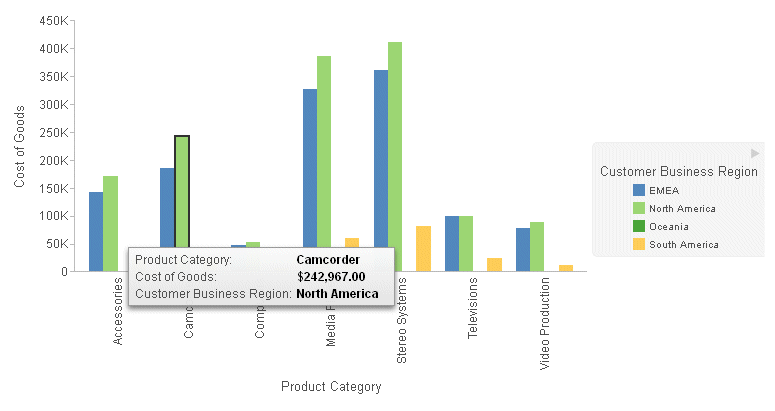
The following request registers two events. The first event logs the event parameters to the browser Web Console when the user clicks the riser for series 1 in group 1. The second event goes to the Information Builders web site when the user clicks a riser for series 2.
GRAPH FILE WF_RETAIL_LITE
SUM COGS_US
BY BUSINESS_REGION
BY PRODUCT_CATEGORY
ON GRAPH PCHOLD FORMAT JSCHART
ON GRAPH SET LOOKGRAPH BAR
ON GRAPH SET STYLE *
TYPE=DATA, COLUMN=PRODUCT_CATEGORY, BUCKET=x-axis,$
TYPE=DATA, COLUMN=BUSINESS_REGION, BUCKET=color,$
TYPE=DATA, COLUMN=cogs_us, BUCKET=y-axis,$
INCLUDE=IBFS:/FILE/IBI_HTML_DIR/javaassist/intl/EN/combine_templates/ENWarm.sty,$
*GRAPH_JS
"eventDispatcher": {
"events": [
	{callback: function(a){console.log(a);},
   event: 'click', object: 'riser',
   userInfo: {custom: 'Custom1'}, series: 1, group:1},
 {"url": "http://www.informationbuilders.com", target: '_blank',
    event: 'click', object: 'riser', series: 2},
	]
}
*END
ENDSTYLE
END
The following image shows the chart output with the riser for series 1 and group 1 clicked.

The following shows the parameters logged to the browser Web Console in response to the click event.

| WebFOCUS | |
|
Feedback |